Simple RNN

Understanding LSTM forward propagation in two ways

*This article is only for the sake of understanding the equations in the second page of the paper named “LSTM: A Search Space Odyssey”. If you have no trouble understanding the equations of LSTM forward propagation, I recommend you to skip this article and go the the next article.

1. Preface

I  heard that in Western culture, smart people write textbooks so that other normal people can understand difficult stuff, and that is why textbooks in Western countries tend to be bulky, but also they are not so difficult as they look. On the other hand in Asian culture, smart people write puzzling texts on esoteric topics, and normal people have to struggle to understand what noble people wanted to say. Publishers also require the authors to keep the texts as short as possible, so even though the textbooks are thin, usually students have to repeat reading the textbooks several times because usually they are too abstract.

Both styles have cons and pros, and usually I prefer Japanese textbooks because they are concise, and sometimes it is annoying to read Western style long texts with concrete straightforward examples to reach one conclusion. But a problem is that when it comes to explaining LSTM, almost all the text books are like Asian style ones. Every study material seems to skip the proper steps necessary for “normal people” to understand its algorithms. But after actually making concrete slides on mathematics on LSTM, I understood why: if you write down all the equations on LSTM forward/back propagation, that is going to be massive, and actually I had to make 100-page PowerPoint animated slides to make it understandable to people like me.

I already had a feeling that “Does it help to understand only LSTM with this precision? I should do more practical codings.” For example François Chollet, the developer of Keras, in his book, said as below.


For me that sounds like “We have already implemented RNNs for you, so just shut up and use Tensorflow/Keras.” Indeed, I have never cared about the architecture of my Mac Book Air, but I just use it every day, so I think he is to the point. To make matters worse, for me, a promising algorithm called Transformer seems to be replacing the position of LSTM in natural language processing. But in this article series and in my PowerPoint slides, I tried to explain as much as possible, contrary to his advice.

But I think, or rather hope,  it is still meaningful to understand this 23-year-old algorithm, which is as old as me. I think LSTM did build a generation of algorithms for sequence data, and actually Sepp Hochreiter, the inventor of LSTM, has received Neural Network Pioneer Award 2021 for his work.

I hope those who study sequence data processing in the future would come to this article series, and study basics of RNN just as I also study classical machine learning algorithms.

 *In this article “Densely Connected Layers” is written as “DCL,” and “Convolutional Neural Network” as “CNN.”

2. Why LSTM?

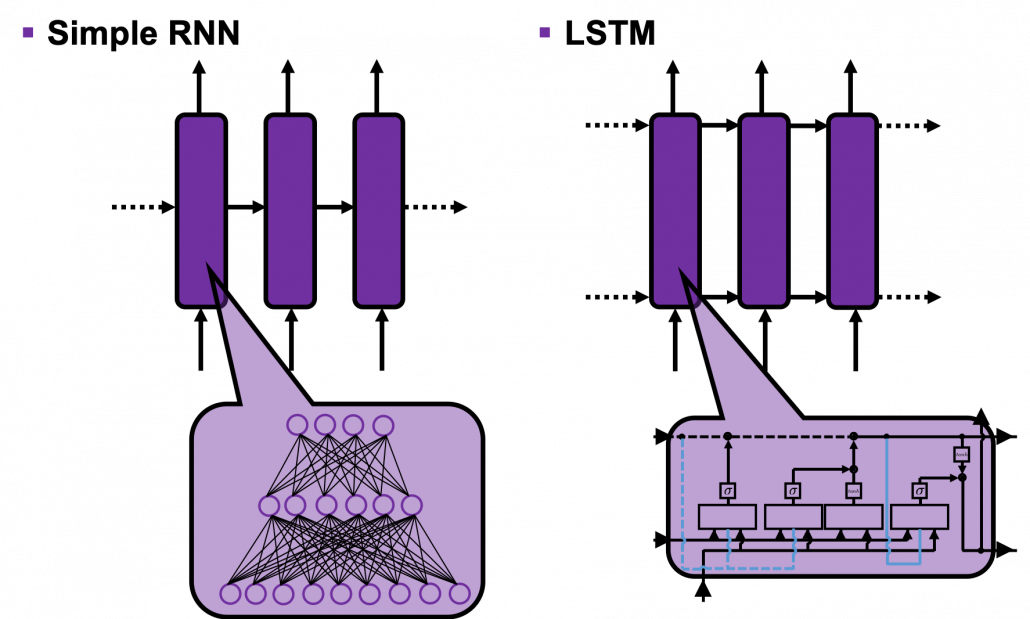
First of all, let’s take a brief look at what I said about the structures of RNNs,  in the first and the second article. A simple RNN is basically densely connected network with a few layers. But the RNN gets an input every time step, and it gives out an output at the time step. Part of information in the middle layer are succeeded to the next time step, and in the next time step, the RNN also gets an input and gives out an output. Therefore, virtually a simple RNN behaves almost the same way as densely connected layers with many layers during forward/back propagation if you focus on its recurrent connections.
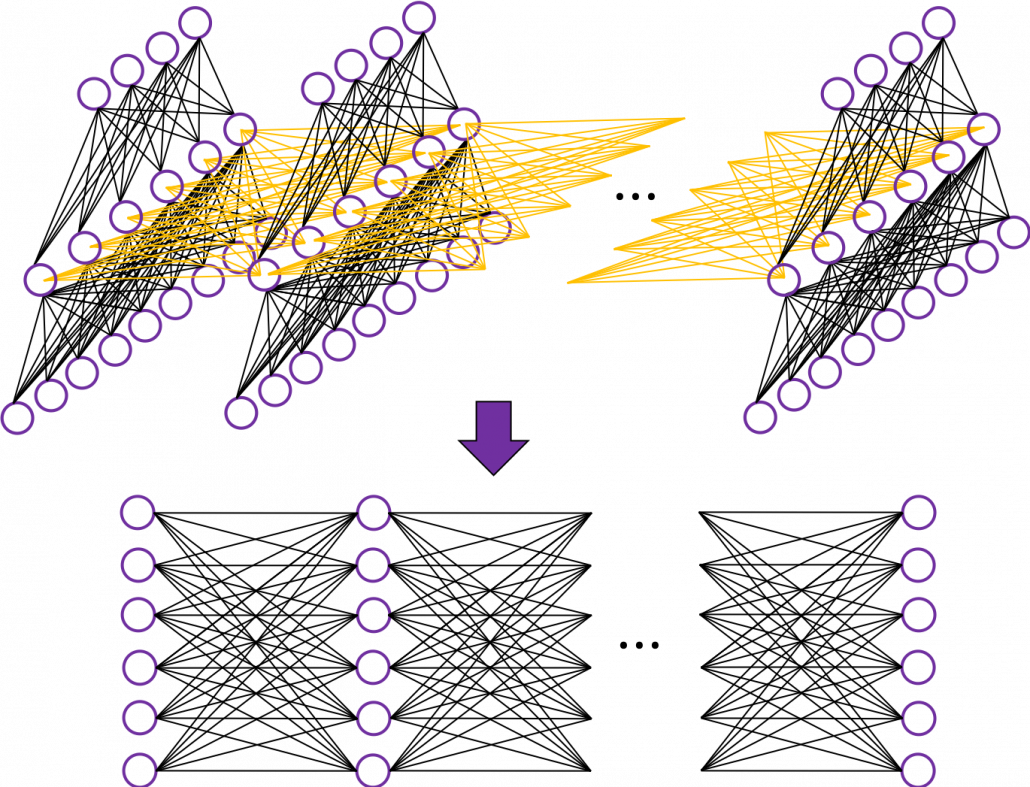
That is why simple RNNs suffer from vanishing/exploding gradient problems, where the information exponentially vanishes or explodes when its gradients are multiplied many times through many layers during back propagation. To be exact, I think you need to consider this problem precisely like you can see in this paper. But for now, please at least keep it in mind that when you calculate a gradient of an error function with respect to parameters of simple neural networks, you have to multiply parameters many times like below, and this type of calculation usually leads to vanishing/exploding gradient problem.

LSTM was invented as a way to tackle such problems as I mentioned in the last article.

3. How to display LSTM

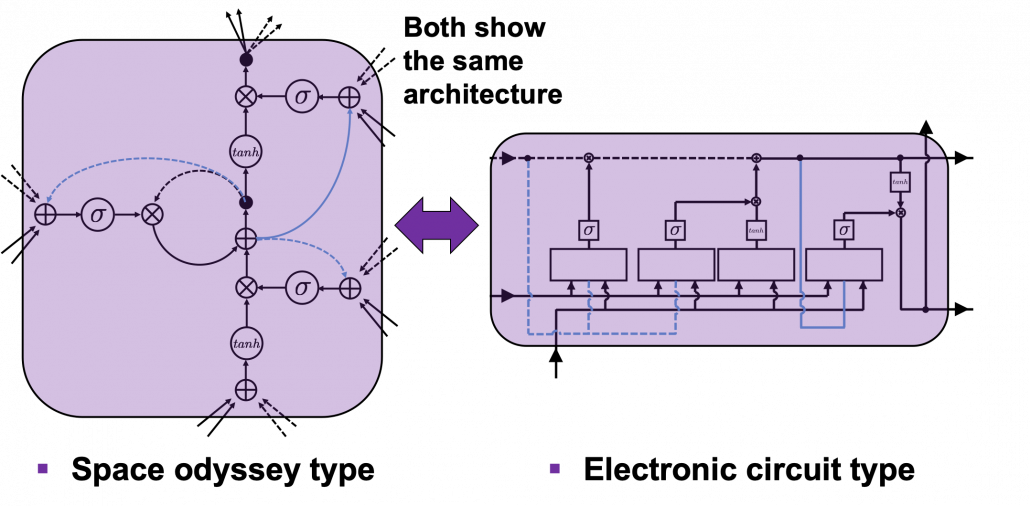
I would like you to just go to image search on Google, Bing, or Yahoo!, and type in “LSTM.” I think you will find many figures, but basically LSTM charts are roughly classified into two types: in this article I call them “Space Odyssey type” and “electronic circuit type”, and in conclusion, I highly recommend you to understand LSTM as the “electronic circuit type.”

*I just randomly came up with the terms “Space Odyssey type” and “electronic circuit type” because the former one is used in the paper I mentioned, and the latter one looks like an electronic circuit to me. You do not have to take how I call them seriously.

However, not that all the well-made explanations on LSTM use the “electronic circuit type,” and I am sure you sometimes have to understand LSTM as the “space odyssey type.” And the paper “LSTM: A Search Space Odyssey,” which I learned a lot about LSTM from,  also adopts the “Space Odyssey type.”

LSTM architectur visualization

The main reason why I recommend the “electronic circuit type” is that its behaviors look closer to that of simple RNNs, which you would have seen if you read my former articles.

*Behaviors of both of them look different, but of course they are doing the same things.

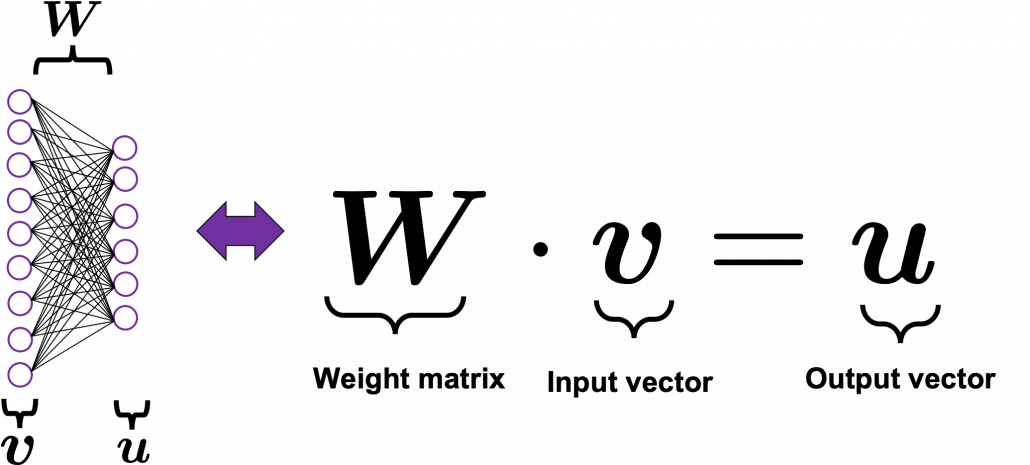
If you have some understanding on DCL, I think it was not so hard to understand how simple RNNs work because simple RNNs  are mainly composed of linear connections of neurons and weights, whose structures are the same almost everywhere. And basically they had only straightforward linear connections as you can see below.

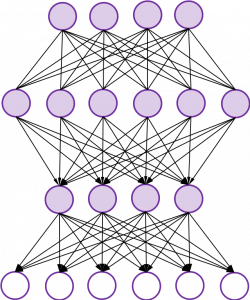
But from now on, I would like you to give up the ideas that LSTM is composed of connections of neurons like the head image of this article series. If you do that, I think that would be chaotic and I do not want to make a figure of it on Power Point. In short, sooner or later you have to understand equations of LSTM.

4. Forward propagation of LSTM in “electronic circuit type”

*For further understanding of mathematics of LSTM forward/back propagation, I recommend you to download my slides.

The behaviors of an LSTM block is quite similar to that of a simple RNN block: an RNN block gets an input every time step and gets information from the RNN block of the last time step, via recurrent connections. And the block succeeds information to the next block.

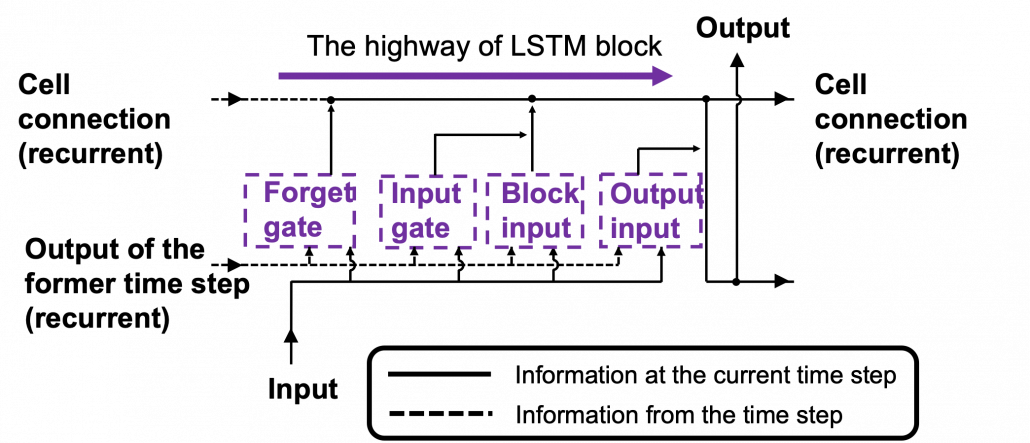
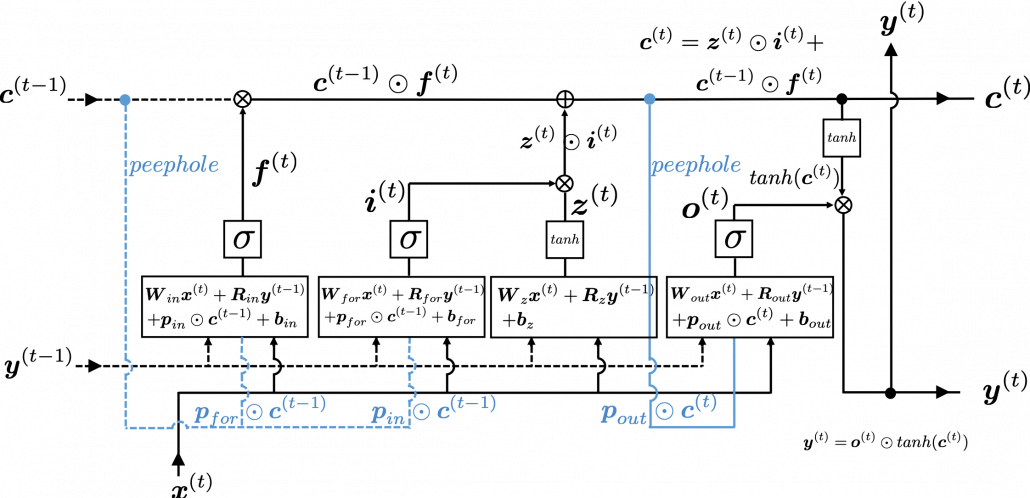
Let’s look at the simplified architecture of  an LSTM block. First of all, you should keep it in mind that LSTM have two streams of information: the one going through all the gates, and the one going through cell connections, the “highway” of LSTM block. For simplicity, we will see the architecture of an LSTM block without peephole connections, the lines in blue. The flow of information through cell connections is relatively uninterrupted. This helps LSTMs to retain information for a long time.

In a LSTM block, the input and the output of the former time step separately go through sections named “gates”: input gate, forget gate, output gate, and block input. The outputs of the forget gate, the input gate, and the block input join the highway of cell connections to renew the value of the cell.

*The small two dots on the cell connections are the “on-ramp” of cell conection highway.

*You would see the terms “input gate,” “forget gate,” “output gate” almost everywhere, but how to call the “block gate” depends on textbooks.

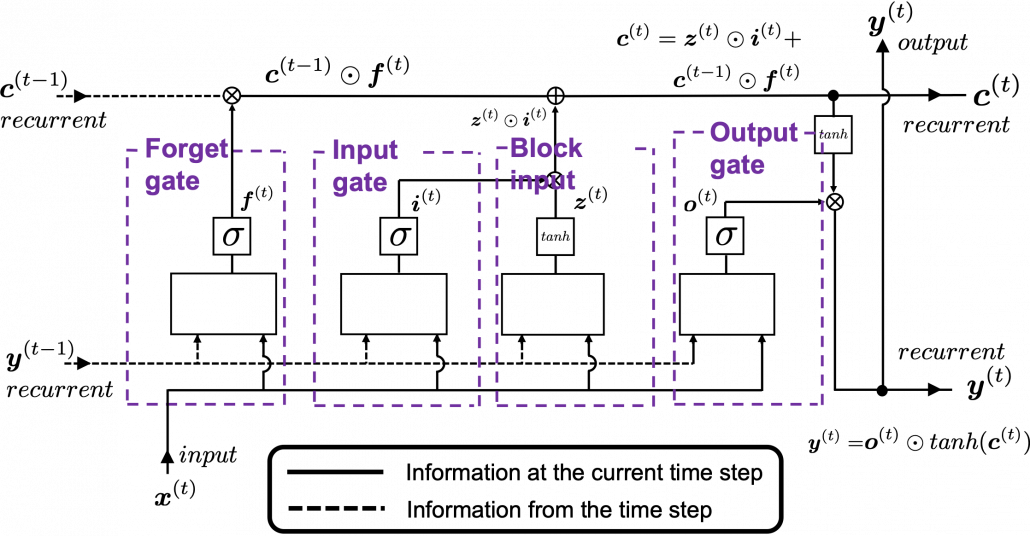
Let’s look at the structure of an LSTM block a bit more concretely. An LSTM block at the time step (t) gets \boldsymbol{y}^{(t-1)}, the output at the last time step,  and \boldsymbol{c}^{(t-1)}, the information of the cell at the time step (t-1), via recurrent connections. The block at time step (t) gets the input \boldsymbol{x}^{(t)}, and it separately goes through each gate, together with \boldsymbol{y}^{(t-1)}. After some calculations and activation, each gate gives out an output. The outputs of the forget gate, the input gate, the block input, and the output gate are respectively \boldsymbol{f}^{(t)}, \boldsymbol{i}^{(t)}, \boldsymbol{z}^{(t)}, \boldsymbol{o}^{(t)}. The outputs of the gates are mixed with \boldsymbol{c}^{(t-1)} and the LSTM block gives out an output \boldsymbol{y}^{(t)}, and gives \boldsymbol{y}^{(t)} and \boldsymbol{c}^{(t)} to the next LSTM block via recurrent connections.

You calculate \boldsymbol{f}^{(t)}, \boldsymbol{i}^{(t)}, \boldsymbol{z}^{(t)}, \boldsymbol{o}^{(t)} as below.

  • \boldsymbol{f}^{(t)}= \sigma(\boldsymbol{W}_{for} \boldsymbol{x}^{(t)} + \boldsymbol{R}_{for} \boldsymbol{y}^{(t-1)} +  \boldsymbol{b}_{for})
  • \boldsymbol{i}^{(t)}=\sigma(\boldsymbol{W}_{in} \boldsymbol{x}^{(t)} + \boldsymbol{R}_{in} \boldsymbol{y}^{(t-1)} + \boldsymbol{b}_{in})
  • \boldsymbol{z}^{(t)}=tanh(\boldsymbol{W}_z \boldsymbol{x}^{(t)} + \boldsymbol{R}_z \boldsymbol{y}^{(t-1)} + \boldsymbol{b}_z)
  • \boldsymbol{o}^{(t)}=\sigma(\boldsymbol{W}_{out} \boldsymbol{x}^{(t)} + \boldsymbol{R}_{out} \boldsymbol{y}^{(t-1)} + \boldsymbol{b}_{out})

*You have to keep it in mind that the equations above do not include peephole connections, which I am going to show with blue lines in the end.

The equations above are quite straightforward if you understand forward propagation of simple neural networks. You add linear products of \boldsymbol{y}^{(t)} and \boldsymbol{c}^{(t)} with different weights in each gate. What makes LSTMs different from simple RNNs is how to mix the outputs of the gates with the cell connections. In order to explain that, I need to introduce a mathematical operator called Hadamard product, which you denote as \odot. This is a very simple operator. This operator produces an elementwise product of two vectors or matrices with identical shape.

With this Hadamar product operator, the renewed cell and the output are calculated as below.

  • \boldsymbol{c}^{(t)} = \boldsymbol{z}^{(t)}\odot \boldsymbol{i}^{(t)} + \boldsymbol{c}^{(t-1)} \odot \boldsymbol{f}^{(t)}
  • \boldsymbol{y}^{(t)} = \boldsymbol{o}^{(t)} \odot tanh(\boldsymbol{c}^{(t)})

The values of \boldsymbol{f}^{(t)}, \boldsymbol{i}^{(t)}, \boldsymbol{z}^{(t)}, \boldsymbol{o}^{(t)} are compressed into the range of [0, 1] or [-1, 1] with activation functions. You can see that the input gate and the block input give new information to the cell. The part \boldsymbol{c}^{(t-1)} \odot \boldsymbol{f}^{(t)} means that the output of the forget gate “forgets” the cell of the last time step by multiplying the values from 0 to 1 elementwise. And the cell \boldsymbol{c}^{(t)} is activated with tanh() and the output of the output gate “suppress” the activated value of \boldsymbol{c}^{(t)}. In other words, the output gatedecides how much information to give out as an output of the LSTM block. The output of every gate depends on the input \boldsymbol{x}^{(t)}, and the recurrent connection \boldsymbol{y}^{(t-1)}. That means an LSTM block learns to forget the cell of the last time step, to renew the cell, and to suppress the output. To describe in an extreme manner, if all the outputs of every gate are always (1, 1, …1)^T, LSTMs forget nothing, retain information of inputs at every time step, and gives out everything. And  if all the outputs of every gate are always (0, 0, …0)^T, LSTMs forget everything, receive no inputs, and give out nothing.

This model has one problem: the outputs of each gate do not directly depend on the information in the cell. To solve this problem, some LSTM models introduce some flows of information from the cell to each gate, which are shown as lines in blue in the figure below.

LSTM inner architecture

LSTM models, for example the one with or without peephole connection, depend on the library you use, and the model I have showed is one of standard LSTM structure. However no matter how complicated structure of an LSTM block looks, you usually cover it with a black box as below and show its behavior in a very simplified way.

5. Space Odyssey type

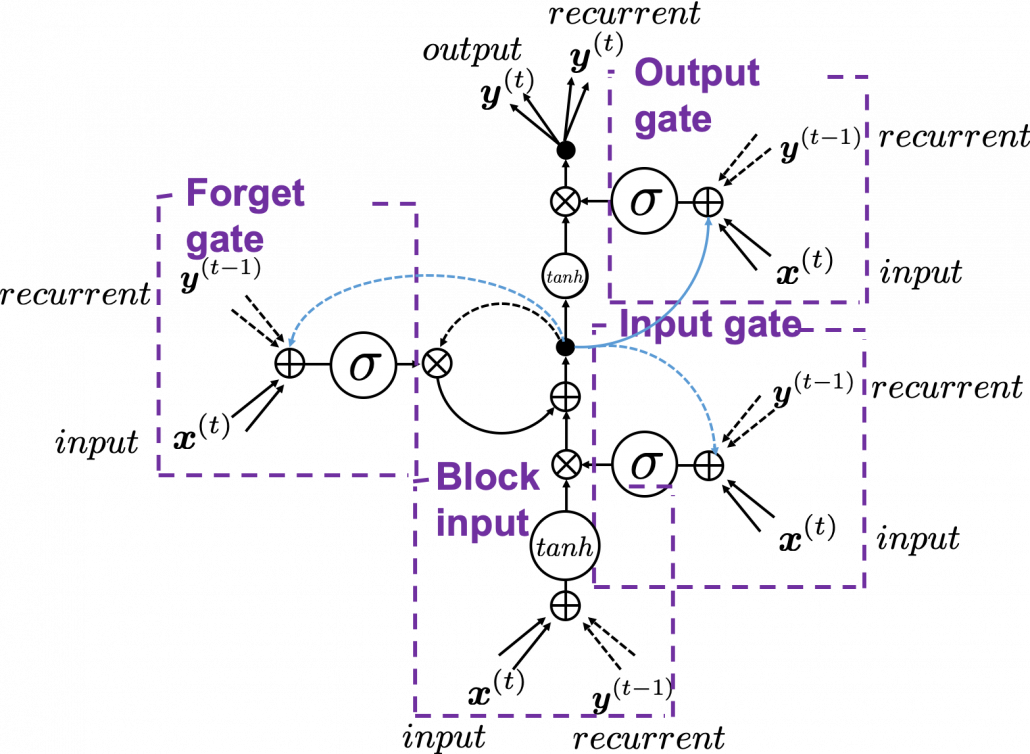
I personally think there is no advantages of understanding how LSTMs work with this Space Odyssey type chart, but in several cases you would have to use this type of chart. So I will briefly explain how to look at that type of chart, based on understandings of LSTMs you have gained through this article.

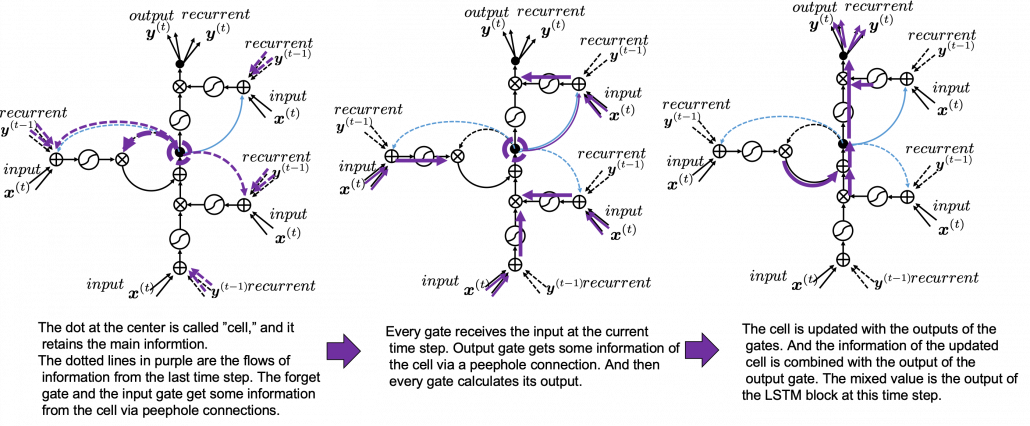
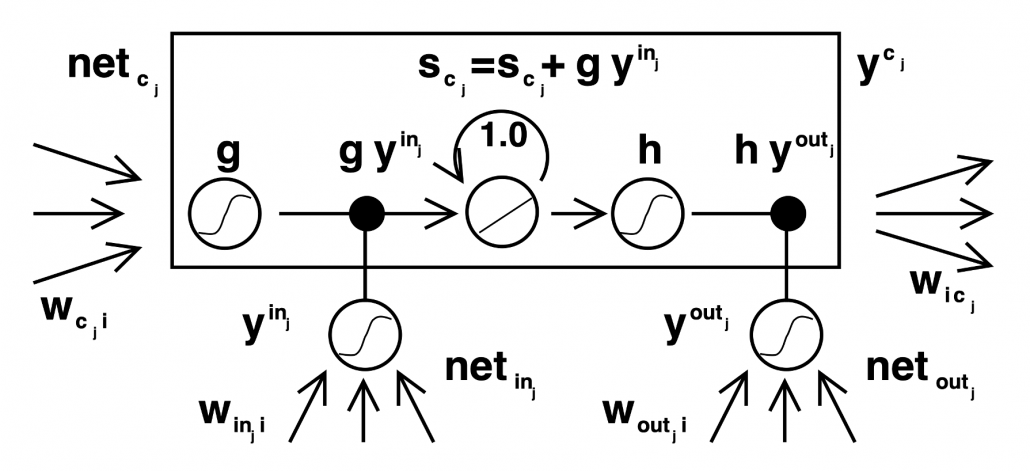
In Space Odyssey type of LSTM chart, at the center is a cell. Electronic circuit type of chart, which shows the flow of information of the cell as an uninterrupted “highway” in an LSTM block. On the other hand, in a Spacey Odyssey type of chart, the information of the cell rotate at the center. And each gate gets the information of the cell through peephole connections,  \boldsymbol{x}^{(t)}, the input at the time step (t) , sand \boldsymbol{y}^{(t-1)}, the output at the last time step (t-1), which came through recurrent connections. In Space Odyssey type of chart, you can more clearly see that the information of the cell go to each gate through the peephole connections in blue. Each gate calculates its output.

Just as the charts you have seen, the dotted line denote the information from the past. First, the information of the cell at the time step (t-1) goes to the forget gate and get mixed with the output of the forget cell In this process the cell is partly “forgotten.” Next, the input gate and the block input are mixed to generate part of new value of the the cell at time step  (t). And the partly “forgotten” \boldsymbol{c}^{(t-1)} goes back to the center of the block and it is mixed with the output of the input gate and the block input. That is how \boldsymbol{c}^{(t)} is renewed. And the value of new cell flow to the top of the chart, being mixed with the output of the output gate. Or you can also say the information of new cell is “suppressed” with the output gate.

I have finished the first four articles of this article series, and finally I am gong to write about back propagation of LSTM in the next article. I have to say what I have written so far is all for the next article, and my long long Power Point slides.


[References]

[1] Klaus Greff, Rupesh Kumar Srivastava, Jan Koutník, Bas R. Steunebrink, Jürgen Schmidhuber, “LSTM: A Search Space Odyssey,” (2017)

[2] Francois Chollet, Deep Learning with Python,(2018), Manning , pp. 202-204

[3] “Sepp Hochreiter receives IEEE CIS Neural Networks Pioneer Award 2021”, Institute of advanced research in artificial intelligence, (2020)
URL: https://www.iarai.ac.at/news/sepp-hochreiter-receives-ieee-cis-neural-networks-pioneer-award-2021/?fbclid=IwAR27cwT5MfCw4Tqzs3MX_W9eahYDcIFuoGymATDR1A-gbtVmDpb8ExfQ87A

[4] Oketani Takayuki, “Machine Learning Professional Series: Deep Learning,” (2015), pp. 120-125
岡谷貴之 著, 「機械学習プロフェッショナルシリーズ 深層学習」, (2015), pp. 120-125

[5] Harada Tatsuya, “Machine Learning Professional Series: Image Recognition,” (2017), pp. 252-257
原田達也 著, 「機械学習プロフェッショナルシリーズ 画像認識」, (2017), pp. 252-257

[6] “Understandable LSTM ~ With the Current Trends,” Qiita, (2015)
「わかるLSTM ~ 最近の動向と共に」, Qiita, (2015)
URL: https://qiita.com/t_Signull/items/21b82be280b46f467d1b

Simple RNN

A brief history of neural nets: everything you should know before learning LSTM

This series is not a college course or something on deep learning with strict deadlines for assignments, so let’s take a detour from practical stuff and take a brief look at the history of neural networks.

The history of neural networks is also a big topic, which could be so long that I had to prepare another article series. And usually I am supposed to begin such articles with something like “The term ‘AI’ was first used by John McCarthy in Dartmouth conference 1956…” but you can find many of such texts written by people with much more experiences in this field. Therefore I am going to write this article from my point of view, as an intern writing articles on RNN, as a movie buff, and as one of many Japanese men who spent a great deal of childhood with video games.

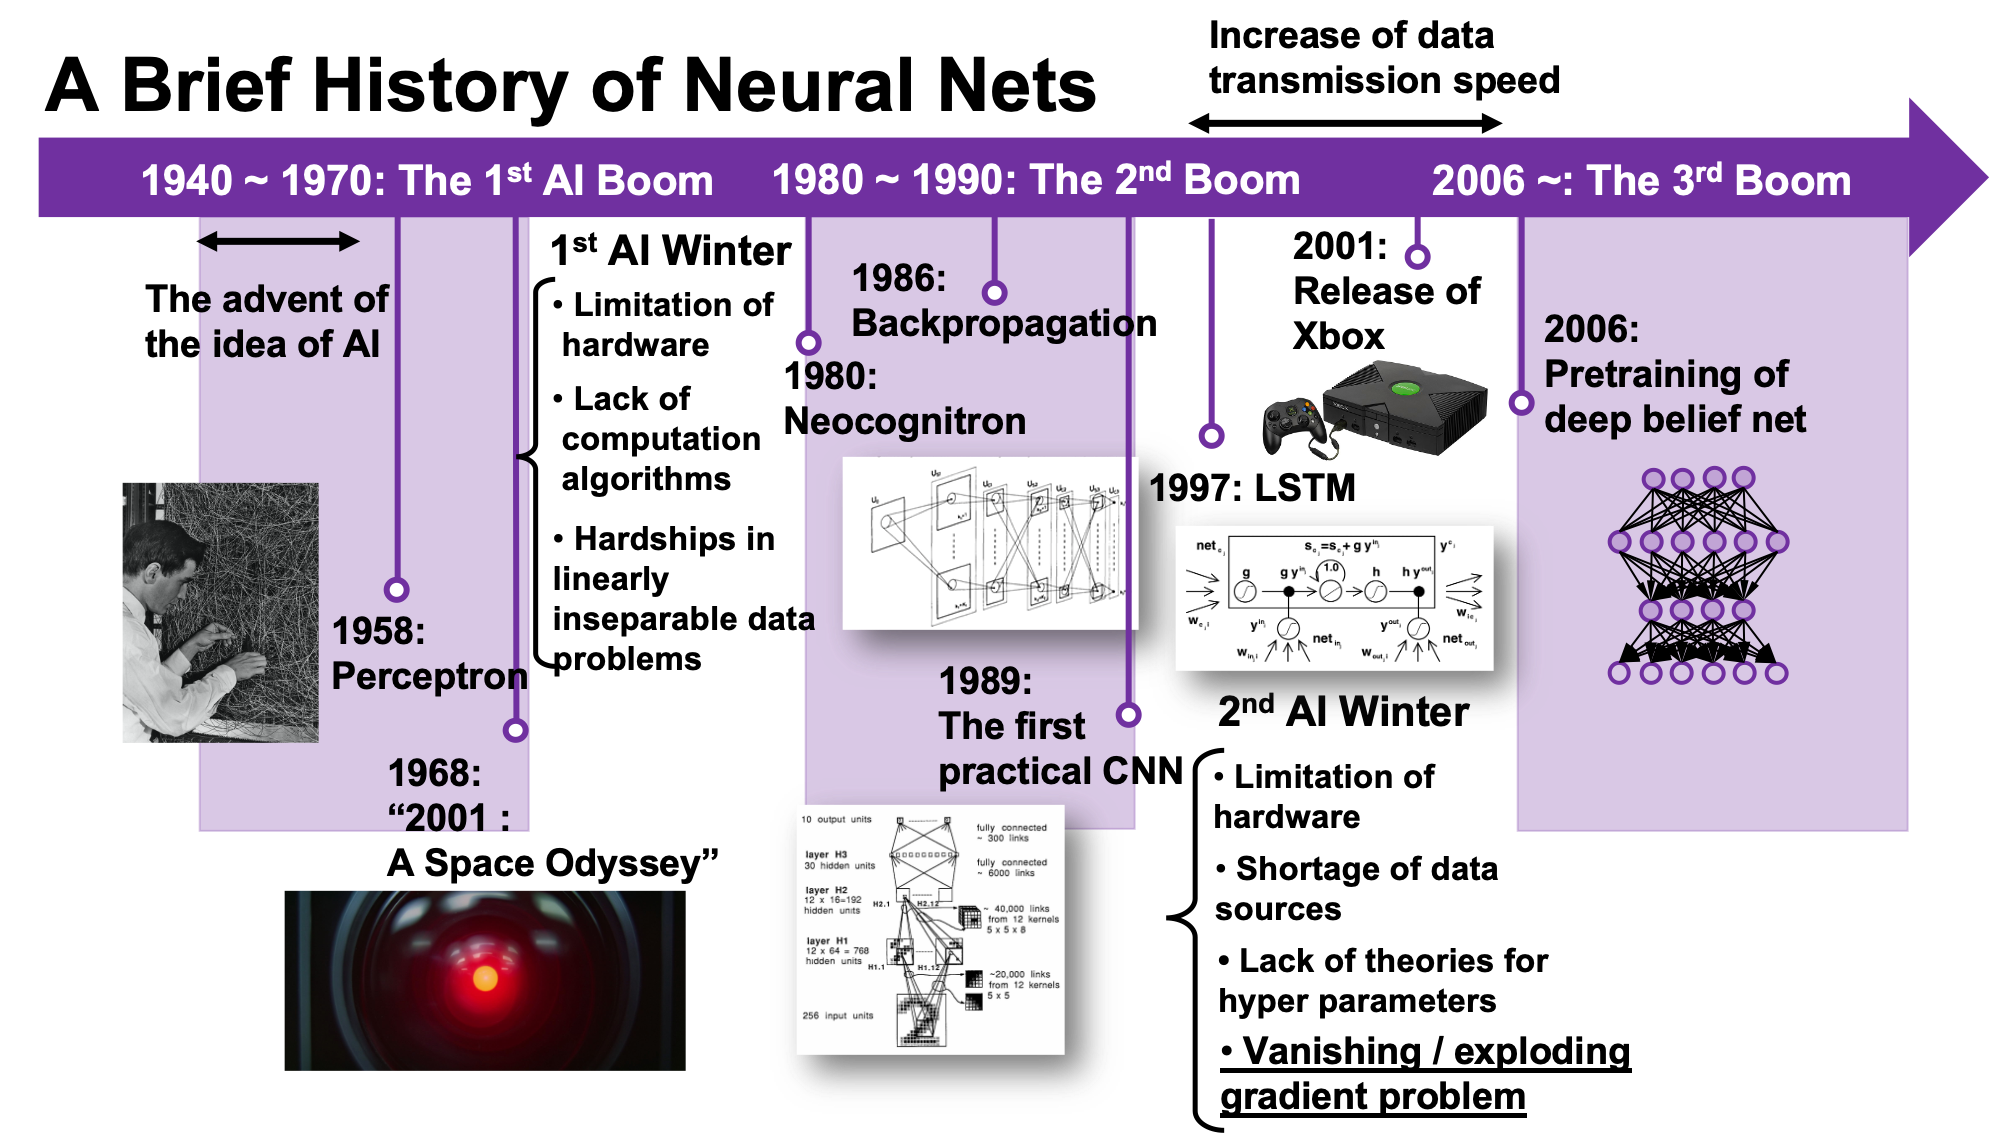
We are now in the third AI boom, and some researchers say this boom began in 2006. A professor in my university said there we are now in a kind of bubble economy in machine learning/data science industry, but people used to say “Stop daydreaming” to AI researchers. The second AI winter is partly due to vanishing/exploding gradient problem of deep learning. And LSTM was invented as one way to tackle such problems, in 1997.

1, First AI boom

In the first AI boom, I think people were literally “daydreaming.” Even though the applications of machine learning algorithms were limited to simple tasks like playing chess, checker, or searching route of 2d mazes, and sometimes this time is called GOFAI (Good Old Fashioned AI).

Source: https://www.youtube.com/watch?v=K-HfpsHPmvw&feature=youtu.be

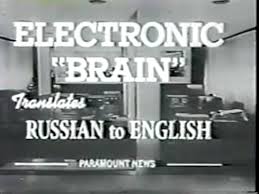
Even today when someone use the term “AI” merely for tasks with neural networks, that amuses me because for me deep learning is just statistically and automatically training neural networks, which are capable of universal approximation, into some classifiers/regressors. Actually the algorithms behind that is quite impressive, but the structure of human brains is much more complicated. The hype of “AI” already started in this first AI boom. Let me take an example of machine translation in this video. In fact the research of machine translation already started in the early 1950s, and of  specific interest in the time was translation between English and Russian due to Cold War. In the first article of this series, I said one of the most famous applications of RNN is machine translation, such as Google Translation, DeepL. They are a type of machine translation called neural machine translation because they use neural networks, especially RNNs. Neural machine translation was an astonishing breakthrough around 2014 in machine translation field. The former major type of machine translation was statistical machine translation, based on statistical language models. And the machine translator in the first AI boom was rule base machine translators, which are more primitive than statistical ones.

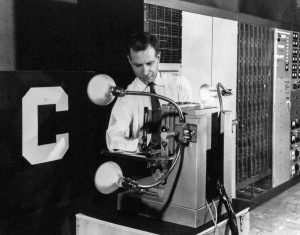
Source: https://news.cornell.edu/stories/2019/09/professors-perceptron-paved-way-ai-60-years-too-soon

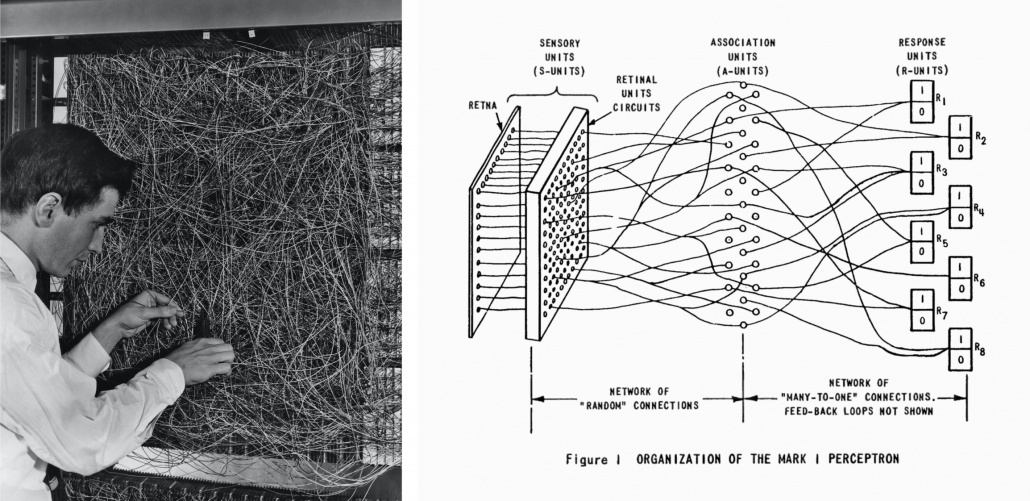
The most remarkable invention in this time was of course perceptron by Frank Rosenblatt. Some people say that this is the first neural network. Even though you can implement perceptron with a-few-line codes in Python, obviously they did not have Jupyter Notebook in those days. The perceptron was implemented as a huge instrument named Mark 1 Perceptron, and it was composed of randomly connected wires. I do not precisely know how it works, but it was a huge effort to implement even the most primitive type of neural networks. They needed to use a big lighting fixture to get a 20*20 pixel image using 20*20 array of cadmium sulphide photocells. The research by Rosenblatt, however, was criticized by Marvin Minsky in his book because perceptrons could only be used for linearly separable data. To make matters worse the criticism prevailed as that more general, multi-layer perceptrons were also not useful for linearly inseparable data (as I mentioned in the first article, multi-layer perceptrons, namely normal neural networks,  can be universal approximators, which have potentials to classify/regress various types of complex data). In case you do not know what “linearly separable” means, imagine that there are data plotted on a piece of paper. If an elementary school kid can draw a border line between two clusters of the data with a ruler and a pencil on the paper, the 2d data is “linearly separable”….

With big disappointments to the research on “electronic brains,” the budget of AI research was reduced and AI research entered its first winter.

Source: https://www.nzz.ch/digital/ehre-fuer-die-deep-learning-mafia-ld.1472761?reduced=true and https://anatomiesofintelligence.github.io/posts/2019-06-21-organization-mark-i-perceptron

I think  the frame problem(1969),  by John McCarthy and Patrick J. Hayes, is also an iconic theory in the end of the first AI boom. This theory is known as a story of creating a robot trying to pull out its battery on a wheeled wagon in a room. The first prototype of the robot, named R1, naively tried to pull out the wagon form the room, and the bomb exploded. The problems was obvious: R1 was not programmed to consider the risks by taking each action, so the researchers made the next prototype named R1D1, which was programmed to consider the potential risks of taking each action. When R1D1 tried to pull out the wagon, it realized the risk of pulling the bomb together with the battery. But soon it started considering all the potential risks, such as the risk of the ceiling falling down, the distance between the wagon and all the walls, and so on, when the bomb exploded. The next problem was also obvious: R1D1 was not programmed to distinguish if the factors are relevant of irrelevant to the main purpose, and the next prototype R2D1 was programmed to do distinguish them. This time, R2D1 started thinking about “whether the factor is  irrelevant to the main purpose,” on every factor measured, and again the bomb exploded. How can we get a perfect AI, R2D2?

The situation of mentioned above is a bit extreme, but it is said AI could also get stuck when it try to take some super simple actions like finding a number in a phone book and make a phone call. It is difficult for an artificial intelligence to decide what is relevant and what is irrelevant, but humans will not get stuck with such simple stuff, and sometimes the frame problem is counted as the most difficult and essential problem of developing AI. But personally I think the original frame problem was unreasonable in that McCarthy, in his attempts to model the real world, was inflexible in his handling of the various equations involved, treating them all with equal weight regardless of the particular circumstances of a situation. Some people say that McCarthy, who was an advocate for AI, also wanted to see the field come to an end, due to its failure to meet the high expectations it once aroused.

Not only the frame problem, but also many other AI-related technological/philosophical problems have been proposed, such as Chinese room (1980), the symbol grounding problem (1990), and they are thought to be as hardships in inventing artificial intelligence, but I omit those topics in this article.

*The name R2D2 did not come from the famous story of frame problem. The story was Daniel Dennett first proposed the story of R2D2 in his paper published in 1984. Star Wars was first released in 1977. It is said that the name R2D2 came from “Reel 2, Dialogue 2,” which George Lucas said while film shooting. And the design of C3PO came from Maria in Metropolis(1927). It is said that the most famous AI duo in movie history was inspired by Tahei and Matashichi in The Hidden Fortress(1958), directed by Kurosawa Akira.

Source: https://criterioncollection.tumblr.com/post/135392444906/the-original-r2-d2-and-c-3po-the-hidden-fortress

Interestingly, in the end of the first AI boom, 2001: A Space Odyssey, directed by Stanley Kubrick, was released in 1968. Unlike conventional fantasylike AI characters, for example Maria in Metropolis(1927), HAL 9000 was portrayed as a very realistic AI, and the movie already pointed out the risk of AI being insane when it gets some commands from several users. HAL 9000 still has been a very iconic character in AI field. For example when you say some quotes from 2001: A Space Odyssey to Siri you get some parody responses. I also thin you should keep it in mind that in order to make an AI like HAL 9000 come true, for now RNNs would be indispensable in many ways: you would need RNNs for better voice recognition, better conversational system, and for reading lips.

Source: https://imgflip.com/memetemplate/34339860/Open-the-pod-bay-doors-Hal

*Just as you cannot understand Monty Python references in Python official tutorials without watching Monty Python and the Holy Grail, you cannot understand many parodies in AI contexts without watching 2001: A Space Odyssey. Even though the movie had some interview videos with some researchers and some narrations, Stanley Kubrick cut off all the footage and made the movie very difficult to understand. Most people did not or do not understand that it is a movie about aliens who gave homework of coming to Jupiter to human beings.

2, Second AI boom/winter

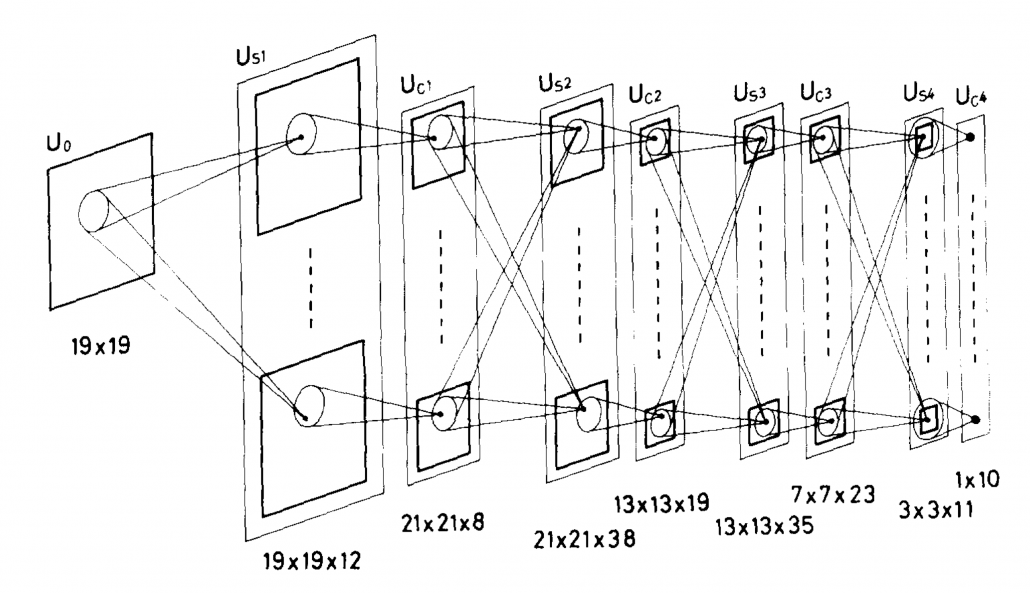
Source: Fukushima Kunihiko, “Neocognitron: A self-organizing neural network model for a mechanism of pattern recognition unaffected by shift in position,” (1980)

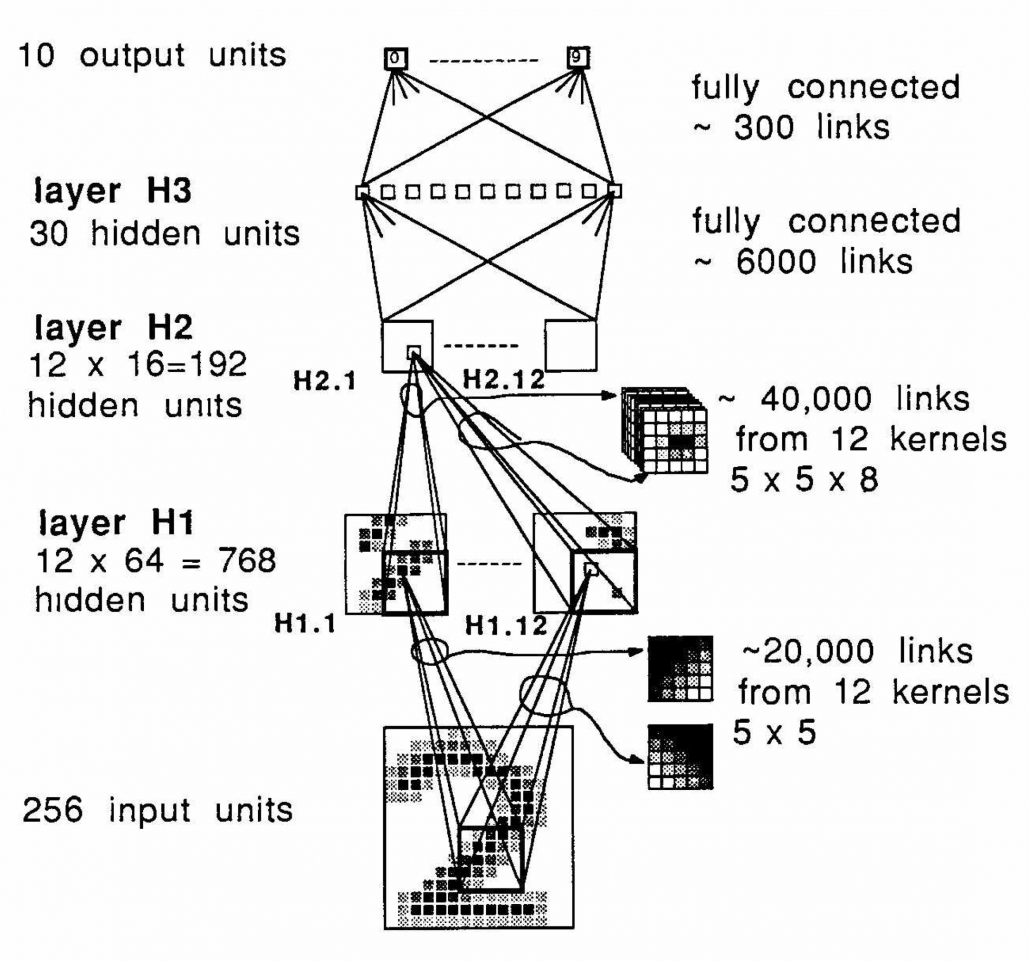
I am not going to write about the second AI boom in detail, but at least you should keep it in mind that convolutional neural network(CNN) is a keyword in this time. Neocognitron, an artificial model of how sight nerves perceive thing, was invented by Kunihiko Fukushima in 1980, and the model is said to be the origin on CNN. And Neocognitron got inspired by the Hubel and Wiesel’s research on sight nerves. In 1989, a group in AT & T Bell Laboratory led by Yann LeCun invented the first practical CNN to read handwritten digit.

Y. LeCun, “Backpropagation Applied to Handwritten Zip Code Recognition,” (1989)

Another turning point in this second AI boom was that back propagation algorithm was discovered, and the CNN by LeCun was also trained with back propagation. LeCun made a deep neural networks with some layers in 1998 for more practical uses.

But his research did not gain so much attention like today, because AI research entered its second winter at the beginning of the 1990s, and that was partly due to vanishing/exploding gradient problem of deep learning. People knew that neural networks had potentials of universal approximation, but when they tried to train naively stacked neural nets, the gradients, which you need for training neural networks, exponentially increased/decreased. Even though the CNN made by LeCun was the first successful case of “deep” neural nets which did not suffer from the vanishing/exploding gradient problem so much, deep learning research also stagnated in this time.

The ultimate goal of this article series is to understand LSTM at a more abstract/mathematical level because it is one of the practical RNNs, but the idea of LSTM (Long Short Term Memory) itself was already proposed in 1997 as an RNN algorithm to tackle vanishing gradient problem. (Exploding gradient problem is solved with a technique named gradient clipping, and this is easier than techniques for preventing vanishing gradient problems. I am also going to explain it in the next article.) After that some other techniques like introducing forget gate, peephole connections, were discovered, but basically it took some 20 years till LSTM got attentions like today. The reasons for that is lack of hardware and data sets, and that was also major reasons for the second AI winter.

Source: Sepp HochreiterJürgen, Schmidhuber, “Long Short-term Memory,” (1997)

In the 1990s, the mid of second AI winter, the Internet started prevailing for commercial uses. I think one of the iconic events in this time was the source codes WWW(World Wide Web) were announced in 1993. Some of you might still remember that you little by little became able to transmit more data online in this time. That means people came to get more and more access to various datasets in those days, which is indispensable for machine learning tasks.

After all, we could not get HAL 9000 by the end of 2001, but instead we got Xbox console.

3, Video game industry and GPU

Even though research on neural networks stagnated in the 1990s the same period witnessed an advance in the computation of massive parallel linear transformations, due to their need in fields such as image processing.

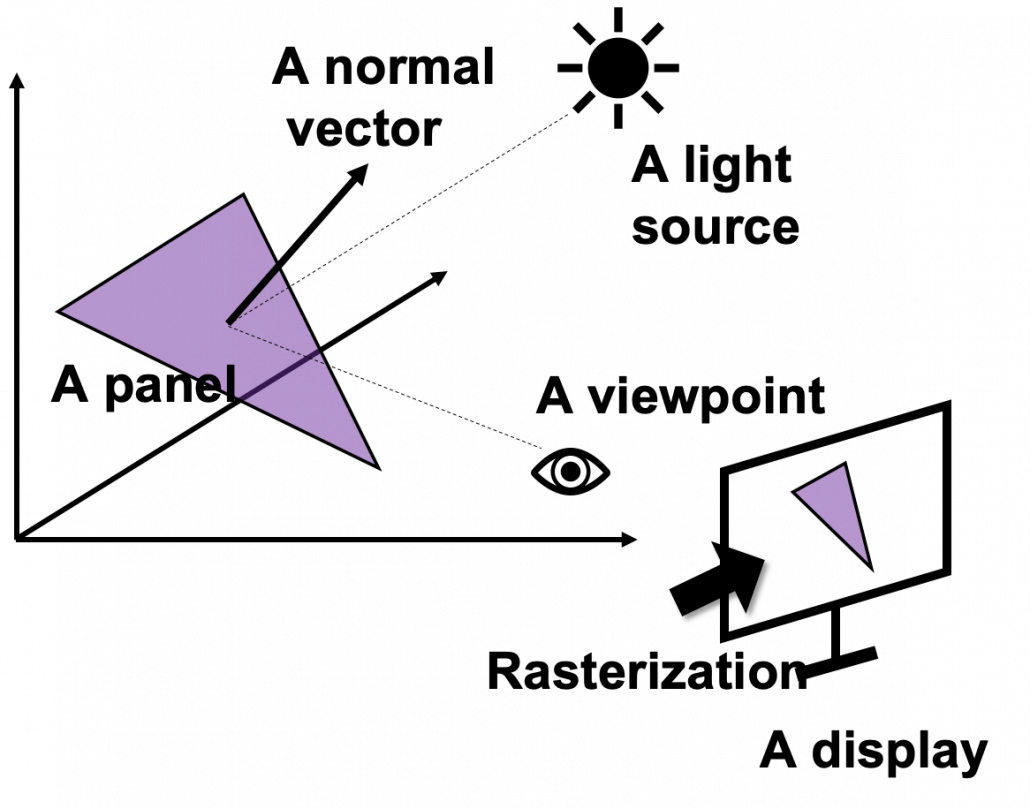
Computer graphics move or rotate in 3d spaces, and that is also linear transformations. When you think about a car moving in a city, it is convenient to place the car, buildings, and other objects on a fixed 3d space. But when you need to make computer graphics of scenes of the city from a view point inside the car, you put a moving origin point in the car and see the city. The spatial information of the city is calculated as vectors from the moving origin point. Of course this is also linear transformations. Of course I am not talking about a dot or simple figures moving in the 3d spaces. Computer graphics are composed of numerous plane panels, and each of them have at least three vertexes, and they move on 3d spaces. Depending on viewpoints, you need project the 3d graphics in 3d spaces on 2d spaces to display the graphics on devices. You need to calculate which part of the panel is projected to which pixel on the display, and that is called rasterization. Plus, in order to get photophotorealistic image, you need to think about how lights from light sources reflect on the panel and projected on the display. And you also have to put some textures on groups of panels. You might also need to change color spaces, which is also linear transformations.

My point is, in short, you really need to do numerous linear transformations in parallel in image processing.

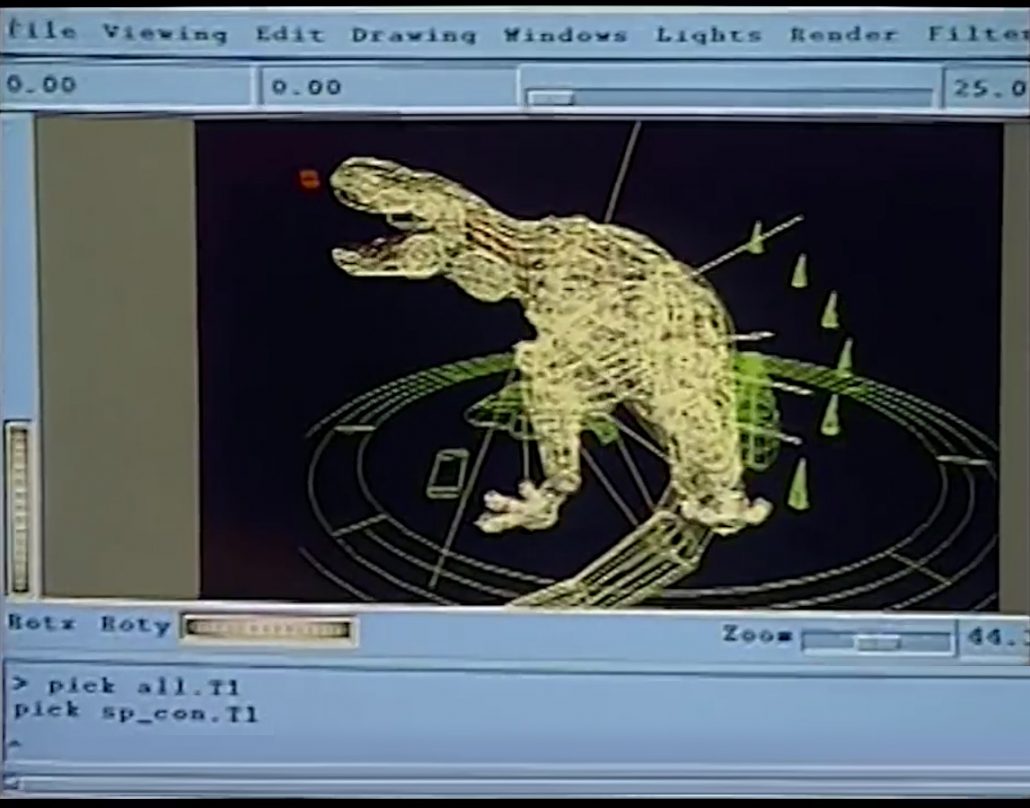
When it comes to the use of CGI in movies,  two pioneer movies were released during this time: Jurassic Park in 1993, and Toy Story in 1995. It is famous that Pixar used to be one of the departments in ILM(Industrial Light and Magic), founded by George Lucas, and Steve Jobs bought the department. Even though the members in Pixar had not even made a long feature film in their lives, after trial and errors, they made the first CGI animated feature movie. On the other hand, in order to acquire funds for the production of Schindler’s List(1993), Steven Spielberg took on Jurassic Park(1993), consequently changing the history of CGI through this “side job.”

Source: http://renderstory.com/jurassic-park-23-years-later/

*I think you have realized that George Lucas is mentioned almost everywhere in this article. His influences on technologies are not only limited to image processing, but also sound measuring system, nonlinear editing system. Photoshop was also originally developed under his company. I need another article series for this topic, but maybe not in Data Science Blog.

Source: https://editorial.rottentomatoes.com/article/5-technical-breakthroughs-in-star-wars-that-changed-movies-forever/

Considering that the first wire-frame computer graphics made and displayed by computers appeared in the scene of displaying the wire frame structure of Death Star in a war room, in Star Wars: A New Hope, the development of CGI was already astonishing at this time. But I think deep learning owe its development more to video game industry.

*I said that the Death Star scene is the first use of graphics made and DISPLAYED by computers, because I have to say one of the first graphics in movie MADE by computer dates back to the legendary title sequence of Vertigo(1958).

When it comes to 3D video games the processing unit has to constantly deal with real time commands from controllers. It is famous that GPU was originally specifically designed for plotting computer graphics. Video game market is the biggest in entertainment industry in general, and it is said that the quality of computer graphics have the strongest correlation with video games sales, therefore enhancing this quality is a priority for the video game console manufacturers.

One good example to see how much video games developed is comparing original Final Fantasy 7 and the remake one. The original one was released in 1997, the same year as when LSTM was invented. And recently  the remake version of Final Fantasy 7 was finally released this year. The original one was also made with very big budget, and it was divided into three CD-ROMs. The original one was also very revolutionary given that the former ones of Final Fantasy franchise were all 2d video retro style video games. But still the computer graphics looks like polygons, and in almost all scenes the camera angle was fixed in the original one. On the other hand the remake one is very photorealistic and you can move the angle of the camera as you want while you play the video game.

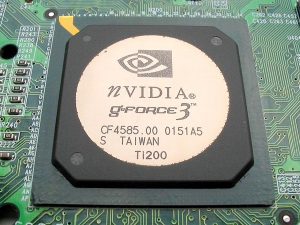
There were also fierce battles by graphic processor manufacturers in computer video game market in the 1990s, but personally I think the release of Xbox console was a turning point in the development of GPU. To be concrete, Microsoft adopted a type of NV20 GPU for Xbox consoles, and that left some room of programmability for developers. The chief architect of NV20, which was released under the brand of GeForce3, said making major changes in the company’s graphic chips was very risky. But that decision opened up possibilities of uses of GPU beyond computer graphics.

Source: https://de.wikipedia.org/wiki/Nvidia-GeForce-3-Serie

I think that the idea of a programmable GPU provided other scientific fields with more visible benefits after CUDA was launched. And GPU gained its position not only in deep learning, but also many other fields including making super computers.

*When it comes to deep learning, even GPUs have strong rivals. TPU(Tensor Processing Unit) made by Google, is specialized for deep learning tasks, and have astonishing processing speed. And FPGA(Field Programmable Gate Array), which was originally invented customizable electronic circuit, proved to be efficient for reducing electricity consumption of deep learning tasks.

*I am not so sure about this GPU part. Processing unit, including GPU is another big topic, that is beyond my capacity to be honest.  I would appreciate it if you could share your view and some references to confirm your opinion, on the comment section or via email.

*If you are interested you should see this video of game fans’ reactions to the announcement of Final Fantasy 7. This is the industry which grew behind the development of deep learning, and many fields where you need parallel computations owe themselves to the nerds who spent a lot of money for video games, including me.

*But ironically the engineers who invented the GPU said they did not play video games simply because they were busy. If you try to study the technologies behind video games, you would not have much time playing them. That is the reality.

We have seen that the in this second AI winter, Internet and GPU laid foundation of the next AI boom. But still the last piece of the puzzle is missing: let’s look at the breakthrough which solved the vanishing /exploding gradient problem of deep learning in the next section.

4, Pretraining of deep belief networks: “The Dawn of Deep Learning”

Some researchers say the invention of pretraining of deep belief network by Geoffrey Hinton was a breakthrough which put an end to the last AI winter. Deep belief networks are different type of networks from the neural networks we have discussed, but their architectures are similar to those of the neural networks. And it was also unknown how to train deep belief nets when they have several layers. Hinton discovered that training the networks layer by layer in advance can tackle vanishing gradient problems. And later it was discovered that you can do pretraining neural networks layer by layer with autoencoders.

*Deep belief network is beyond the scope of this article series. I have to talk about generative models, Boltzmann machine, and some other topics.

The pretraining techniques of neural networks is not mainstream anymore. But I think it is very meaningful to know that major deep learning techniques such as using ReLU activation functions, optimization with Adam, dropout, batch normalization, came up as more effective algorithms for deep learning after the advent of the pretraining techniques, and now we are in the third AI boom.

In the next next article we are finally going to work on LSTM. Specifically, I am going to offer a clearer guide to a well-made paper on LSTM, named “LSTM: A Search Space Odyssey.”

* I make study materials on machine learning, sponsored by DATANOMIQ. I do my best to make my content as straightforward but as precise as possible. I include all of my reference sources. If you notice any mistakes in my materials, including grammatical errors, please let me know (email: yasuto.tamura@datanomiq.de). And if you have any advice for making my materials more understandable to learners, I would appreciate hearing it.

[References]

[1] Taniguchi Tadahiro, “An Illustrated Guide to Artificial Intelligence”, (2010), Kodansha pp. 3-11
谷口忠大 著, 「イラストで学ぶ人工知能概論」, (2010), 講談社, pp. 3-11

[2] Francois Chollet, Deep Learning with Python,(2018), Manning , pp. 14-24

[3] Oketani Takayuki, “Machine Learning Professional Series: Deep Learning,” (2015), pp. 1-5, 151-156
岡谷貴之 著, 「機械学習プロフェッショナルシリーズ 深層学習」, (2015), pp. 1-5, 151-156

[4] Abigail See, Matthew Lamm, “Natural Language Processingwith Deep LearningCS224N/Ling284 Lecture 8:Machine Translation,Sequence-to-sequence and Attention,” (2020),
URL: http://web.stanford.edu/class/cs224n/slides/cs224n-2020-lecture08-nmt.pdf

[5]C. M. Bishop, “Pattern Recognition and Machine Learning,” (2006), Springer, pp. 192-196

[6] Daniel C. Dennett, “Cognitive Wheels: the Frame Problem of AI,” (1984), pp. 1-2

[7] Machiyama Tomohiro, “Understanding Cinemas of 1967-1979,” (2014), Yosensya, pp. 14-30
町山智浩 著, 「<映画の見方>が分かる本」,(2014), 洋泉社, pp. 14-30

[8] Harada Tatsuya, “Machine Learning Professional Series: Image Recognition,” (2017), pp. 156-157
原田達也 著, 「機械学習プロフェッショナルシリーズ 画像認識」, (2017), pp. 156-157

[9] Suyama Atsushi, “Machine Learning Professional Series: Bayesian Deep Learning,” (2019)岡谷貴之 須山敦志 著, 「機械学習プロフェッショナルシリーズ ベイズ深層学習」, (2019)

[10] “Understandable LSTM ~ With the Current Trends,” Qiita, (2015)
「わかるLSTM ~ 最近の動向と共に」, Qiita, (2015)
URL: https://qiita.com/t_Signull/items/21b82be280b46f467d1b
[11] Hisa Ando, “WEB+DB PRESS plus series: Technologies Supporting Processors – The World Endlessly Pursuing Speed,” (2017), Gijutsu-hyoron-sya, pp 313-317
Hisa Ando, 「WEB+DB PRESS plusシリーズ プロセッサを支える技術― 果てしなくスピードを追求する世界」, (2017), 技術評論社, pp. 313-317

[12] “Takahashi Yoshiki and Utamaru discuss George Lucas,” miyearnZZ Labo, (2016)
“高橋ヨシキと宇多丸 ジョージ・ルーカスを語る,” miyearnZZ Labo, (2016)
URL: https://miyearnzzlabo.com/archives/38865

[13] Katherine Bourzac, “Chip Hall of Fame: Nvidia NV20 The first configurable graphics processor opened the door to a machine-learning revolution,” IEEE SPECTRUM, (2018)
URL: https://spectrum.ieee.org/tech-history/silicon-revolution/chip-hall-of-fame-nvidia-nv20

Sechs Eigenschaften einer modernen Business Intelligence

Völlig unabhängig von der Branche, in der Sie tätig sind, benötigen Sie Informationssysteme, die Ihre geschäftlichen Daten auswerten, um Ihnen Entscheidungsgrundlagen zu liefern. Diese Systeme werden gemeinläufig als sogenannte Business Intelligence (BI) bezeichnet. Tatsächlich leiden die meisten BI-Systeme an Mängeln, die abstellbar sind. Darüber hinaus kann moderne BI Entscheidungen teilweise automatisieren und umfassende Analysen bei hoher Flexibilität in der Nutzung ermöglichen.


english-flagRead this article in English:
“Six properties of modern Business Intelligence”


Lassen Sie uns die sechs Eigenschaften besprechen, die moderne Business Intelligence auszeichnet, die Berücksichtigungen von technischen Kniffen im Detail bedeuten, jedoch immer im Kontext einer großen Vision für die eigene Unternehmen-BI stehen:

1.      Einheitliche Datenbasis von hoher Qualität (Single Source of Truth)

Sicherlich kennt jeder Geschäftsführer die Situation, dass sich seine Manager nicht einig sind, wie viele Kosten und Umsätze tatsächlich im Detail entstehen und wie die Margen pro Kategorie genau aussehen. Und wenn doch, stehen diese Information oft erst Monate zu spät zur Verfügung.

In jedem Unternehmen sind täglich hunderte oder gar tausende Entscheidungen auf operative Ebene zu treffen, die bei guter Informationslage in der Masse sehr viel fundierter getroffen werden können und somit Umsätze steigern und Kosten sparen. Demgegenüber stehen jedoch viele Quellsysteme aus der unternehmensinternen IT-Systemlandschaft sowie weitere externe Datenquellen. Die Informationsbeschaffung und -konsolidierung nimmt oft ganze Mitarbeitergruppen in Anspruch und bietet viel Raum für menschliche Fehler.

Ein System, das zumindest die relevantesten Daten zur Geschäftssteuerung zur richtigen Zeit in guter Qualität in einer Trusted Data Zone als Single Source of Truth (SPOT) zur Verfügung stellt. SPOT ist das Kernstück moderner Business Intelligence.

Darüber hinaus dürfen auch weitere Daten über die BI verfügbar gemacht werden, die z. B. für qualifizierte Analysen und Data Scientists nützlich sein können. Die besonders vertrauenswürdige Zone ist jedoch für alle Entscheider diejenige, über die sich alle Entscheider unternehmensweit synchronisieren können.

2.      Flexible Nutzung durch unterschiedliche Stakeholder

Auch wenn alle Mitarbeiter unternehmensweit auf zentrale, vertrauenswürdige Daten zugreifen können sollen, schließt das bei einer cleveren Architektur nicht aus, dass sowohl jede Abteilung ihre eigenen Sichten auf diese Daten erhält, als auch, dass sogar jeder einzelne, hierfür qualifizierte Mitarbeiter seine eigene Sicht auf Daten erhalten und sich diese sogar selbst erstellen kann.

Viele BI-Systeme scheitern an der unternehmensweiten Akzeptanz, da bestimmte Abteilungen oder fachlich-definierte Mitarbeitergruppen aus der BI weitgehend ausgeschlossen werden.

Moderne BI-Systeme ermöglichen Sichten und die dafür notwendige Datenintegration für alle Stakeholder im Unternehmen, die auf Informationen angewiesen sind und profitieren gleichermaßen von dem SPOT-Ansatz.

3.      Effiziente Möglichkeiten zur Erweiterung (Time to Market)

Bei den Kernbenutzern eines BI-Systems stellt sich die Unzufriedenheit vor allem dann ein, wenn der Ausbau oder auch die teilweise Neugestaltung des Informationssystems einen langen Atem voraussetzt. Historisch gewachsene, falsch ausgelegte und nicht besonders wandlungsfähige BI-Systeme beschäftigen nicht selten eine ganze Mannschaft an IT-Mitarbeitern und Tickets mit Anfragen zu Änderungswünschen.

Gute BI versteht sich als Service für die Stakeholder mit kurzer Time to Market. Die richtige Ausgestaltung, Auswahl von Software und der Implementierung von Datenflüssen/-modellen sorgt für wesentlich kürzere Entwicklungs- und Implementierungszeiten für Verbesserungen und neue Features.

Des Weiteren ist nicht nur die Technik, sondern auch die Wahl der Organisationsform entscheidend, inklusive der Ausgestaltung der Rollen und Verantwortlichkeiten – von der technischen Systemanbindung über die Datenbereitstellung und -aufbereitung bis zur Analyse und dem Support für die Endbenutzer.

4.      Integrierte Fähigkeiten für Data Science und AI

Business Intelligence und Data Science werden oftmals als getrennt voneinander betrachtet und geführt. Zum einen, weil Data Scientists vielfach nur ungern mit – aus ihrer Sicht – langweiligen Datenmodellen und vorbereiteten Daten arbeiten möchten. Und zum anderen, weil die BI in der Regel bereits als traditionelles System im Unternehmen etabliert ist, trotz der vielen Kinderkrankheiten, die BI noch heute hat.

Data Science, häufig auch als Advanced Analytics bezeichnet, befasst sich mit dem tiefen Eintauchen in Daten über explorative Statistik und Methoden des Data Mining (unüberwachtes maschinelles Lernen) sowie mit Predictive Analytics (überwachtes maschinelles Lernen). Deep Learning ist ein Teilbereich des maschinellen Lernens (Machine Learning) und wird ebenfalls für Data Mining oder Predictvie Analytics angewendet. Bei Machine Learning handelt es sich um einen Teilbereich der Artificial Intelligence (AI).

In der Zukunft werden BI und Data Science bzw. AI weiter zusammenwachsen, denn spätestens nach der Inbetriebnahme fließen die Prädiktionsergebnisse und auch deren Modelle wieder in die Business Intelligence zurück. Vermutlich wird sich die BI zur ABI (Artificial Business Intelligence) weiterentwickeln. Jedoch schon heute setzen viele Unternehmen Data Mining und Predictive Analytics im Unternehmen ein und setzen dabei auf einheitliche oder unterschiedliche Plattformen mit oder ohne Integration zur BI.

Moderne BI-Systeme bieten dabei auch Data Scientists eine Plattform, um auf qualitativ hochwertige sowie auf granularere Rohdaten zugreifen zu können.

5.      Ausreichend hohe Performance

Vermutlich werden die meisten Leser dieser sechs Punkte schon einmal Erfahrung mit langsamer BI gemacht haben. So dauert das Laden eines täglich zu nutzenden Reports in vielen klassischen BI-Systemen mehrere Minuten. Wenn sich das Laden eines Dashboards mit einer kleinen Kaffee-Pause kombinieren lässt, mag das hin und wieder für bestimmte Berichte noch hinnehmbar sein. Spätestens jedoch bei der häufigen Nutzung sind lange Ladezeiten und unzuverlässige Reports nicht mehr hinnehmbar.

Ein Grund für mangelhafte Performance ist die Hardware, die sich unter Einsatz von Cloud-Systemen bereits beinahe linear skalierbar an höhere Datenmengen und mehr Analysekomplexität anpassen lässt. Der Einsatz von Cloud ermöglicht auch die modulartige Trennung von Speicher und Rechenleistung von den Daten und Applikationen und ist damit grundsätzlich zu empfehlen, jedoch nicht für alle Unternehmen unbedingt die richtige Wahl und muss zur Unternehmensphilosophie passen.

Tatsächlich ist die Performance nicht nur von der Hardware abhängig, auch die richtige Auswahl an Software und die richtige Wahl der Gestaltung von Datenmodellen und Datenflüssen spielt eine noch viel entscheidender Rolle. Denn während sich Hardware relativ einfach wechseln oder aufrüsten lässt, ist ein Wechsel der Architektur mit sehr viel mehr Aufwand und BI-Kompetenz verbunden. Dabei zwingen unpassende Datenmodelle oder Datenflüsse ganz sicher auch die neueste Hardware in maximaler Konfiguration in die Knie.

6.      Kosteneffizienter Einsatz und Fazit

Professionelle Cloud-Systeme, die für BI-Systeme eingesetzt werden können, bieten Gesamtkostenrechner an, beispielsweise Microsoft Azure, Amazon Web Services und Google Cloud. Mit diesen Rechnern – unter Einweisung eines erfahrenen BI-Experten – können nicht nur Kosten für die Nutzung von Hardware abgeschätzt, sondern auch Ideen zur Kostenoptimierung kalkuliert werden. Dennoch ist die Cloud immer noch nicht für jedes Unternehmen die richtige Lösung und klassische Kalkulationen für On-Premise-Lösungen sind notwendig und zudem besser planbar als Kosten für die Cloud.

Kosteneffizienz lässt sich übrigens auch mit einer guten Auswahl der passenden Software steigern. Denn proprietäre Lösungen sind an unterschiedliche Lizenzmodelle gebunden und können nur über Anwendungsszenarien miteinander verglichen werden. Davon abgesehen gibt es jedoch auch gute Open Source Lösungen, die weitgehend kostenfrei genutzt werden dürfen und für viele Anwendungsfälle ohne Abstriche einsetzbar sind.

Die Total Cost of Ownership (TCO) gehören zum BI-Management mit dazu und sollten stets im Fokus sein. Falsch wäre es jedoch, die Kosten einer BI nur nach der Kosten für Hardware und Software zu bewerten. Ein wesentlicher Teil der Kosteneffizienz ist komplementär mit den Aspekten für die Performance des BI-Systems, denn suboptimale Architekturen arbeiten verschwenderisch und benötigen mehr und teurere Hardware als sauber abgestimmte Architekturen. Die Herstellung der zentralen Datenbereitstellung in adäquater Qualität kann viele unnötige Prozesse der Datenaufbereitung ersparen und viele flexible Analysemöglichkeiten auch redundante Systeme direkt unnötig machen und somit zu Einsparungen führen.

In jedem Fall ist ein BI für Unternehmen mit vielen operativen Prozessen grundsätzlich immer günstiger als kein BI zu haben. Heutzutage könnte für ein Unternehmen nichts teurer sein, als nur nach Bauchgefühl gesteuert zu werden, denn der Markt tut es nicht und bietet sehr viel Transparenz.

Dennoch sind bestehende BI-Architekturen hin und wieder zu hinterfragen. Bei genauerem Hinsehen mit BI-Expertise ist die Kosteneffizienz und Datentransparenz häufig möglich.

Data Analytics and Mining for Dummies

Data Analytics and Mining is often perceived as an extremely tricky task cut out for Data Analysts and Data Scientists having a thorough knowledge encompassing several different domains such as mathematics, statistics, computer algorithms and programming. However, there are several tools available today that make it possible for novice programmers or people with no absolutely no algorithmic or programming expertise to carry out Data Analytics and Mining. One such tool which is very powerful and provides a graphical user interface and an assembly of nodes for ETL: Extraction, Transformation, Loading, for modeling, data analysis and visualization without, or with only slight programming is the KNIME Analytics Platform.

KNIME, or the Konstanz Information Miner, was developed by the University of Konstanz and is now popular with a large international community of developers. Initially KNIME was originally made for commercial use but now it is available as an open source software and has been used extensively in pharmaceutical research since 2006 and also a powerful data mining tool for the financial data sector. It is also frequently used in the Business Intelligence (BI) sector.

KNIME as a Data Mining Tool

KNIME is also one of the most well-organized tools which enables various methods of machine learning and data mining to be integrated. It is very effective when we are pre-processing data i.e. extracting, transforming, and loading data.

KNIME has a number of good features like quick deployment and scaling efficiency. It employs an assembly of nodes to pre-process data for analytics and visualization. It is also used for discovering patterns among large volumes of data and transforming data into more polished/actionable information.

Some Features of KNIME:

  • Free and open source
  • Graphical and logically designed
  • Very rich in analytics capabilities
  • No limitations on data size, memory usage, or functionalities
  • Compatible with Windows ,OS and Linux
  • Written in Java and edited with Eclipse.

A node is the smallest design unit in KNIME and each node serves a dedicated task. KNIME contains graphical, drag-drop nodes that require no coding. Nodes are connected with one’s output being another’s input, as a workflow. Therefore end-to-end pipelines can be built requiring no coding effort. This makes KNIME stand out, makes it user-friendly and make it accessible for dummies not from a computer science background.

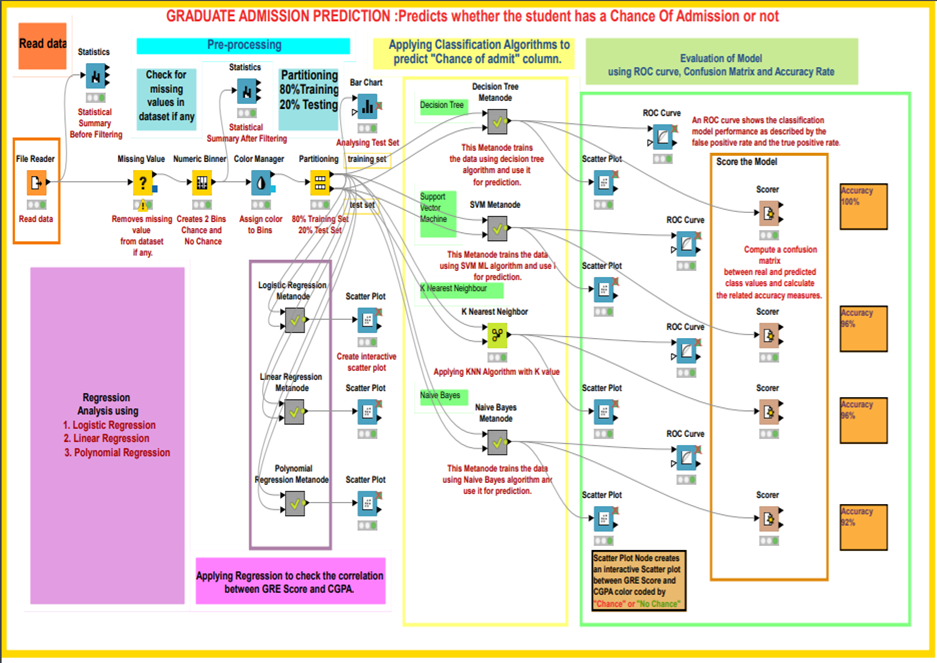
KNIME workflow designed for graduate admission prediction

KNIME workflow designed for graduate admission prediction

KNIME has nodes to carry out Univariate Statistics, Multivariate Statistics, Data Mining, Time Series Analysis, Image Processing, Web Analytics, Text Mining, Network Analysis and Social Media Analysis. The KNIME node repository has a node for every functionality you can possibly think of and need while building a data mining model. One can execute different algorithms such as clustering and classification on a dataset and visualize the results inside the framework itself. It is a framework capable of giving insights on data and the phenomenon that the data represent.

Some commonly used KNIME node groups include:

  • Input-Output or I/O:  Nodes in this group retrieve data from or to write data to external files or data bases.
  • Data Manipulation: Used for data pre-processing tasks. Contains nodes to filter, group, pivot, bin, normalize, aggregate, join, sample, partition, etc.
  • Views: This set of nodes permit users to inspect data and analysis results using multiple views. This gives a means for truly interactive exploration of a data set.
  • Data Mining: In this group, there are nodes that implement certain algorithms (like K-means clustering, Decision Trees, etc.)

Comparison with other tools 

The first version of the KNIME Analytics Platform was released in 2006 whereas Weka and R studio were released in 1997 and 1993 respectively. KNIME is a proper data mining tool whereas Weka and R studio are Machine Learning tools which can also do data mining. KNIME integrates with Weka to add machine learning algorithms to the system. The R project adds statistical functionalities as well. Furthermore, KNIME’s range of functions is impressive, with more than 1,000 modules and ready-made application packages. The modules can be further expanded by additional commercial features.

Process Mining Tools – Artikelserie

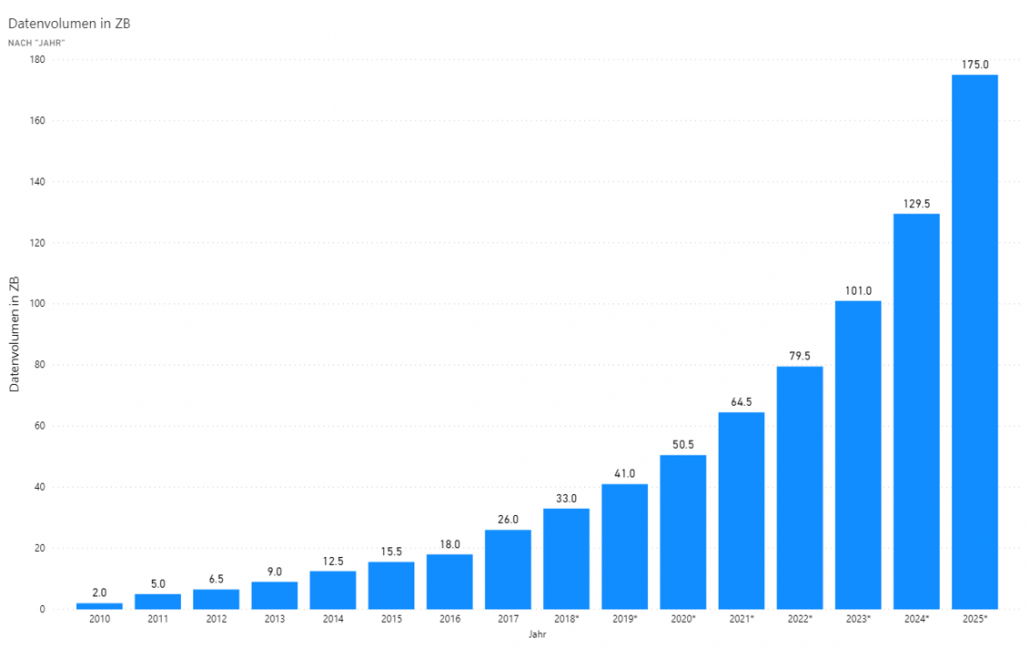
Process Mining ist nicht länger nur ein Buzzword, sondern ein relevanter Teil der Business Intelligence. Process Mining umfasst die Analyse von Prozessen und lässt sich auf alle Branchen und Fachbereiche anwenden, die operative Prozesse haben, die wiederum über operative IT-Systeme erfasst werden. Um die zunehmende Bedeutung dieser Data-Disziplin zu verstehen, reicht ein Blick auf die Entwicklung der weltweiten Datengenerierung an. Waren es 2010 noch 2 Zettabytes (ZB), sind laut Statista für das Jahr 2020 mehr als 50 ZB an Daten zu erwarten. Für 2025 wird gar mit einem Bestand von 175 ZB gerechnet.

Hier wird das Datenvolumen nach Jahren angezeit

Abbildung 1 zeigt die Entwicklung des weltweiten Datenvolumen (Stand 2018). Quelle: https://www.statista.com/statistics/871513/worldwide-data-created/

Warum jetzt eigentlich Process Mining?

Warum aber profitiert insbesondere Process Mining von dieser Entwicklung? Der Grund liegt in der Unordnung dieser Datenmenge. Die Herausforderung der sich viele Unternehmen gegenübersehen, liegt eben genau in der Analyse dieser unstrukturierten Daten. Hinzu kommt, dass nahezu jeder Prozess Datenspuren in Informationssystemen hinterlässt. Die Betrachtung von Prozessen auf Datenebene birgt somit ein enormes Potential, welches in Anbetracht der Entwicklung zunehmend an Bedeutung gewinnt.

Was war nochmal Process Mining?

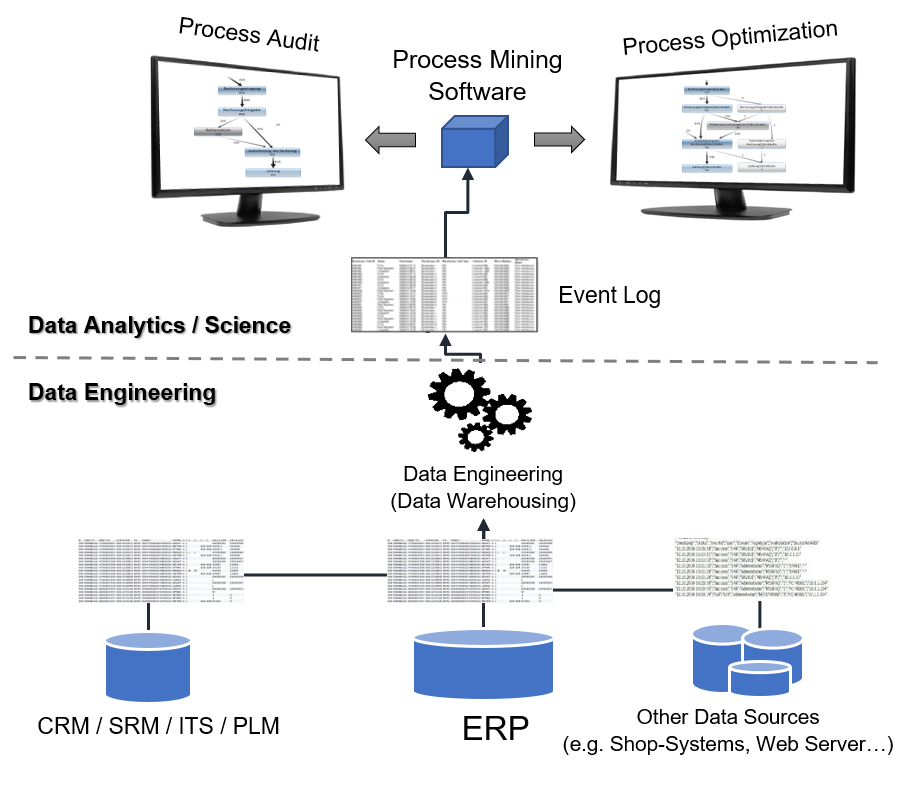
Process Mining ist eine Analysemethodik, welche dazu befähigt, aus den abgespeicherten Datenspuren der Informationssysteme eine Rekonstruktion der realen Prozesse zu schaffen. Diese Prozesse können anschließend als Prozessflussdiagramm dargestellt und ausgewertet werden. Die klassischen Anwendungsfälle reichen von dem Aufspüren (Discovery) unbekannter Prozesse, über einen Soll-Ist-Vergleich (Conformance) bis hin zur Anpassung/Verbesserung (Enhancement) bestehender Prozesse. Mittlerweile setzen viele Firmen darüber hinaus auf eine Integration von RPA und Data Science im Process Mining. Und die Analyse-Tiefe wird zunehmen und bis zur Analyse einzelner Klicks reichen, was gegenwärtig als sogenanntes „Task Mining“ bezeichnet wird.

Hier wird ein typischer Process Mining Workflow dargestellt

Abbildung 2 zeigt den typischen Workflow eines Process Mining Projektes. Oftmals dient das ERP-System als zentrale Datenquelle. Die herausgearbeiteten Event-Logs werden anschließend mittels Process Mining Tool visualisiert.

In jedem Fall liegt meistens das Gros der Arbeit auf die Bereitstellung und Vorbereitung der Daten und der Transformation dieser in sogenannte „Event-Logs“, die den Input für die Process Mining Tools darstellen. Deshalb arbeiten viele Anbieter von Process Mining Tools schon länger an Lösungen, um die mit der Datenvorbereitung verbundenen zeit -und arbeitsaufwendigen Schritte zu erleichtern. Während fast alle Tool-Anbieter vorgefertigte Protokolle für Standardprozesse anbieten, gehen manche noch weiter und bieten vollumfängliche Plattform Lösungen an, welche eine effiziente Integration der aufwendigen ETL-Prozesse versprechen. Der Funktionsumfang der Process Mining Tools geht daher mittlerweile deutlich über eine reine Darstellungsfunktion hinaus und deckt ggf. neue Trends sowie optimierte Einsteigerbarrieren mit ab.

Motivation dieser Artikelserie

Die Motivation diesen Artikel zu schreiben liegt nicht in der Erläuterung der Methode des Process Mining. Hierzu gibt es mittlerweile zahlreiche Informationsquellen. Eine besonders empfehlenswerte ist das Buch „Process Mining“ von Will van der Aalst, einem der Urväter des Process Mining. Die Motivation dieses Artikels liegt viel mehr in der Betrachtung der zahlreichen Process Mining Tools am Markt. Sehr oft erlebe ich als Data-Consultant, dass Process Mining Projekte im Vorfeld von der Frage nach dem „besten“ Tool dominiert werden. Diese Fragestellung ist in Ihrer Natur sicherlich immer individuell zu beantworten. Da individuelle Projekte auch einen individuellen Tool-Einsatz bedingen, beschäftige ich mich meist mit einem großen Spektrum von Process Mining Tools. Daher ist es mir in dieser Artikelserie ein Anliegen einen allgemeingültigen Überblick zu den üblichen Process Mining Tools zu erarbeiten. Dabei möchte ich mich nicht auf persönliche Erfahrungen stützen, sondern die Tools anhand von Testdaten einem praktischen Vergleich unterziehen, der für den Leser nachvollziehbar ist.

Um den Umfang der Artikelserie zu begrenzen, werden die verschiedenen Tools nur in Ihren Kernfunktionen angewendet und verglichen. Herausragende Funktionen oder Eigenschaften der jeweiligen Tools werden jedoch angemerkt und ggf. in anderen Artikeln vertieft. Das Ziel dieser Artikelserie soll sein, dem Leser einen ersten Einblick über die am Markt erhältlichen Tools zu geben. Daher spricht dieser Artikel insbesondere Einsteiger aber auch Fortgeschrittene im Process Mining an, welche einen Überblick über die Tools zu schätzen wissen und möglicherweise auch mal über den Tellerand hinweg schauen mögen.

Die Tools

Die Gruppe der zu betrachteten Tools besteht aus den folgenden namenhaften Anwendungen:

Die Auswahl der Tools orientiert sich an den „Market Guide for Process Mining 2019“ von Gartner. Aussortiert habe ich jene Tools, mit welchen ich bisher wenig bis gar keine Berührung hatte. Diese Auswahl an Tools verspricht meiner Meinung nach einen spannenden Einblick von verschiedene Process Mining Tools am Markt zu bekommen.

Die Anwendung in der Praxis

Um die Tools realistisch miteinander vergleichen zu können, werden alle Tools die gleichen Datengrundlage benutzen. Die Datenbasis wird folglich über die gesamte Artikelserie hinweg für die Darstellungen mit den Tools genutzt. Ich werde im nächsten Artikel explizit diese Datenbasis kurz erläutern.

Das Ziel der praktischen Untersuchung soll sein, die Beispieldaten in die verschiedenen Tools zu laden, um den enthaltenen Prozess zu visualisieren. Dabei möchte ich insbesondere darauf achten wie bedienbar und anpassungsfähig/flexibel die Tools mir erscheinen. An dieser Stelle möchte ich eindeutig darauf hinweisen, dass dieser Vergleich und seine Bewertung meine Meinung ist und keineswegs Anspruch auf Vollständigkeit beansprucht. Da der Markt in Bewegung ist, behalte ich mir ferner vor, diese Artikelserie regelmäßig anzupassen.

Die Kriterien

Neben der Bedienbarkeit und der Anpassungsfähigkeit der Tools möchte ich folgende zusätzliche Gesichtspunkte betrachten:

  • Bedienbarkeit: Wie leicht gehen die Analysen von der Hand? Wie einfach ist der Einstieg?
  • Anpassungsfähigkeit: Wie flexibel reagiert das Tool auf meine Daten und Analyse-Wünsche?
  • Integrationsfähigkeit: Welche Schnittstellen bringt das Tool mit? Läuft es auch oder nur in der Cloud?
  • Skalierbarkeit: Ist das Tool dazu in der Lage, auch große und heterogene Daten zu verarbeiten?
  • Zukunftsfähigkeit: Wie steht es um Machine Learning, ETL-Modeller oder Task Mining?
  • Preisgestaltung: Nach welchem Modell bestimmt sich der Preis?

Die Datengrundlage

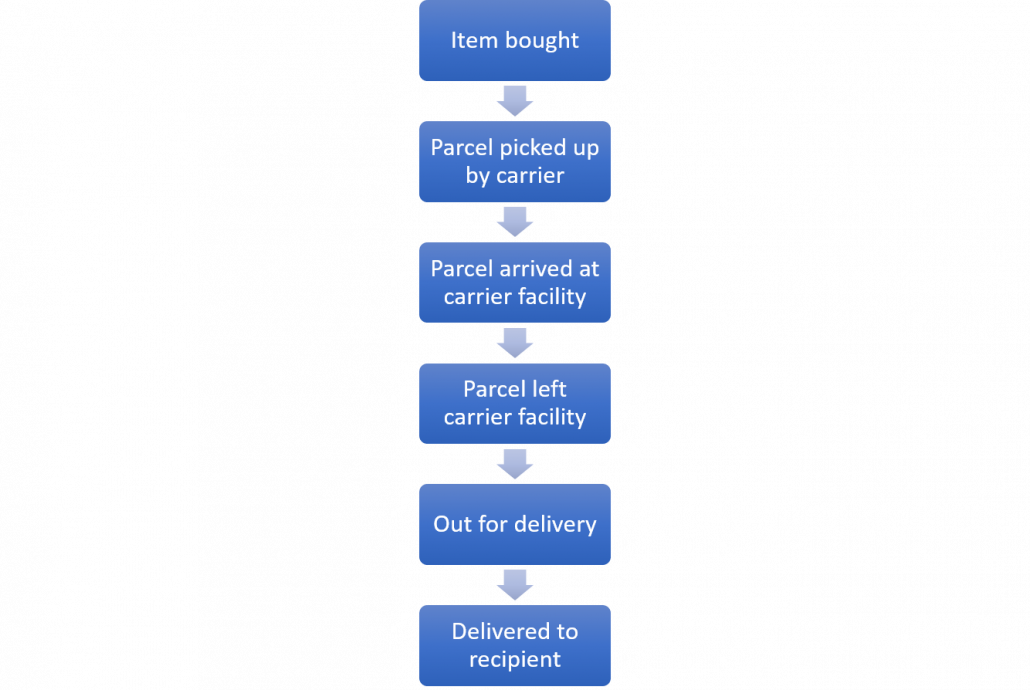
Die Datenbasis bildet ein Demo-Datensatz der von Celonis für die gesamte Artikelserie netter Weise zur Verfügung gestellt wurde. Dieser Datensatz bildet einen Versand Prozess vom Zeitpunkt des Kaufes bis zur Auslieferung an den Kunden ab. In der folgenden Abbildung ist der Soll Prozess abgebildet.

Hier wird die Variante 1 der Demo Daten von Celonis als Grafik dargestellt

Abbildung 4 zeigt den gewünschten Versand Prozess der Datengrundlage von dem Kauf des Produktes bis zur Auslieferung.

Die Datengrundlage besteht aus einem 60 GB großen Event-Log, welcher lokal in einer Microsoft SQL Datenbank vorgehalten wird. Da diese Tabelle über 600 Mio. Events beinhaltet, wird die Datengrundlage für die Analyse der einzelnen Tools auf einen Ausschnitt von 60 Mio. Events begrenzt. Um die Performance der einzelnen Tools zu testen, wird jedoch auf die gesamte Datengrundlage zurückgegriffen. Der Ausschnitt der Event-Log Tabelle enthält 919 verschiedene Varianten und weisst somit eine ausreichende Komplexität auf, welche es mit den verschiednene Tools zu analysieren gilt.

Folgender Veröffentlichungsplan gilt für diese Artikelserie und wird mit jeder Veröffentlichung verlinkt:

  1. Celonis (erscheint demnächst)
  2. PAFnow (erscheint demnächst)
  3. MEHRWERK (erscheint demnächst)
  4. Lana Labs (erscheint demnächst)
  5. Signavio (erscheint demnächst)
  6. Process Gold (erscheint demnächst)
  7. Fluxicon Disco (erscheint demnächst)
  8. Aris Process Mining der Software AG (erscheint demnächst)

Six properties of modern Business Intelligence

Regardless of the industry in which you operate, you need information systems that evaluate your business data in order to provide you with a basis for decision-making. These systems are commonly referred to as so-called business intelligence (BI). In fact, most BI systems suffer from deficiencies that can be eliminated. In addition, modern BI can partially automate decisions and enable comprehensive analyzes with a high degree of flexibility in use.


Read this article in German:
“Sechs Eigenschaften einer modernen Business Intelligence“


Let us discuss the six characteristics that distinguish modern business intelligence, which mean taking technical tricks into account in detail, but always in the context of a great vision for your own company BI:

1. Uniform database of high quality

Every managing director certainly knows the situation that his managers do not agree on how many costs and revenues actually arise in detail and what the margins per category look like. And if they do, this information is often only available months too late.

Every company has to make hundreds or even thousands of decisions at the operational level every day, which can be made much more well-founded if there is good information and thus increase sales and save costs. However, there are many source systems from the company’s internal IT system landscape as well as other external data sources. The gathering and consolidation of information often takes up entire groups of employees and offers plenty of room for human error.

A system that provides at least the most relevant data for business management at the right time and in good quality in a trusted data zone as a single source of truth (SPOT). SPOT is the core of modern business intelligence.

In addition, other data on BI may also be made available which can be useful for qualified analysts and data scientists. For all decision-makers, the particularly trustworthy zone is the one through which all decision-makers across the company can synchronize.

2. Flexible use by different stakeholders

Even if all employees across the company should be able to access central, trustworthy data, with a clever architecture this does not exclude that each department receives its own views of this data. Many BI systems fail due to company-wide inacceptance because certain departments or technically defined employee groups are largely excluded from BI.

Modern BI systems enable views and the necessary data integration for all stakeholders in the company who rely on information and benefit equally from the SPOT approach.

3. Efficient ways to expand (time to market)

The core users of a BI system are particularly dissatisfied when the expansion or partial redesign of the information system requires too much of patience. Historically grown, incorrectly designed and not particularly adaptable BI systems often employ a whole team of IT staff and tickets with requests for change requests.

Good BI is a service for stakeholders with a short time to market. The correct design, selection of software and the implementation of data flows / models ensures significantly shorter development and implementation times for improvements and new features.

Furthermore, it is not only the technology that is decisive, but also the choice of organizational form, including the design of roles and responsibilities – from the technical system connection to data preparation, pre-analysis and support for the end users.

4. Integrated skills for Data Science and AI

Business intelligence and data science are often viewed and managed separately from each other. Firstly, because data scientists are often unmotivated to work with – from their point of view – boring data models and prepared data. On the other hand, because BI is usually already established as a traditional system in the company, despite the many problems that BI still has today.

Data science, often referred to as advanced analytics, deals with deep immersion in data using exploratory statistics and methods of data mining (unsupervised machine learning) as well as predictive analytics (supervised machine learning). Deep learning is a sub-area of ​​machine learning and is used for data mining or predictive analytics. Machine learning is a sub-area of ​​artificial intelligence (AI).

In the future, BI and data science or AI will continue to grow together, because at the latest after going live, the prediction models flow back into business intelligence. BI will probably develop into ABI (Artificial Business Intelligence). However, many companies are already using data mining and predictive analytics in the company, using uniform or different platforms with or without BI integration.

Modern BI systems also offer data scientists a platform to access high-quality and more granular raw data.

5. Sufficiently high performance

Most readers of these six points will probably have had experience with slow BI before. It takes several minutes to load a daily report to be used in many classic BI systems. If loading a dashboard can be combined with a little coffee break, it may still be acceptable for certain reports from time to time. At the latest, however, with frequent use, long loading times and unreliable reports are no longer acceptable.

One reason for poor performance is the hardware, which can be almost linearly scaled to higher data volumes and more analysis complexity using cloud systems. The use of cloud also enables the modular separation of storage and computing power from data and applications and is therefore generally recommended, but not necessarily the right choice for all companies.

In fact, performance is not only dependent on the hardware, the right choice of software and the right choice of design for data models and data flows also play a crucial role. Because while hardware can be changed or upgraded relatively easily, changing the architecture is associated with much more effort and BI competence. Unsuitable data models or data flows will certainly bring the latest hardware to its knees in its maximum configuration.

6. Cost-effective use and conclusion

Professional cloud systems that can be used for BI systems offer total cost calculators, such as Microsoft Azure, Amazon Web Services and Google Cloud. With these computers – with instruction from an experienced BI expert – not only can costs for the use of hardware be estimated, but ideas for cost optimization can also be calculated. Nevertheless, the cloud is still not the right solution for every company and classic calculations for on-premise solutions are necessary.

Incidentally, cost efficiency can also be increased with a good selection of the right software. Because proprietary solutions are tied to different license models and can only be compared using application scenarios. Apart from that, there are also good open source solutions that can be used largely free of charge and can be used for many applications without compromises.

However, it is wrong to assess the cost of a BI only according to its hardware and software costs. A significant part of cost efficiency is complementary to the aspects for the performance of the BI system, because suboptimal architectures work wastefully and require more expensive hardware than neatly coordinated architectures. The production of the central data supply in adequate quality can save many unnecessary processes of data preparation and many flexible analysis options also make redundant systems unnecessary and lead to indirect savings.

In any case, a BI for companies with many operational processes is always cheaper than no BI. However, if you take a closer look with BI expertise, cost efficiency is often possible.

Interview – Predictive Maintenance and how it can unleash cost savings

Interview with Dr. Kai Goebel, Principal Scientist at PARC, a Xerox Company, about Predictive Maintenance and how it can unleash cost savings.

Dr. Kai Goebel is principal scientist as PARC with more than two decades experience in corporate and government research organizations. He is responsible for leading applied research on state awareness, prognostics and decision-making using data analytics, AI, hybrid methods and physics-base methods. He has also fielded numerous applications for Predictive Maintenance at General Electric, NASA, and PARC for uses as diverse as rocket launchpads, jet engines, and chemical plants.

Data Science Blog: Mr. Goebel, predictive maintenance is not just a hype since industrial companies are already trying to establish this use case of predictive analytics. What benefits do they really expect from it?

Predictive Maintenance is a good example for how value can be realized from analytics. The result of the analytics drives decisions about when to schedule maintenance in advance of an event that might cause unexpected shutdown of the process line. This is in contrast to an uninformed process where the decision is mostly reactive, that is, maintenance is scheduled because equipment has already failed. It is also in contrast to a time-based maintenance schedule. The benefits of Predictive Maintenance are immediately clear: one can avoid unexpected downtime, which can lead to substantial production loss. One can manage inventory better since lead times for equipment replacement can be managed well. One can also manage safety better since equipment health is understood and safety averse situations can potentially be avoided. Finally, maintenance operations will be inherently more efficient as they shift significant time from inspection to mitigation of.

Data Science Blog: What are the most critical success factors for implementing predictive maintenance?

Critical for success is to get the trust of the operator. To that end, it is imperative to understand the limitations of the analytics approach and to not make false performance promises. Often, success factors for implementation hinge on understanding the underlying process and the fault modes reasonably well. It is important to be able to recognize the difference between operational changes and abnormal conditions. It is equally important to recognize rare events reliably while keeping false positives in check.

Data Science Blog: What kind of algorithm does predictive maintenance work with? Do you differentiate between approaches based on classical machine learning and those based on deep learning?

Well, there is no one kind of algorithm that works for Predictive Mantenance everywhere. Instead, one should look at the plurality of all algorithms as tools in a toolbox. Then analyze the problem – how many examples for run-to-failure trajectories are there; what is the desired lead time to report on a problem; what is the acceptable false positive/false negative rate; what are the different fault modes; etc – and use the right kind of tool to do the job. Just because a particular approach (like the one you mentioned in your question) is all the hype right now does not mean it is the right tool for the problem. Sometimes, approaches from what you call “classical machine learning” actually work better. In fact, one should consider approaches even outside the machine learning domain, either as stand-alone approach as in a hybrid configuration. One may also have to invent new methods, for example to perform online learning of the dynamic changes that a system undergoes through its (long) life. In the end, a customer does not care about what approach one is using, only if it solves the problem.

Data Science Blog: There are several providers for predictive analytics software. Is it all about software tools? What makes the difference for having success?

Frequently, industrial partners lament that they have to spend a lot of effort in teaching a new software provider about the underlying industrial processes as well as the equipment and their fault modes. Others are tired of false promises that any kind of data (as long as you have massive amounts of it) can produce any kind of performance. If one does not physically sense a certain modality, no algorithmic magic can take place. In other words, it is not just all about the software. The difference for having success is understanding that there is no cookie cutter approach. And that realization means that one may have to role up the sleeves and to install new instrumentation.

Data Science Blog: What are coming trends? What do you think will be the main topic 2020 and 2021?

Predictive Maintenance is slowly evolving towards Prescriptive Maintenance. Here, one does not only seek to inform about an impending problem, but also what to do about it. Such an approach needs to integrate with the logistics element of an organization to find an optimal decision that trades off several objectives with regards to equipment uptime, process quality, repair shop loading, procurement lead time, maintainer availability, safety constraints, contractual obligations, etc.

Daten als Frühwarnsystem einsetzen

In der klassischen Business Intelligence haben Unternehmen jahrelang Daten in Data Warehouses gesammelt und analysiert, um aus der Vergangenheit Lehren für die Zukunft zu ziehen. Zu seiner Zeit war das eine Revolution, aber da es sich dabei vor allem um Daten aus Transaktionssystemen handelte, war der Nutzen begrenzt. Erst mit der Verbreitung des IoT und von Sensoren, die permanent Daten liefern, konnten auch Gründe für Fehler oder Maschinenausfälle ausgelesen werden. Und wenn diese Gründe bestimmten Mustern folgen, liegt es nahe, einzugreifen, bevor ein Problem auftritt – das ist der Grundgedanke hinter dem Konzept von Predictive Analytics.

Großes bisher meist ungenutztes Potential

Systeme, die Risiken und Abweichungen als Frühwarnsystem erkennen, besitzen ein enormes wirtschaftliches Potential. In der Produktion beispielsweise können Maschinen länger reibungsfrei laufen und auch die IT-Infrastruktur profitiert. Predictive Analytics verändern aber auch die Unternehmensführung von Grund auf: Wenn Entscheidungen nur noch auf Basis von Daten anstatt von einem „Bauchgefühl” getroffen werden, verändert sich auch das Machtgefälle zugunsten der IT.

Wenn Entscheider sich nur noch auf Daten verlassen sollen/wollen und ihr Bauchgefühl ausschalten müssen, dann führt das zu einer Art “kultureller Überforderung” wie die Studie „Predictive Analytics 2018“ von IDG Research Services zeigt. Aber den meisten von ihnen ist klar, dass an dem Thema auf lange Sicht kein Weg vorbei führt. Zum Zeitpunkt der Befragung, die schon etwas zurückliegt, stuften bereits 47 Prozent der Unternehmen die Relevanz von Predictive Analytics als sehr hoch (18 Prozent) oder hoch (29 Prozent) ein. Über ein Drittel war aber bereits der Überzeugung, das Predictive Analytics spätestens 2021 eine sehr wichtige Rolle spielen wird.

Intelligenz in den Workflow bringen

Für Managed-Cloud-Unternehmen wie Adacor gewinnt Predictive Analytics in zweierlei Hinsicht an Bedeutung. Zum einen lassen sich damit Prozesse verbessern, mit denen bereits in der Vergangenheit Themen wie das Management von Server-Log-Daten oder CPU-Auslastungen automatisiert und vorausschauend gesteuert wurden.

Für Private Cloud Services, der maßgeschneiderten Erweiterung von internen Rechenzentren bedeutet dies, Teile des Live-Monitorings nach und nach in ein Predictive-Monitoring umzuwandeln und so auf mögliche Ausfälle oder Beeinträchtigungen von Servern im Vorfeld zu reagieren, um so auch den Ausfall für den Kunden zu verhindern. In einem einfachen Beispiel bewertet ein Deep-Learning Modell, ob auf einem beliebigen System die Festplattenfüllstände in der Zukunft stabil verlaufen werden oder ob mit instabilem Verhalten zu rechnen ist. Wird Stabilität erwartet, dann kann ein simpleres Vorhersagemodell diese Stabilität nutzen und die Füllstände vorhersagen. Ist mit instabilem Verhalten zu rechnen, dann wissen die Administratoren, dass sie ein besonderes Auge auf das entsprechende System werfen sollten. So wird durch vergleichsweise einfache Predictive-Monitoring Methoden bereits eine deutlich erhöhte Ausfallsicherheit der Systeme gewährleistet.

Neben stark individualisierten Cloud-Lösungen werden in Zukunft standardisierte Angebote immer mehr nachgefragt werden, die durch Predictive-Analytic-Tools „intelligenter” werden. Übersetzt bedeutet das, maschinelles Lernen nach Möglichkeit automatisch auf neue Prozesse anzuwenden und so Server bzw. die Cloud noch leistungsfähiger und sicherer zu machen.

Size matters

Die Studie zeigte, dass vor allem große Unternehmen Ressourcen für Analytics-Projekte bereitstellen. Über ein Drittel von ihnen hatte bereits Analytics-Projekte umgesetzt, mehr als die Hälfte davon im Bereich Predictive Analytics. Kleine und mittelständische Firmen hingegen verfügten noch wenig über umfangreiche Analytics-Systeme. Die Ergebnisse aus den Predictive-Analytics-Projekten beeinflussen im Wesentlichen auch die Management-Entscheidungen. 94 Prozent der Firmen, die Predictive Analytics anwenden, steuern über die Auswertungen Prozesse vor allem im IT-Bereich, im strategischen Management sowie in Produktion und Fertigung. Die großen Unternehmen sind also größtenteils schon dabei, sich die Vorteile zu nutzen zu machen. Bei mittelständischen und kleineren Unternehmen besteht noch deutlicher Nachholbedarf. Schon die technischen Voraussetzungen genügen häufig nicht den Anforderungen.

Fast alle Branchen können profitieren

Das erstaunt, denn Predictive Analytics kann in vielen Bereichen als eine Art Frühwarnsystem eingesetzt werden. Es hilft nicht nur dabei, Maschinenausfälle bei Produktionsunternehmen durch vorausschauende Wartungen zu minimieren. Es kann zum Beispiel auch den Vertrieb von Handelsunternehmen optimieren. In der Medizin kommen bereits Methoden zum Einsatz, durch die sich Risikofaktoren schneller identifizieren und die Behandlung von Krankheiten insgesamt verbessern lässt. Versicherungen und auch Finanzinstitute kalkulieren ihre Produkte und Prämien seit jeher erfolgreich auf Basis von Wahrscheinlichkeitsanalysen und Hochrechnungen. Auch im Bereich der Betrugsprävention werden entsprechend Methoden und Tools verstärkt eingesetzt, um Kriminellen das Handwerk zu legen.

Man sieht, es lohnt sich für Unternehmen, die Daten sammeln, ihre Strategie an die neuen Technologien anzupassen. Die aktuellen Möglichkeiten zur Analyse und Aggregierung von Daten und Informationen sind extrem groß. Es kommt darauf an, Muster in den „Big Data” zu erkennen und diese richtig zu interpretieren – anstatt dieselben Fehler immer und immer wieder zu machen.

“Saubere Ablage“ bringt Unternehmen nicht weiter

Unternehmen, die Daten sammeln, um diese lediglich sauber abzulegen und zu archivieren, sollten Ihre Strategie an die neuen Möglichkeiten des Predictive Analytics anpassen. Die aktuellen Möglichkeiten zur Auswertung und zur Verdichtung von Daten zu Informationen und somit zur Generierung von Wissen sind extrem groß. Nur wer Muster im großen Reich der Daten erkennt und diese auch richtig interpretieren kann, wird kann mit Predicitve Analytics ein Frühwarnsystem zu seinen Gunsten aufbauen.

The Importance of Equipment Calibration in Maintaining Data Integrity

Image by Unsplash.

New data-collection technologies, like internet of things (IoT) sensors, enable businesses across industries to collect accurate, minute-to-minute data that they can use to improve business processes and drive decision-making.

However, as data becomes more central to business processes and as more and more data is collected, collection errors become both more possible and more costly.

Here is why equipment calibration is key in maintaining data integrity — in every industry.

Bad Calibration, Bad Data

If a sensor or piece of equipment is improperly calibrated, the data it records could be incomplete, inaccurate or totally incorrect. This misinformation could be detrimental for businesses that integrate data-driven policies and strategies, as they rely on complete, up-to-date and accurate data.

In fact, poor calibration cost manufacturers an average of $1.7 million every year, according to a 2008 survey.

Poorly calibrated sensors and testing equipment can also present risks for consumers — which is why some industries control calibration. In medicine, for example, the FDA regulates equipment calibration. Medical manufacturers must regularly inspect and test monitoring equipment. Effective measuring and test equipment are vital for producing batches of drugs that are useful and safe for patient health.

Bad calibration can even lead to machine failure in businesses that rely on predictive maintenance, which is the use of IoT sensors to collect machine data that can help analysts predict machine failure before it happens. If a business’ data scientists are working with bad information, they are less likely to realize a particular machine or robot is failing. As a result, they won’t intervene with a repair until failure has occurred — a costly error that can effectively shut down some workflows.

Worse, if a business has come to depend on predictive maintenance, it may be caught off-guard by that machine’s failure — even more than if the same company relied on traditional maintenance strategies, rather than predictive analytics.

How to Ensure Equipment Calibration

Fortunately, businesses can ensure the continued quality of their data-collecting processes by committing to regular equipment calibration.

While not all industries are subject to equipment calibration regulations, standards from other industries — like those established by the FDA — could provide useful best practice frameworks.

Businesses that don’t have a dedicated equipment maintenance team can choose an external calibration solution or hire or train a team to handle equipment calibration. Some businesses — such as manufacturers who work with numerous advanced or highly sensitive machines — might need multiple calibration teams or companies with specialized experience.

In general, businesses and manufacturers should establish a regular calibration and inspection schedule. Each time someone calibrates a piece of equipment, they should document that process. Documentation should include the date of the last calibration, the results of any tests conducted and the due date for the next calibration. This process can help establish a pattern of sensor error that equipment maintenance teams can use to better predict and respond to glitches.

Even if a business only uses a certain kind of data from one sensor on a piece of testing equipment, workers should test every sensor on that machine. Errors from other sensors can influence properly calibrated sensors, even if no one is actively using the data they collect. This will become even truer as smart analysis technologies and IoT platforms become more common and algorithms handle larger portions of the data analysis process.

Calibrating Equipment for Accurate Data

Data is one of the most valuable resources available to modern businesses. However, a cost comes with relying too heavily on data and not properly calibrating the equipment that collects that data.

Equipment calibration is key to maintaining data integrity. If testing equipment and sensors aren’t properly calibrated, they can record incorrect data, which may lead to delays or lower product quality. Regular equipment calibration can help businesses ensure the data they receive is accurate and of the highest caliber.

Visual Question Answering with Keras – Part 2: Making Computers Intelligent to answer from images

Making Computers Intelligent to answer from images

This is my second blog on Visual Question Answering, in the last blog, I have introduced to VQA, available datasets and some of the real-life applications of VQA. If you have not gone through then I would highly recommend you to go through it. Click here for more details about it.

In this blog post, I will walk through the implementation of VQA in Keras.

You can download the dataset from here: https://visualqa.org/index.html. All my experiments were performed with VQA v2 and I have used a very tiny subset of entire dataset i.e all samples for training and testing from the validation set.

Table of contents:

  1. Preprocessing Data
  2. Process overview for VQA
  3. Data Preprocessing – Images
  4. Data Preprocessing through the spaCy library- Questions
  5. Model Architecture
  6. Defining model parameters
  7. Evaluating the model
  8. Final Thought
  9. References

NOTE: The purpose of this blog is not to get the state-of-art performance on VQA. But the idea is to get familiar with the concept. All my experiments were performed with the validation set only.

Full code on my Github here.


1. Preprocessing Data:

If you have downloaded the dataset then the question and answers (called as annotations) are in JSON format. I have provided the code to extract the questions, annotations and other useful information in my Github repository. All extracted information is stored in .txt file format. After executing code the preprocessing directory will have the following structure.

All text files will be used for training.


2. Process overview for VQA:

As we have discussed in previous post visual question answering is broken down into 2 broad-spectrum i.e. vision and text.  I will represent the Neural Network approach to this problem using the Convolutional Neural Network (for image data) and Recurrent Neural Network(for text data). 

If you are not familiar with RNN (more precisely LSTM) then I would highly recommend you to go through Colah’s blog and Andrej Karpathy blog. The concepts discussed in this blogs are extensively used in my post.

The main idea is to get features for images from CNN and features for the text from RNN and finally combine them to generate the answer by passing them through some fully connected layers. The below figure shows the same idea.


I have used VGG-16 to extract the features from the image and LSTM layers to extract the features from questions and combining them to get the answer.

3. Data Preprocessing – Images:

Images are nothing but one of the input to our model. But as you already may know that before feeding images to the model we need to convert into the fixed-size vector.

So we need to convert every image into a fixed-size vector then it can be fed to the neural network. For this, we will use the VGG-16 pretrained model. VGG-16 model architecture is trained on millions on the Imagenet dataset to classify the image into one of 1000 classes. Here our task is not to classify the image but to get the bottleneck features from the second last layer.

Hence after removing the softmax layer, we get a 4096-dimensional vector representation (bottleneck features) for each image.

Image Source: https://www.cs.toronto.edu/~frossard/post/vgg16/


For the VQA dataset, the images are from the COCO dataset and each image has unique id associated with it. All these images are passed through the VGG-16 architecture and their vector representation is stored in the “.mat” file along with id. So in actual, we need not have to implement VGG-16 architecture instead we just do look up into file with the id of the image at hand and we will get a 4096-dimensional vector representation for the image.

4. Data Preprocessing through the spaCy library- Questions:

spaCy is a free, open-source library for advanced Natural Language Processing (NLP) in Python. As we have converted images into a fixed 4096-dimensional vector we also need to convert questions into a fixed-size vector representation. For installing spaCy click here

You might know that for training word embeddings in Keras we have a layer called an Embedding layer which takes a word and embeds it into a higher dimensional vector representation. But by using the spaCy library we do not have to train the get the vector representation in higher dimensions.


This model is actually trained on billions of tokens of the large corpus. So we just need to call the vector method of spaCy class and will get vector representation for word.

After fitting, the vector method on tokens of each question will get the 300-dimensional fixed representation for each word.

5. Model Architecture:

In our problem the input consists of two parts i.e an image vector, and a question, we cannot use the Sequential API of the Keras library. For this reason, we use the Functional API which allows us to create multiple models and finally merge models.

The below picture shows the high-level architecture idea of submodules of neural network.

After concatenating the 2 different models the summary will look like the following.

The below plot helps us to visualize neural network architecture and to understand the two types of input:


6. Defining model parameters:

The hyperparameters that we are going to use for our model is defined as follows:

If you know what this parameter means then you can play around it and can get better results.

Time Taken: I used the GPU on https://colab.research.google.com and hence it took me approximately 2 hours to train the model for 5 epochs. However, if you train it on a PC without GPU, it could take more time depending on the configuration of your machine.

7. Evaluating the model:

Since I have used the very small dataset for performing these experiments I am not able to get very good accuracy. The below code will calculate the accuracy of the model.


Since I have trained a model multiple times with different parameters you will not get the same accuracy as me. If you want you can directly download mode.h5 file from my google drive.


8. Final Thoughts:

One of the interesting thing about VQA is that it a completely new field. So there is absolutely no end to what you can do to solve this problem. Below are some tips while replicating the code.

  1. Start with a very small subset of data: When you start implementing I suggest you start with a very small amount of data. Because once you are ready with the whole setup then you can scale it any time.
  2. Understand the code: Understanding code line by line is very much helpful to match your theoretical knowledge. So for that, I suggest you can take very few samples(maybe 20 or less) and run a small chunk (2 to 3 lines) of code to get the functionality of each part.
  3. Be patient: One of the mistakes that I did while starting with this project was to do everything at one go. If you get some error while replicating code spend 4 to 5 days harder on that. Even after that if you won’t able to solve, I would suggest you resume after a break of 1 or 2 days. 

VQA is the intersection of NLP and CV and hopefully, this project will give you a better understanding (more precisely practically) with most of the deep learning concepts.

If you want to improve the performance of the model below are few tips you can try:

  1. Use larger datasets
  2. Try Building more complex models like Attention, etc
  3. Try using other pre-trained word embeddings like Glove 
  4. Try using a different architecture 
  5. Do more hyperparameter tuning

The list is endless and it goes on.

In the blog, I have not provided the complete code you can get it from my Github repository.

9. References:

  1. https://blog.floydhub.com/asking-questions-to-images-with-deep-learning/
  2. https://tryolabs.com/blog/2018/03/01/introduction-to-visual-question-answering/
  3. https://github.com/sominwadhwa/vqamd_floyd