Posts

Article series: 5 Clean Coding Tips – 5.Put yourself in somebody else’s shoes

This is the fifth of the article series “5 tips for clean coding” to follow as soon as you’ve made the first steps into your coding career, in this article series. Read the introduction here, to find out why it is important to write clean code if you missed it.

It might be a bit repetitive to bring up how important the readability of the code is, let’s do it anyway. In the majority of the cases you are writing for others, therefore you need to put yourself in their shoes to be able to assess how good the readability of your code is. For you, it all might be obvious because you wrote it. But it doesn’t have to be easy to read for someone else. If you have a colleague or a friend that has a bit of time for you and is willing to give you feedback, that is great. If, however, you don’t have such a person, having a few imaginary friends might be helpful in this case. It might sound crazy, but don’t close this page just yet. Having a set of imaginary personas at your disposal, to review your work with their eyes, can help you a lot. Imagine that your code met one of those guys. What would they say about it? If you work in a team or collaborate with people, you probably don’t have to imagine them. You’ve met them.

The_PEP8_guy – He has years of experience. He is used to seeing the code in a very particular way. He quotes the style guide during lunch. His fingers make the perfect line splitting and indentation without even his thoughts reaching the conscious state. He knows that lowercase_with_underscore is for variables, UPPER_CASE_NAMES are for constants and the CapitalizedWords are for classes. He will be lost if you do it in any different way. His expectations will not meet what you wrote, and he will not understand anything, because he will be too distracted by the messed up visual. Depending on the character he might start either crying or shouting. Read the style guide and follow it. You might be able to please this guy at least a little bit with the automatic tools like pylint.

The_ grieving _widow – Imagine that something happens to you. Let’s say, that you get hit by a bus[i]. You leave behind sadness and the_ grieving_widow to manage your code, your legacy. Will the future generations be able to make use of it or were you the only one who can understand anything you wrote? That is a bit of an extreme situation, ok. Alternatively, imagine, that you go for a 5-week vacation to a silent retreat with a strict no-phone policy (or that is what you tell your colleagues). Will they be able to carry on if they cannot ask you anything about the code? Review your code and the documentation from the perspective of the poor grieving_widow.

The_not_your_domain_guy – He is from the outside of the world you are currently in and he just does not understand your jargon. He doesn’t have to know that in data science a feature, a predictor and an x probably mean the same thing. SNR might shout signal-to-noise ratio at you, it will only snort at him. You might use abbreviations that are obvious to you but not to everyone. If you think that the majority of people can understand, and it helps with the code readability keep the abbreviations but just in case, document/comment them. There might be abbreviations specific to your company and, someone from the outside, a new guy, a consultant will not get them. Put yourself in the shoes of that guy and maybe make your code a bit more democratic wherever possible.

The_foreigner– You might be working in an environment, where every single person speaks the same language you speak, and it happens not to be English. So, you and your colleagues name variables and write the comments in your language. However, unless you work in a team with rules a strict as Athletic Bilbao, there might be a foreigner joining your team in the future. It is hard to argue that English is the lingua franca in programming (and in the world), these days. So, it might be worth putting yourself in the_foreigner’s shoes, while writing your code, to avoid a huge amount of work in the future, that the translation and explanation will require. And even if you are working on your own, you might want to make your code public one day and want as many people as possible to read it.

The_hurry_up_guy – we all know this guy. Sometimes he doesn’t have a body or a face, but we can feel his presence. You might want to write a perfect solution, comment it in the best possible way and maybe add a bit of glitter on top but sometimes you just need to give in and do it his way. And that’s ok too.

References:

[i] https://en.wikipedia.org/wiki/Bus_factor

Article series: 5 Clean Coding Tips – 3. Take Advantage of the Formatting Tools.

This is the third of the article series “5 tips for clean coding” to follow as soon as you’ve made the first steps into your coding career, in this article series. Read the introduction here, to find out why it is important to write clean code if you missed it.

Unfortunately, no automatic formatting tool will correct the logic in your code, suggest meaningful names of your variables or comment the code for you. Yet. Gmail has lately started suggesting email titles based on email content. AI-powered variable naming can be next, who knows. Anyway, the visual level of the code is much easier to correct and there are tools that will do some of the code formatting on the visual level job for you. Some of them might be already existing in your IDE, you just need to look for them a bit, others need to be installed. One of the most popular formatting tools is pylint[i]. It is worth checking it out and learning to use it in an efficient way.

Beware that as convenient as it may seem to copy and paste your code into a quick online ‘beautifier’ it is not always a good idea. The online tools might store your code. If you are working on something that shouldn’t just freely float in the world wide web, stick to reliable tools like pylint, that will store the data within your working directory.

These tools can become very good friends of yours but also very annoying ones. They will not miss single whitespace and will not keep their mouth shut when your line length jumps from 79 to 80 characters. They will be shouting with an underscoring of some worrying color and/or exclamation marks. You will need to find your way to coexist and retain your sanity. It can be very distracting when you are in a working flow and warnings pop up all the time about formatting details that have nothing to do with what you are trying to solve. Sometimes, it might be better to turn those warnings off while you are in your most concentrated/creative phase of writing and turn them back on while the dust of your genius settles down a little bit. Usually the offer a lot of flexibility, regarding which warnings you want to be ignored and other features. The good thing is, they also teach you what are mistakes that you are making and after some time you will just stop making them in the first place.

References:

[i] https://www.pylint.org/

Article series: 5 Clean Coding Tips – 2. Name Variables in a Meaningful Way

This is the second of the article series “5 tips for clean coding” to follow as soon as you’ve made the first steps into your coding career, in this article series. Read the introduction here, to find out why it is important to write clean code if you missed it.

When it comes to naming variables, there are a few official rules in the PEP8 style guide. A variable must start with an underscore or a letter and can be followed by a number of underscores or letters or digits. They cannot be reserved words: True, False, or, not, lambda etc. The preferred naming style is lowercase or lowercase_with_underscore. This all refers to variable names on a visual level. However, for readability purposes, the semantic level is as important, or maybe even more so. If it was for python, the variables could be named like this:

It wouldn’t make the slightest difference. But again, the code is not only for the interpreter to be read. It is for humans. Other people might need to look at your code to understand what you did, to be able to continue the work that you have already started. In any case, they need to be able to decipher what hides behind the variable names, that you’ve given the objects in your code. They will need to remember what they meant as they reappear in the code. And it might not be easy for them.

Remembering names is not an easy thing to do in all life situations. Let’s consider the following situation. You go to a party, there is a bunch of new people that you meet for the first time. They all have names and you try very hard to remember them all. Imagine how much easier would it be if you could call the new girl who came with John as the_girl_who_came_with_John. How much easier would it be to gossip to your friends about her? ‘Camilla is on the 5th glass of wine tonight, isn’t she?!.’ ‘Who are you talking about???’ Your friends might ask. ‘The_Girl_who_came_with_John.’ And they will all know. ‘It was nice to meet you girl_who_came_with_john, see you around.’ The good thing is that variables are not really like people. You can be a bit rude to them, they will not mind. You don’t have to force yourself or anyone else to remember an arbitrary name of a variable, that accidentally came to your mind in the moment of creation. Let your colleagues figure out what is what by a meaningful, straightforward description of it.

There is an important tradeoff to be aware of here. The lines of code should not exceed a certain length (79 characters, according to the PEP 8), therefore, it is recommended that you keep your names as short as possible. It is worth to give it a bit of thought about how you can name your variable in the most descriptive way, keeping it as short as possible. Keep in mind, that
the_blond_girl_in_a_dark_blue_dress_who_came_with_John_to_this_party might not be the best choice.

There are a few additional pieces of advice when it comes to naming your variables. First, try to always use pronounceable names. If you’ve ever been to an international party, you will know how much harder to remember is something that you cannot even repeat. Second, you probably have been taught over and over again that whenever you create a loop, you use i and j to denote the iterators.

It is probably engraved deep into the folds in your brain to write for i in…. You need to try and scrape it out of your cortex. Think about what the i stands for, what it really does and name it accordingly. Is i maybe the row_index? Is it a list_element?

Additionally, think about when to use a noun and where a verb. Variables usually are things and functions usually do things. So, it might be better to name functions with verb expressions, for example: get_id() or raise_to_power().

Moreover, it is a good practice to name constant numbers in the code. First, because when you name them you explain the meaning of the number. Second, because maybe one day you will have to change that number. If it appears multiple times in your code, you will avoid searching and changing it in every place. PEP 8 states that the constants should be named with UPPER_CASE_NAME. It is also quite common practice to explain the meaning of the constants with an inline comment at the end of the line, where the number appears. However, this approach will increase the line length and will require repeating the comment if the number appears more than one time in the code.

Article series: 5 Clean Coding Tips – 1. Be Consistent

This is the first of the article series “5 tips for clean coding” to follow as soon as you’ve made the first steps into your coding career, in this article series. Read the introduction here, to find out why it is important to write clean code if you missed it.

Consistency is THE rule to follow if you want to make your code clean and increase readability. Not to make it sound desperate, but honestly, whatever you decide to do when it comes to the coding style, just be consistent. Whether you agree with any standards, formatting styles or don’t even know them, just be consistent. Don’t ever allow inconsistency to sneak into your script or your project. This will only bring confusion, disorientation, chaos and general misery.

The rules for how exactly keep your code clean and organized visually might differ slightly depending on the situation you find yourself in. The PEP 8 rules can be ambiguous in some places and leave room for interpretation. For example, the question, whether you use single or double quotes to denote a string, is open. It is possible, that your work environment already has a standard and you just need to comply with that. No room to show off your highly unique take on it, sorry. However, if you are working on your own and there is no one to roll their eyes looking at your messed-up code, you need to decide for yourself. Once you do, again, be consistent at the level of the script, project, your work in general. Otherwise, it will look messy, patchworky and simply unprofessional.

People famously are quick to ascribe intentionality, even to thermostats[i]. They will assume that the details of how you wrote your code are intentional. They will try to figure out why you are doing one thing in some places and a different thing in other places. If those differences came from you being careless and have no meaning behind them, the reader of your code will waste a lot of time trying to figure it out and end up frustrated. Remember the first few snippets of python code you have ever seen? Maybe you saw some code with double quotes and some with single quotes. You were green, knew nothing and quite possibly thought that they both have different meanings and you spent time trying to figure out why on earth in some places there is a single quote and in other double-quotes.

If those altruistic arguments do not really convince you, let’s see how consistency can serve to your own benefit. First, that outsider, who is looking at your code and is trying very hard to figure out what on Earth is going on, might be you. It might sound crazy, and it is, indeed, quite sad, but most likely, after 6 months of not looking at your code you will no longer remember what you did there if it is not documented well. Documenting in a homogenous way can take some time and some effort. Nevertheless, in general, code gets read many times after it has been written. When in doubt, sacrifice some of your writing time to increase readability and minimize the reading time later. It will pay off in the long run.

Having a set of rules at your disposal can make your work faster. You will avoid arguing with yourself about which option is the best one: mean_income, income_mean or income_avg. You can avoid making loads of small decisions as you write your code by making a set of global rules. In that way, you can allocate your energy and resources into solving the real problem. Not the how-do-I-format-this? one.

It is not necessary that you make all those grand decisions right now. You also don’t have to make them for life, it’s ok to change your mind eventually, so don’t feel overwhelmed. But once you’ve learned this and that, spent a little time coding, have a good long look at your sprouting habits and decide what you are going to do about splitting those lines and stick to it!

References:

[i] https://en.wikipedia.org/wiki/Intentional_stance

Article series: 5 Clean Coding Tips

This series of articles will cover 5 clean coding tips to follow as soon as you’ve made the first steps into your coding career, with the example of python.

At the beginning of your adventure with coding, you might find that getting your code to compile without any errors and give you the output that you expect is hard enough. Conforming to any standards and style guides is at the very bottom of your concerns. You might be at the beginning of your career or you might have a lot of domain experience but not that much in coding. Or maybe until now you worked mostly on your own and never had to make your code available for others to work with it. In any case, it is worth acknowledging how crucial it is to write your code in a concise, readable and understandable way, and how much benefits it will eventually bring you.

The first thing to realize is that the whole clean coding concept has been developed for people, your fellow travelers, not for the computers. The compiler doesn’t care how you name your variables, how you split your lines or if everything is aligned in a pretty way. You could even write your code as a one gigantic, few-meters-long line, giving the interpreter just a signal – a semicolon, that the line should be split, and it will execute it perfectly.

However, it is likely that, the deeper you are into your career, the more people will have to read, understand and modify the code that you wrote. You will write code to communicate certain ideas and solutions with other people. Therefore, you need to be sure, that what you want to communicate is understandable, easy and quick to read. The coding best practice is to always code in a clean way, treating the code itself and not just the output as the result of your work.

There usually are fixed rules and standards regarding code readability. For python, it is the PEP 8[i]. Some companies elaborate on those standards where the PEP 8 is a bit vague or leaves room for interpretation. The exact formatting styles might differ at Facebook, Google[ii] or at the company you happen to work for. But before you get lost in the art of a perfect line splitting, brackets alignment technique, or the hopeless tabs or spaces battle, have a look at the 5 tips in the upcoming articles in this series. They are universal and might help you make your code, less of a chaotic mess and more of blissful delight.

List of articles in this series:

  1. Be consistent
  2. Name variables in a meaningful way
  3. Take advantage of the formatting tools
  4. Stop commenting the obvious
  5. Put yourself in somebody else’s shoes
References:

[i] https://www.python.org/dev/peps/pep-0008/
[ii] http://google.github.io/styleguide/pyguide.html

Python vs R: Which Language to Choose for Deep Learning?

Data science is increasingly becoming essential for every business to operate efficiently in this modern world. This influences the processes composed together to obtain the required outputs for clients. While machine learning and deep learning sit at the core of data science, the concepts of deep learning become essential to understand as it can help increase the accuracy of final outputs. And when it comes to data science, R and Python are the most popular programming languages used to instruct the machines.

Python and R: Primary Languages Used for Deep Learning

Deep learning and machine learning differentiate based on the input data type they use. While machine learning depends upon the structured data, deep learning uses neural networks to store and process the data during the learning. Deep learning can be described as the subset of machine learning, where the data to be processed is defined in another structure than a normal one.

R is developed specifically to support the concepts and implementation of data science and hence, the support provided by this language is incredible as writing codes become much easier with its simple syntax.

Python is already much popular programming language that can serve more than one development niche without straining even for a bit. The implementation of Python for programming machine learning algorithms is very much popular and the results provided are accurate and faster than any other language. (C or Java). And because of its extended support for data science concept implementation, it becomes a tough competitor for R.

However, if we compare the charts of popularity, Python is obviously more popular among data scientists and developers because of its versatility and easier usage during algorithm implementation. However, R outruns Python when it comes to the packages offered to developers specifically expertise in R over Python. Therefore, to conclude which one of them is the best, let’s take an overview of the features and limits offered by both languages.

Python

Python was first introduced by Guido Van Rossum who developed it as the successor of ABC programming language. Python puts white space at the center while increasing the readability of the developed code. It is a general-purpose programming language that simply extends support for various development needs.

The packages of Python includes support for web development, software development, GUI (Graphical User Interface) development and machine learning also. Using these packages and putting the best development skills forward, excellent solutions can be developed. According to Stackoverflow, Python ranks at the fourth position as the most popular programming language among developers.

Benefits for performing enhanced deep learning using Python are:

  • Concise and Readable Code
  • Extended Support from Large Community of Developers
  • Open-source Programming Language
  • Encourages Collaborative Coding
  • Suitable for small and large-scale products

The latest and stable version of Python has been released as Python 3.8.0 on 14th October 2019. Developing a software solution using Python becomes much easier as the extended support offered through the packages drives better development and answers every need.

R

R is a language specifically used for the development of statistical software and for statistical data analysis. The primary user base of R contains statisticians and data scientists who are analyzing data. Supported by R Foundation for statistical computing, this language is not suitable for the development of websites or applications. R is also an open-source environment that can be used for mining excessive and large amounts of data.

R programming language focuses on the output generation but not the speed. The execution speed of programs written in R is comparatively lesser as producing required outputs is the aim not the speed of the process. To use R in any development or mining tasks, it is required to install its operating system specific binary version before coding to run the program directly into the command line.

R also has its own development environment designed and named RStudio. R also involves several libraries that help in crafting efficient programs to execute mining tasks on the provided data.

The benefits offered by R are pretty common and similar to what Python has to offer:

  • Open-source programming language
  • Supports all operating systems
  • Supports extensions
  • R can be integrated with many of the languages
  • Extended Support for Visual Data Mining

Although R ranks at the 17th position in Stackoverflow’s most popular programming language list, the support offered by this language has no match. After all, the R language is developed by statisticians for statisticians!

Python vs R: Should They be Really Compared?

Even when provided with the best technical support and efficient tools, a developer will not be able to provide quality outputs if he/she doesn’t possess the required skills. The point here is, technical skills rank higher than the resources provided. A comparison of these two programming languages is not advisable as they both hold their own set of advantages. However, the developers considering to use both together are less but they obtain maximum benefit from the process.

Both these languages have some features in common. For example, if a representative comes asking you if you lend technical support for developing an uber clone, you are directly going to decline as Python and R both do not support mobile app development. To benefit the most and develop excellent solutions using both these programming languages, it is advisable to stop comparing and start collaborating!

R and Python: How to Fit Both In a Single Program

Anticipating the future needs of the development industry, there has been a significant development to combine these both excellent programming languages into one. Now, there are two approaches to performing this: either we include R script into Python code or vice versa.

Using the available interfaces, packages and extended support from Python we can include R script into the code and enhance the productivity of Python code. Availability of PypeR, pyRserve and more resources helps run these two programming languages efficiently while efficiently performing the background work.

Either way, using the developed functions and packages made available for integrating Python in R are also effective at providing better results. Available R packages like rJython, rPython, reticulate, PythonInR and more, integrating Python into R language is very easy.

Therefore, using the development skills at their best and maximizing the use of such amazing resources, Python and R can be togetherly used to enhance end results and provide accurate deep learning support.

Conclusion

Python and R both are great in their own names and own places. However, because of the wide applications of Python in almost every operation, the annual packages offered to Python developers are less than the developers skilled in using R. However, this doesn’t justify the usability of R. The ultimate decision of choosing between these two languages depends upon the data scientists or developers and their mining requirements.

And if a developer or data scientist decides to develop skills for both- Python and R-based development, it turns out to be beneficial in the near future. Choosing any one or both to use in your project depends on the project requirements and expert support on hand.

Wie der C++-Programmierer bei der Analyse großer Datenmengen helfen kann

Die Programmiersprache C wurde von Dennis Ritchie in den Bell Labs in einer Zeit (1969-1973) entwickelt, als jeder CPU-Zyklus und jeder Byte Speicher sehr teuer war. Aus diesem Grund wurde C (und später C++) so konzipiert, dass die maximale Leistung der Hardware mit der Sprachkomplexität erzielt werden konnte. Derzeit ist der C++ Programmierer besonders begehrt auf dem Arbeitsmarkt, für ganz bestimmte Abläufe, die wir später genauer beschreiben werden.

Warum sollten Sie einen C++ Entwickler mieten, wenn es um große Daten geht?

C++ ermöglicht, als Sprache auf einem niedrigen Level, eine Feinabstimmung der Leistung der Anwendung in einer Weise, die bei der Verwendung von Sprachen auf einem hohen Level nicht möglich ist. Warum sollten Sie einen C++ Entwickler mieten? C++ bietet den Entwicklern eine viel bessere Kontrolle über den Systemspeicher und die Ressourcen, als die der C Programmierer oder Anderer.

C++ ist die einzige Sprache, in der man Daten mit mehr als 1 GB pro Sekunde knacken, die prädiktive Analyse in Echtzeit neu trainieren und anwenden und vierstellige QPS einer REST-ful API in der Produktion bedienen kann, während die [eventuelle] Konsistenz des Aufzeichnungssystems ständig erhalten bleibt. Auf einem einzigen Server, natürlich aus Gründen der Zuverlässigkeit dupliziert, aber das, ohne in Repliken, Sharding und das Auffüllen und Wiederholen von persistenten Nachrichtenwarteschlangen investieren zu. Für ein groß angelegtes Werbesystem, dynamischen Lastausgleich oder eine hocheffiziente adaptive Caching-Schicht ist C++ die klügste Wahl.

Die allgemeine Vorstellung ist, dass R und Python schneller sind, aber das ist weit von der Wahrheit entfernt. Ein gut optimierter C++-Code könnte hundertmal schneller laufen, als das gleiche Stück Code, das in Python oder R geschrieben wurde. Die einzige Herausforderung bei C++ ist die Menge an Arbeit, die Sie bewältigen müssen, um die fertigen Funktionen zum Laufen zu bringen. Sie müssen wissen, wie man Zeiger verteilt und verwaltet – was ehrlich gesagt ein wenig kompliziert sein kann. Die C# Programmierer Ausbildung ist aus diesem Grunde z.Z. sehr begehrt.

R und Python

Akademiker und Statistiker haben R über zwei Jahrzehnte entwickelt. R verfügt nun über eines der reichsten Ökosysteme, um Datenanalysen durchzuführen. Es sind etwa 12000 Pakete in CRAN (Open-Source-Repository) verfügbar. Es ist möglich, eine Bibliothek zu finden, für was auch immer für eine Analyse Sie durchführen möchten. Die reiche Vielfalt der Bibliothek macht R zur ersten Wahl für statistische Analysen, insbesondere für spezialisierte analytische Arbeiten.

Python kann so ziemlich die gleichen Aufgaben wie R erledigen: Data Wrangling, Engineering, Feature Selection Web Scrapping, App und so weiter. Python ist ein Werkzeug, um maschinelles Lernen in großem Maßstab einzusetzen und zu implementieren. Python-Codes sind einfacher zu warten und robuster als R. Vor Jahren hatte Python nicht viele Bibliotheken für Datenanalyse und maschinelles Lernen. In letzter Zeit holt Python auf und bietet eine hochmoderne API für maschinelles Lernen oder künstliche Intelligenz. Der größte Teil der datenwissenschaftlichen Arbeit kann mit fünf Python-Bibliotheken erledigt werden: Numpy, Pandas, Scipy, Scikit-Learning und Seaborn.

Aber das Wissen, mit Zeigern zu arbeiten oder den Code in C++ zu verwalten, ist mit einem hohen Preis verbunden. Aus diesem Grunde werden C++ Programmierer gesucht, für die Bewältigung von großen Datenpaketen. Ein tiefer Einblick in das Innenleben der Anwendung ermöglicht es ihnen, die Anwendung im Falle von Fehlern besser zu debuggen und sogar Funktionen zu erstellen, die eine Kontrolle des Systems auf Mikroebene erfordern. Schauen Sie sich doch nach C# Entwickler in Berlin um, denn sie haben einen besonders guten Ruf unter den neuen Entwicklern.

Das Erlernen der Programmierung ist eine wesentliche Fähigkeit im Arsenal der Analysten von Big Data. Analysten müssen kodieren, um numerische und statistische Analysen mit großen Datensätzen durchzuführen. Einige der Sprachen, in deren Erlernen auch die C Entwickler Zeit und Geld investieren sollten, sind unter anderem Python, R, Java und C++. Je mehr sie wissen, desto besser – Programmierer sollten immer daran denken, dass sie nicht nur eine einzelne Sprache lernen sollten. C für Java Programmierer sollte ein MUSS sein.

Wo wird das C++ Programmieren eingesetzt?

Die Programmiersprache C++ ist eine etablierte Sprache mit einem großen Satz von Bibliotheken und Tools, die bereit ist, große Datenanwendungen und verteilte Systeme zu betreiben. In den meisten Fällen wird C++ zum Schreiben von Frameworks und Paketen für große Daten verwendet. Diese Programmiersprache bietet auch eine Reihe von Bibliotheken, die beim Schreiben von Algorithmen für das tiefe Lernen helfen. Mit ausreichenden C++-Kenntnissen ist es möglich, praktisch unbegrenzte Funktionen auszuführen. Dennoch ist C++ nicht die Sprache, die man leicht erlernen kann, da man die über 1000 Seiten Spezifikation und fast 100 Schlüsselwörter beherrschen muss.

Die Verwendung von C++ ermöglicht die prozedurale Programmierung für intensive Funktionen der CPU und die Kontrolle über die Hardware, und diese Sprache ist sehr schnell, weshalb sie bei der Entwicklung verschiedener Spiele oder in Spielmaschinen weit verbreitet ist.

C++ bietet viele Funktionen, die anderen Sprachen fehlen. Darüber hinaus bietet die Sprache auch Zugang zu umfangreichen Vorlagen, die es Ihnen ermöglichen, generische Codes zu schreiben. Als betroffenes Unternehmen sollten Sie sich deshalb tatsächlich überlegen, einen C++ Programmierer zu suchen oder in einen Kurs von C++ für Ihren C Programmierer zu investieren. Am Ende lohnen sich bestimmt diese Kosten.

Und vergessen Sie nicht: C++ ist die einzige Sprache, die in der Lage ist, 1 GB+ Daten in weniger als einer Sekunde zu verarbeiten. Darüber hinaus können Sie Ihr Modell neu trainieren und prädiktive Analysen in Echtzeit und sogar die Konsistenz der Systemaufzeichnung anwenden. Diese Gründe machen C++ zu einer bevorzugten Wahl für Sie, wenn Sie einen Datenwissenschaftler für Ihr Unternehmen suchen.

Beispiele für die Verwendung von C++

Die Verwendung von C++ zur Entwicklung von Anwendungen und vielen produktbasierten Programmen, die in dieser Sprache entwickelt wurden, hat mehrere Vorteile, die nur auf ihren Eigenschaften und ihrer Sicherheit beruhen. Unten finden Sie eine Liste der häufigsten Anwendungen von C++.

  • Google-Anwendungen – Einige der Google-Anwendungen sind auch in C++ geschrieben, darunter das Google-Dateisystem und der Google-Chromium-Browser sowie MapReduce für die Verarbeitung großer Clusterdaten. Die Open-Source-Gemeinschaft von Google hat über 2000 Projekte, von denen viele in den Programmiersprachen C oder C++ geschrieben und bei GitHub frei verfügbar sind.
  • Mozilla Firefox und Thunderbird – Der Mozilla-Internetbrowser Firefox und der E-Mail-Client Thunderbird sind beide in der Programmiersprache C++ geschrieben, und sie sind ebenfalls Open-Source-Projekte. Der C++-Quellcode dieser Anwendungen ist in den MDN-Webdokumenten zu finden.
  • Adobe-Systeme – Die meisten der wichtigsten Anwendungen von Adobe-Systemen werden in der Programmiersprache C++ entwickelt. Zu diesen Anwendungen gehören Adobe Photoshop und Image Ready, Illustrator und Adobe Premier. Sie haben in der Vergangenheit eine Menge Open-Source-Codes veröffentlicht, immer in C++, und ihre Entwickler waren in der C++-Community aktiv.
  • 12D-Lösungen – 12D Solutions Pty Ltd ist ein australischer Softwareentwickler, der sich auf Anwendungen im Bereich Bauwesen und Vermessung spezialisiert hat. Computer Aided Design-System für Vermessung, Bauwesen und mehr. Zu den Kunden von 12D Solutions gehören Umweltberater, Berater für Bau- und Wasserbau, lokale, staatliche und nationale Regierungsabteilungen und -behörden, Vermessungsingenieure, Forschungsinstitute, Bauunternehmen und Bergbau-Berater.
  • In C/C++ geschriebene Betriebssysteme

Apple – Betriebssystem OS XApple – Betriebssystem OS X

Einige Teile von Apple OS X sind in der Programmiersprache C++ geschrieben. Auch einige Anwendungen für den iPod sind in C++ geschrieben.

Microsoft-BetriebssystemeMicrosoft-Betriebssysteme

Der Großteil der Software wird buchstäblich mit verschiedenen Varianten von Visual C++ oder einfach C++ entwickelt. Die meisten der großen Anwendungen wie Windows 95, 98, Me, 200 und XP sind ebenfalls in C++ geschrieben. Auch Microsoft Office, Internet Explorer und Visual Studio sind in Visual C++ geschrieben.

  • Betriebssystem Symbian – Auch Symbian OS wird mit C++ entwickelt. Dies war eines der am weitesten verbreiteten Betriebssysteme für Mobiltelefone.

Die Einstellung eines C- oder C++-Entwicklers kann eine gute Investition in Ihr Projekt-Upgrade sein

Normalerweise benötigen C- und C++-Anwendungen weniger Strom, Speicher und Platz als die Sprachen der virtuellen Maschinen auf hoher Ebene. Dies trägt dazu bei, den Kapitalaufwand, die Betriebskosten und sogar die Kosten für die Serverfarm zu reduzieren. Hier zeigt sich, dass C++ die Gesamtentwicklungskosten erheblich reduziert.

Trotz der Tatsache, dass wir eine Reihe von Tools und Frameworks nur für die Verwaltung großer Daten und die Arbeit an der Datenwissenschaft haben, ist es wichtig zu beachten, dass auf all diesen modernen Frameworks eine Schicht einer niedrigen Programmiersprache – wie C++ – aufgesetzt ist. Die Niedrigsprachen sind für die tatsächliche Ausführung des dem Framework zugeführten Hochsprachencodes verantwortlich. Es ist also ratsam in ein C-Entwickler-Gehalt zu investieren.

Der Grund dafür, dass C++ ein so unverzichtbares Werkzeug ist, liegt darin, dass es nicht nur einfach, sondern auch extrem leistungsfähig ist und zu den schnellsten Sprachen auf dem Markt gehört. Darüber hinaus verfügt ein gut geschriebenes Programm in C++ über ein komplexes Wissen und Verständnis der Architektur der Maschine, sowie der Speicherzugriffsmuster und kann schneller laufen als andere Programme. Es wird Ihrem Unternehmen Zeit- und Stromkosten sparen.

Zum Abschluss eine Grafik, die Sie als Unternehmer interessieren wird und die das Verhältnis von der Performance and der Sicherheit diverser Sprachen darstellt:

Aus diesen und weiteren Gründen neigen viele Unternehmensentwickler und Datenwissenschaftler mit massiven Anforderungen an Skalierbarkeit und Leistung zu dem guten alten C++. Viele Organisationen, die Python oder andere Hochsprachen für die Datenanalyse und Erkundungsaufgaben verwenden, verlassen sich auf C++, um Programme zu entwickeln, die diese Daten an die Kunden weiterleiten – in Echtzeit.

Multi-touch attribution: A data-driven approach

This is the first article of article series Getting started with the top eCommerce use cases.

What is Multi-touch attribution?

Customers shopping behavior has changed drastically when it comes to online shopping, as nowadays, customer likes to do a thorough market research about a product before making a purchase. This makes it really hard for marketers to correctly determine the contribution for each marketing channel to which a customer was exposed to. The path a customer takes from his first search to the purchase is known as a Customer Journey and this path consists of multiple marketing channels or touchpoints. Therefore, it is highly important to distribute the budget between these channels to maximize return. This problem is known as multi-touch attribution problem and the right attribution model helps to steer the marketing budget efficiently. Multi-touch attribution problem is well known among marketers. You might be thinking that if this is a well known problem then there must be an algorithm out there to deal with this. Well, there are some traditional models  but every model has its own limitation which will be discussed in the next section.

Traditional attribution models

Most of the eCommerce companies have a performance marketing department to make sure that the marketing budget is spent in an agile way. There are multiple heuristics attribution models pre-existing in google analytics however there are several issues with each one of them. These models are:

First touch attribution model

100% credit is given to the first channel as it is considered that the first marketing channel was responsible for the purchase.

Figure 1: First touch attribution model

Last touch attribution model

100% credit is given to the last channel as it is considered that the first marketing channel was responsible for the purchase.

Figure 2: Last touch attribution model

Linear-touch attribution model

In this attribution model, equal credit is given to all the marketing channels present in customer journey as it is considered that each channel is equally responsible for the purchase.

Figure 3: Linear attribution model

U-shaped or Bath tub attribution model

This is most common in eCommerce companies, this model assigns 40% to first and last touch and 20% is equally distributed among the rest.

Figure 4: Bathtub or U-shape attribution model

Data driven attribution models

Traditional attribution models follows somewhat a naive approach to assign credit to one or all the marketing channels involved. As it is not so easy for all the companies to take one of these models and implement it. There are a lot of challenges that comes with multi-touch attribution problem like customer journey duration, overestimation of branded channels, vouchers and cross-platform issue, etc.

Switching from traditional models to data-driven models gives us more flexibility and more insights as the major part here is defining some rules to prepare the data that fits your business. These rules can be defined by performing an ad hoc analysis of customer journeys. In the next section, I will discuss about Markov chain concept as an attribution model.

Markov chains

Markov chains concepts revolves around probability. For attribution problem, every customer journey can be seen as a chain(set of marketing channels) which will compute a markov graph as illustrated in figure 5. Every channel here is represented as a vertex and the edges represent the probability of hopping from one channel to another. There will be an another detailed article, explaining the concept behind different data-driven attribution models and how to apply them.

Figure 5: Markov chain example

Challenges during the Implementation

Transitioning from a traditional attribution models to a data-driven one, may sound exciting but the implementation is rather challenging as there are several issues which can not be resolved just by changing the type of model. Before its implementation, the marketers should perform a customer journey analysis to gain some insights about their customers and try to find out/perform:

  1. Length of customer journey.
  2. On an average how many branded and non branded channels (distinct and non-distinct) in a typical customer journey?
  3. Identify most upper funnel and lower funnel channels.
  4. Voucher analysis: within branded and non-branded channels.

When you are done with the analysis and able to answer all of the above questions, the next step would be to define some rules in order to handle the user data according to your business needs. Some of the issues during the implementation are discussed below along with their solution.

Customer journey duration

Assuming that you are a retailer, let’s try to understand this issue with an example. In May 2016, your company started a Fb advertising campaign for a particular product category which “attracted” a lot of customers including Chris. He saw your Fb ad while working in the office and clicked on it, which took him to your website. As soon as he registered on your website, his boss called him (probably because he was on Fb while working), he closed everything and went for the meeting. After coming back, he started working and completely forgot about your ad or products. After a few days, he received an email with some offers of your products which also he ignored until he saw an ad again on TV in Jan 2019 (after 3 years). At this moment, he started doing his research about your products and finally bought one of your products from some Instagram campaign. It took Chris almost 3 years to make his first purchase.

Figure 6: Chris journey

Now, take a minute and think, if you analyse the entire journey of customers like Chris, you would realize that you are still assigning some of the credit to the touchpoints that happened 3 years ago. This can be solved by using an attribution window. Figure 6 illustrates that 83% of the customers are making a purchase within 30 days which means the attribution window here could be 30 days. In simple words, it is safe to remove the touchpoints that happens after 30 days of purchase. This parameter can also be changed to 45 days or 60 days, depending on the use case.

Figure 7: Length of customer journey

Removal of direct marketing channel

A well known issue that every marketing analyst is aware of is, customers who are already aware of the brand usually comes to the website directly. This leads to overestimation of direct channel and branded channels start getting more credit. In this case, you can set a threshold (say 7 days) and remove these branded channels from customer journey.

Figure 8: Removal of branded channels

Cross platform problem

If some of your customers are using different devices to explore your products and you are not able to track them then it will make retargeting really difficult. In a perfect world these customers belong to same journey and if these can’t be combined then, except one, other paths would be considered as “non-converting path”. For attribution problem device could be thought of as a touchpoint to include in the path but to be able to track these customers across all devices would still be challenging. A brief introduction to deterministic and probabilistic ways of cross device tracking can be found here.

Figure 9: Cross platform clash

How to account for Vouchers?

To better account for vouchers, it can be added as a ‘dummy’ touchpoint of the type of voucher (CRM,Social media, Affiliate or Pricing etc.) used. In our case, we tried to add these vouchers as first touchpoint and also as a last touchpoint but no significant difference was found. Also, if the marketing channel of which the voucher was used was already in the path, the dummy touchpoint was not added.

Figure 10: Addition of Voucher as a touchpoint

Let me know in comments if you would like to add something or if you have a different perspective about this use case.

Erstellen und benutzen einer Geodatenbank

In diesem Artikel soll es im Gegensatz zum vorherigen Artikel Alles über Geodaten weniger darum gehen, was man denn alles mit Geodaten machen kann, dafür aber mehr darum wie man dies anstellt. Es wird gezeigt, wie man aus dem öffentlich verfügbaren Datensatz des OpenStreetMap-Projekts eine Geodatenbank erstellt und einige Beispiele dafür gegeben, wie man diese abfragen und benutzen kann.

Wahl der Datenbank

Prinzipiell gibt es zwei große “geo-kompatible” OpenSource-Datenbanken bzw. “Datenbank-AddOn’s”: Spatialite, welches auf SQLite aufbaut, und PostGIS, das PostgreSQL verwendet.

PostGIS bietet zum Teil eine einfachere Syntax, welche manchmal weniger Tipparbeit verursacht. So kann man zum Beispiel um die Entfernung zwischen zwei Orten zu ermitteln einfach schreiben:

während dies in Spatialite “nur” mit einer normalen Funktion möglich ist:

Trotztdem wird in diesem Artikel Spatialite (also SQLite) verwendet, da dessen Einrichtung deutlich einfacher ist (schließlich sollen interessierte sich alle Ergebnisse des Artikels problemlos nachbauen können, ohne hierfür einen eigenen Datenbankserver aufsetzen zu müssen).

Der Hauptunterschied zwischen PostgreSQL und SQLite (eigentlich der Unterschied zwischen SQLite und den meissten anderen Datenbanken) ist, dass für PostgreSQL im Hintergrund ein Server laufen muss, an welchen die entsprechenden Queries gesendet werden, während SQLite ein “normales” Programm (also kein Client-Server-System) ist welches die Queries selber auswertet.

Hierdurch fällt beim Aufsetzen der Datenbank eine ganze Menge an Konfigurationsarbeit weg: Welche Benutzer gibt es bzw. akzeptiert der Server? Welcher Benutzer bekommt welche Rechte? Über welche Verbindung wird auf den Server zugegriffen? Wie wird die Sicherheit dieser Verbindung sichergestellt? …

Während all dies bei SQLite (und damit auch Spatialite) wegfällt und die Einrichtung der Datenbank eigentlich nur “installieren und fertig” ist, muss auf der anderen Seite aber auch gesagt werden dass SQLite nicht gut für Szenarien geeignet ist, in welchen viele Benutzer gleichzeitig (insbesondere schreibenden) Zugriff auf die Datenbank benötigen.

Benötigte Software und ein Beispieldatensatz

Was wird für diesen Artikel an Software benötigt?

SQLite3 als Datenbank

libspatialite als “Geoplugin” für SQLite

spatialite-tools zum erstellen der Datenbank aus dem OpenStreetMaps (*.osm.pbf) Format

python3, die beiden GeoModule spatialite, folium und cartopy, sowie die Module pandas und matplotlib (letztere gehören im Bereich der Datenauswertung mit Python sowieso zum Standart). Für pandas gibt es noch die Erweiterung geopandas sowie eine praktisch unüberschaubare Anzahl weiterer geographischer Module aber bereits mit den genannten lassen sich eine Menge interessanter Dinge herausfinden.

– und natürlich einen Geodatensatz: Zum Beispiel sind aus dem OpenStreetMap-Projekt extrahierte Datensätze hier zu finden.

Es ist ratsam, sich hier erst einmal einen kleinen Datensatz herunterzuladen (wie zum Beispiel einen der Stadtstaaten Bremen, Hamburg oder Berlin). Zum einen dauert die Konvertierung des .osm.pbf-Formats in eine Spatialite-Datenbank bei größeren Datensätzen unter Umständen sehr lange, zum anderen ist die fertige Datenbank um ein vielfaches größer als die stark gepackte Originaldatei (für “nur” Deutschland ist die fertige Datenbank bereits ca. 30 GB groß und man lässt die Konvertierung (zumindest am eigenen Laptop) am besten über Nacht laufen – willkommen im Bereich “BigData”).

Erstellen eine Geodatenbank aus OpenStreetMap-Daten

Nach dem Herunterladen eines Datensatzes der Wahl im *.osm.pbf-Format kann hieraus recht einfach mit folgendem Befehl aus dem Paket spatialite-tools die Datenbank erstellt werden:

Erkunden der erstellten Geodatenbank

Nach Ausführen des obigen Befehls sollte nun eine Datei mit dem gewählten Namen (im Beispiel bremen-latest.sqlite) im aktuellen Ordner vorhanden sein – dies ist bereits die fertige Datenbank. Zunächst sollte man mit dieser Datenbank erst einmal dasselbe machen, wie mit jeder anderen Datenbank auch: Sich erst einmal eine Weile hinsetzen und schauen was alles an Daten in der Datenbank vorhanden und vor allem wo diese Daten in der erstellten Tabellenstruktur zu finden sind. Auch wenn dieses Umschauen prinzipiell auch vollständig über die Shell oder in Python möglich ist, sind hier Programme mit graphischer Benutzeroberfläche (z. B. spatialite-gui oder QGIS) sehr hilfreich und sparen nicht nur eine Menge Zeit sondern vor allem auch Tipparbeit. Wer dies tut, wird feststellen, dass sich in der generierten Datenbank einige dutzend Tabellen mit Namen wie pt_addresses, ln_highway und pg_boundary befinden.

Die Benennung der Tabellen folgt dem Prinzip, dass pt_*-Tabellen Punkte im Geokoordinatensystem wie z. B. Adressen, Shops, Bäckereien und ähnliches enthalten. ln_*-Tabellen enthalten hingegen geographische Entitäten, welche sich als Linien darstellen lassen, wie beispielsweise Straßen, Hochspannungsleitungen, Schienen, ect. Zuletzt gibt es die pg_*-Tabellen welche Polygone – also Flächen einer bestimmten Form enthalten. Dazu zählen Landesgrenzen, Bundesländer, Inseln, Postleitzahlengebiete, Landnutzung, aber auch Gebäude, da auch diese jeweils eine Grundfläche besitzen. In dem genannten Datensatz sind die Grundflächen von Gebäuden – zumindest in Europa – nahezu vollständig. Aber auch der Rest der Welt ist für ein “Wikipedia der Kartographie” insbesondere in halbwegs besiedelten Gebieten bemerkenswert gut erfasst, auch wenn nicht unbedingt davon ausgegangen werden kann, dass abgelegenere Gegenden (z. B. irgendwo auf dem Land in Südamerika) jedes Gebäude eingezeichnet ist.

Verwenden der Erstellten Datenbank

Auf diese Datenbank kann nun entweder direkt aus der Shell über den Befehl

zugegriffen werden oder man nutzt das gleichnamige Python-Paket:

Nach Eingabe der obigen Befehle in eine Python-Konsole, ein Jupyter-Notebook oder ein anderes Programm, welches die Anbindung an den Python-Interpreter ermöglicht, können die von der Datenbank ausgegebenen Ergebnisse nun direkt in ein Pandas Data Frame hineingeladen und verwendet/ausgewertet/analysiert werden.

Im Grunde wird hierfür “normales SQL” verwendet, wie in anderen Datenbanken auch. Der folgende Beispiel gibt einfach die fünf ersten von der Datenbank gefundenen Adressen aus der Tabelle pt_addresses aus:

Link zur Ausgabe

Es wird dem Leser sicherlich aufgefallen sein, dass die Spalte “Geometry” (zumindest für das menschliche Auge) nicht besonders ansprechend sowie auch nicht informativ aussieht: Der Grund hierfür ist, dass diese Spalte die entsprechende Position im geographischen Koordinatensystem aus Gründen wie dem deutlich kleineren Speicherplatzbedarf sowie der damit einhergehenden Optimierung der Geschwindigkeit der Datenbank selber, in binärer Form gespeichert und ohne weitere Verarbeitung auch als solche ausgegeben wird.

Glücklicherweise stellt spatialite eine ganze Reihe von Funktionen zur Verarbeitung dieser geographischen Informationen bereit, von denen im folgenden einige beispielsweise vorgestellt werden:

Für einzelne Punkte im Koordinatensystem gibt es beispielsweise die Funktionen X(geometry) und Y(geometry), welche aus diesem “binären Wirrwarr” den Längen- bzw. Breitengrad des jeweiligen Punktes als lesbare Zahlen ausgibt.

Ändert man also das obige Query nun entsprechend ab, erhält man als Ausgabe folgendes Ergebnis in welchem die Geometry-Spalte der ausgegebenen Adressen in den zwei neuen Spalten Longitude und Latitude in lesbarer Form zu finden ist:

Link zur Tabelle

Eine weitere häufig verwendete Funktion von Spatialite ist die Distance-Funktion, welche die Distanz zwischen zwei Orten berechnet.

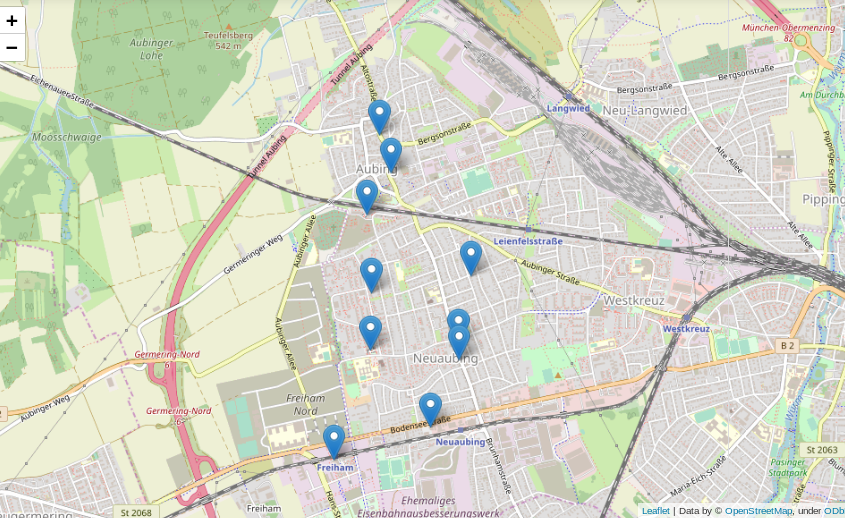
Das folgende Beispiel sucht in der Datenbank die 10 nächstgelegenen Bäckereien zu einer frei wählbaren Position aus der Datenbank und listet diese nach zunehmender Entfernung auf (Achtung – die frei wählbare Position im Beispiel liegt in München, wer die selbe Position z. B. mit dem Bremen-Datensatz verwendet, wird vermutlich etwas weiter laufen müssen…):

Link zur Ausgabe

Ein Anwendungsfall für eine solche Liste können zum Beispiel Programme/Apps wie maps.me oder Google-Maps sein, in denen User nach Bäckereien, Geldautomaten, Supermärkten oder Apotheken “in der Nähe” suchen können sollen.

Diese Liste enthält nun alle Informationen die grundsätzlich gebraucht werden, ist soweit auch informativ und wird in den meißten Fällen der Datenauswertung auch genau so gebraucht, jedoch ist diese für das Auge nicht besonders ansprechend.

Viel besser wäre es doch, die gefundenen Positionen auf einer interaktiven Karte einzuzeichnen:

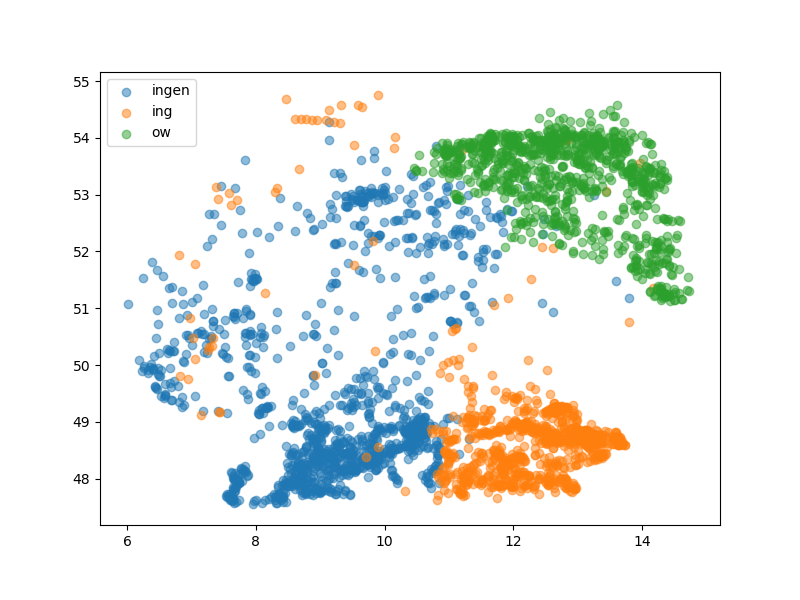
Was kann man sonst interessantes mit der erstellten Datenbank und etwas Python machen? Wer in Deutschland ein wenig herumgekommen ist, dem ist eventuell aufgefallen, dass sich die Endungen von Ortsnamen stark unterscheiden: Um München gibt es Stadteile und Dörfer namens Garching, Freising, Aubing, ect., rund um Stuttgart enden alle möglichen Namen auf “ingen” (Plieningen, Vaihningen, Echterdingen …) und in Berlin gibt es Orte wie Pankow, Virchow sowie eine bunte Auswahl weiterer *ow’s.

Das folgende Query spuckt gibt alle “village’s”, “town’s” und “city’s” aus der Tabelle pt_place, also Dörfer und Städte, aus:

Link zur Ausgabe

Graphisch mit matplotlib und cartopy in ein Koordinatensystem eingetragen sieht diese Verteilung folgendermassen aus:

Die Grafik zeigt, dass stark unterschiedliche Vorkommen der verschiedenen Ortsendungen in Deutschland (Clustering). Über das genaue Zustandekommen dieser Verteilung kann ich hier nur spekulieren, jedoch wird diese vermutlich ähnlichen Prozessen unterliegen wie beispielsweise die Entwicklung von Dialekten.

Wer sich die Karte etwas genauer anschaut wird merken, dass die eingezeichneten Landesgrenzen und Küstenlinien nicht besonders genau sind. Hieran wird ein interessanter Effekt von häufig verwendeten geographischen Entitäten, nämlich Linien und Polygonen deutlich. Im Beispiel werden durch die beiden Zeilen

die bereits im Modul cartopy hinterlegten Daten verwendet. Genaue Verläufe von Küstenlinien und Landesgrenzen benötigen mit wachsender Genauigkeit hingegen sehr viel Speicherplatz, da mehr und mehr zu speichernde Punkte benötigt werden (genaueres siehe hier).

Schlussfolgerung

Man kann also bereits mit einigen Grundmodulen und öffentlich verfügbaren Datensätzen eine ganze Menge im Bereich der Geodaten erkunden und entdecken. Gleichzeitig steht, insbesondere für spezielle Probleme, eine große Bandbreite weiterer Software zur Verfügung, für welche dieser Artikel zwar einen Grundsätzlichen Einstieg geben kann, die jedoch den Rahmen dieses Artikels sprengen würden.

Training eines Neurons mit dem Gradientenverfahren

Dies ist Artikel 3 von 6 der Artikelserie –Einstieg in Deep Learning.

Das Training von neuronalen Netzen erfolgt nach der Forward-Propagation über zwei Schritte:

  1. Fehler-Rückführung über aller aktiver Neuronen aller Netz-Schichten, so dass jedes Neuron “seinen” Einfluss auf den Ausgabefehler kennt.
  2. Anpassung der Gewichte entgegen den Gradienten der Fehlerfunktion

Beide Schritte werden in der Regel zusammen als Backpropagation bezeichnet. Machen wir erstmal einen Schritt vor und betrachten wir, wie ein Neuron seine Gewichtsverbindungen zu seinen Vorgängern anpasst.

Gradientenabstiegsverfahren

Der Gradientenabstieg ist ein generalisierbarer Algorithmus zur Optimierung, der in vielen Verfahren des maschinellen Lernens zur Anwendung kommt, jedoch ganz besonders als sogenannte Backpropagation im Deep Learning den Erfolg der künstlichen neuronalen Netze erst möglich machen konnte.

Der Gradientenabstieg lässt sich vom Prinzip her leicht erklären: Angenommen, man stünde im Gebirge im dichten Nebel. Das Tal, und somit der Weg nach Hause, ist vom Nebel verdeckt. Wohin laufen wir? Wir können das Ziel zwar nicht sehen, tasten uns jedoch so heran, dass unser Gehirn den Gradienten (den Unterschied der Höhen beider Füße) berechnet, somit die Steigung des Bodens kennt und sich entgegen dieser Steigung unser Weg fortsetzt.

Konkret funktioniert der Gradientenabstieg so: Wir starten bei einem zufälligen Theta \theta (Random Initialization). Wir berechnen die Ausgabe (Forwardpropogation) und vergleichen sie über eine Verlustfunktion (z. B. über die Funktion Mean Squared Error) mit dem tatsächlich korrekten Wert. Auf Grund der zufälligen Initialisierung haben wir eine nahe zu garantierte Falschheit der Ergebnisse und somit einen Verlust. Für die Verlustfunktion berechnen wir den Gradienten für gegebene Eingabewerte. Voraussetzung dafür ist, dass die Funktion ableitbar ist. Wir bewegen uns entgegen des Gradienten in Richtung Minimum der Verlustfunktion. Ist dieses Minimum (fast) gefunden, spricht man auch davon, dass der Lernalgorithmus konvergiert.

Das Gradientenabstiegsverfahren ist eine Möglichkeit der Gradientenverfahren, denn wollten wir maximieren, würden wir uns entlang des Gradienten bewegen, was in anderen Anwendungen sinnvoll ist.

Ob als “Cost Function” oder als “Loss Function” bezeichnet, in jedem Fall ist es eine “Error Function”, aber auf die Benennung kommen wir später zu sprechen. Jedenfalls versuchen wir die Fehlerrate zu senken! Leider sind diese Funktionen in der Praxis selten so einfach konvex (zwei Berge mit einem Tal dazwischen).


Aber Achtung: Denn befinden wir uns nur zwischen zwei Bergen, finden wir das Tal mit Sicherheit über den Gradienten. Befinden wir uns jedoch in einem richtigen Gebirge mit vielen Bergen und Tälern, gilt es, das richtige Tal zu finden. Bei der Optimierung der Gewichtungen von künstlichen neuronalen Netzen wollen wir die besten Gewichtungen finden, die uns zu den geringsten Ausgaben der Verlustfunktion führen. Wir suchen also das globale Minimum unter den vielen (lokalen) Minima.

Programmier-Beispiel in Python

Nachfolgend ein Beispiel des Gradientenverfahrens zur Berechnung einer Regression. Wir importieren numpy und matplotlib.pyplot und erzeugen uns künstliche Datenpunkte:

Nun wollen wir einen Lernalgorithmus über das Gradientenverfahren erstellen. Im Grunde haben wir hier es bereits mit einem linear aktivierten Neuron zutun:

Bei der linearen Regression, die wir durchführen wollen, nehmen wir zwei-dimensionale Daten (wobei wir die Regression prinzipiell auch mit x-Dimensionen durchführen können, dann hätte unser Neuron weitere Eingänge). Wir empfangen einen Bias (w_0
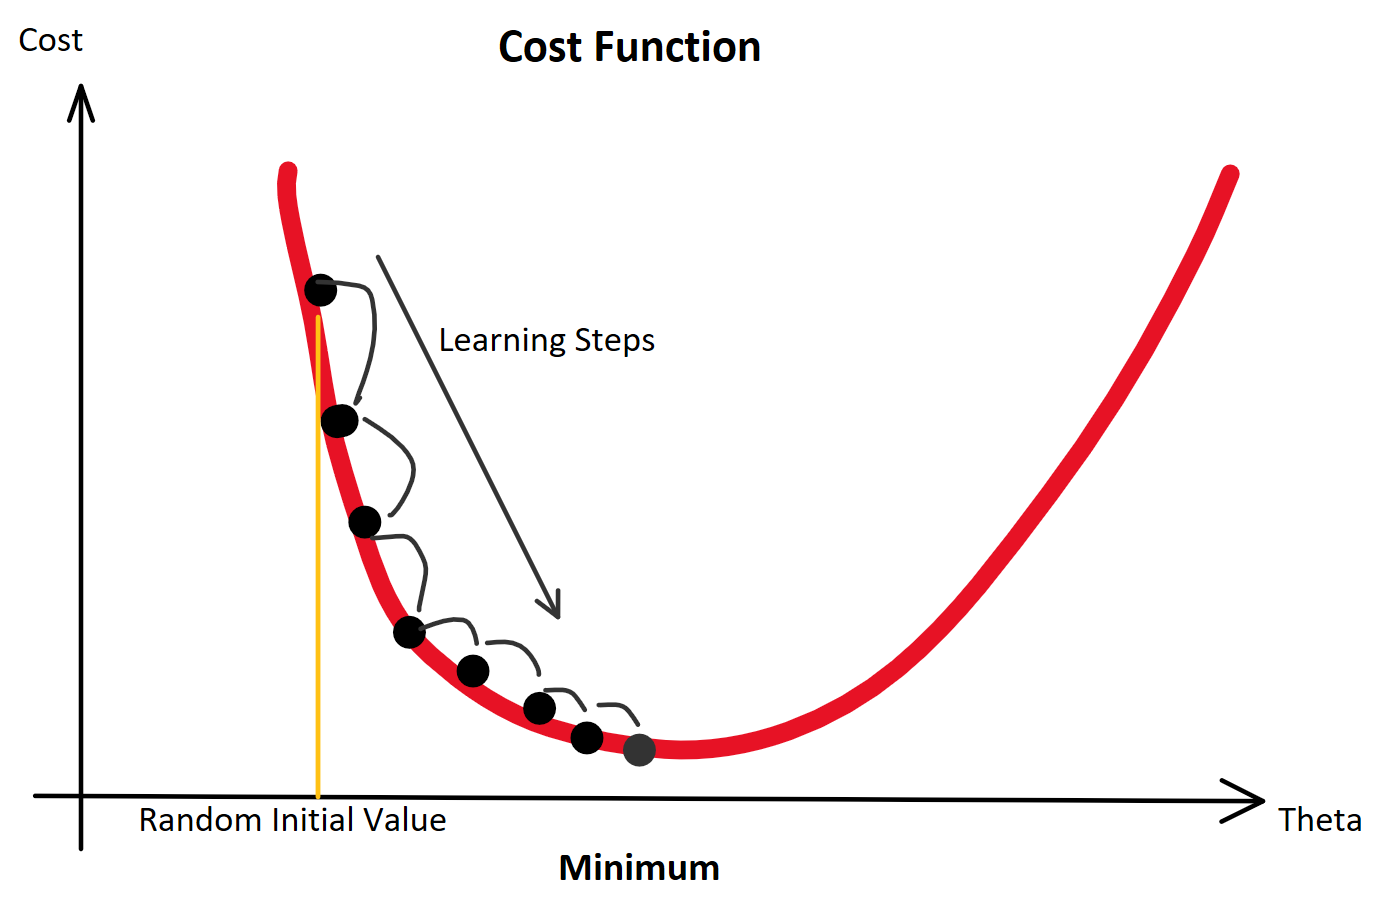
) der stets mit einer Eingangskonstante multipliziert und somit als Wert erhalten bleibt. Der Bias ist das Alpha \alpha in einer Schulmathe-tauglichen Formel wie y = \beta \cdot x + \alpha.

Beta \beta ist die Steigung, der Gradient, der Funktion.

Sowohl \alpha als auch \beta sind uns unbekannt, versuchen wir jedoch über die Betrachtung unserer Prädiktion durch Berechnung der Formel \^y = \beta \cdot x + \alpha und den darauffolgenden Abgleich mit dem tatsächlichen y herauszufinden. Anfangs behaupten wir beispielsweise einfach, sowohl \beta als auch \alpha seien 0.00. Folglich wird \^y = \beta \cdot x + \alpha ebenfalls gleich 0.00 sein und die Fehlerfunktion (Loss Function) wird maximal sein. Dies war der erste Durchlauf des Trainings, die sogenannte erste Epoche!

Die Epochen (Durchläufe) und dazugehörige Fehlergrößen. Wenn die Fehler sinken und mit weiteren Epochen nicht mehr wesentlich besser werden, heißt es, das der Lernalogorithmus konvergiert.

Als Fehlerfunktion verwenden wir bei der Regression die MSE-Funktion (Mean Squared Error):

MSE = \sum(\^y_i - y_i)^2

Um diese Funktion wird sich nun alles drehen, denn diese beschreibt den Fehler und gibt uns auch die Auskunft darüber, ob wie stark und in welche Richtung sie ansteigt, so dass wir uns entgegen der Steigung bewegen können. Wer die Regeln der Ableitung im Kopf hat, weiß, dass die Ableitung der Formel leichter wird, wenn wir sie vorher auf halbe Werte runterskalieren. Da die Proportionen dabei erhalten bleiben und uns quadrierte Fehlerwerte unserem menschlichen Verstand sowieso nicht so viel sagen (unser Gehirn denkt nunmal nicht exponential), stört das nicht:

MSE = \frac{\frac{1}{2} \cdot \sum(\^y_i - y_i)^2}{n}

MSE = \frac{\frac{1}{2} \cdot \sum(w^T \cdot x_i - y_i)^2}{n}

Wenn die Mathematik der partiellen Ableitung (Ableitung einer Funktion nach jedem Gradienten) abhanden gekommen ist, bitte nochmal folgende Regeln nachschlagen, um die nachfolgende Ableitung verstehen zu können:

  • Allgemeine partielle Ableitung
  • Kettenregel

Ableitung der MSD-Funktion nach dem einen Gewicht w 
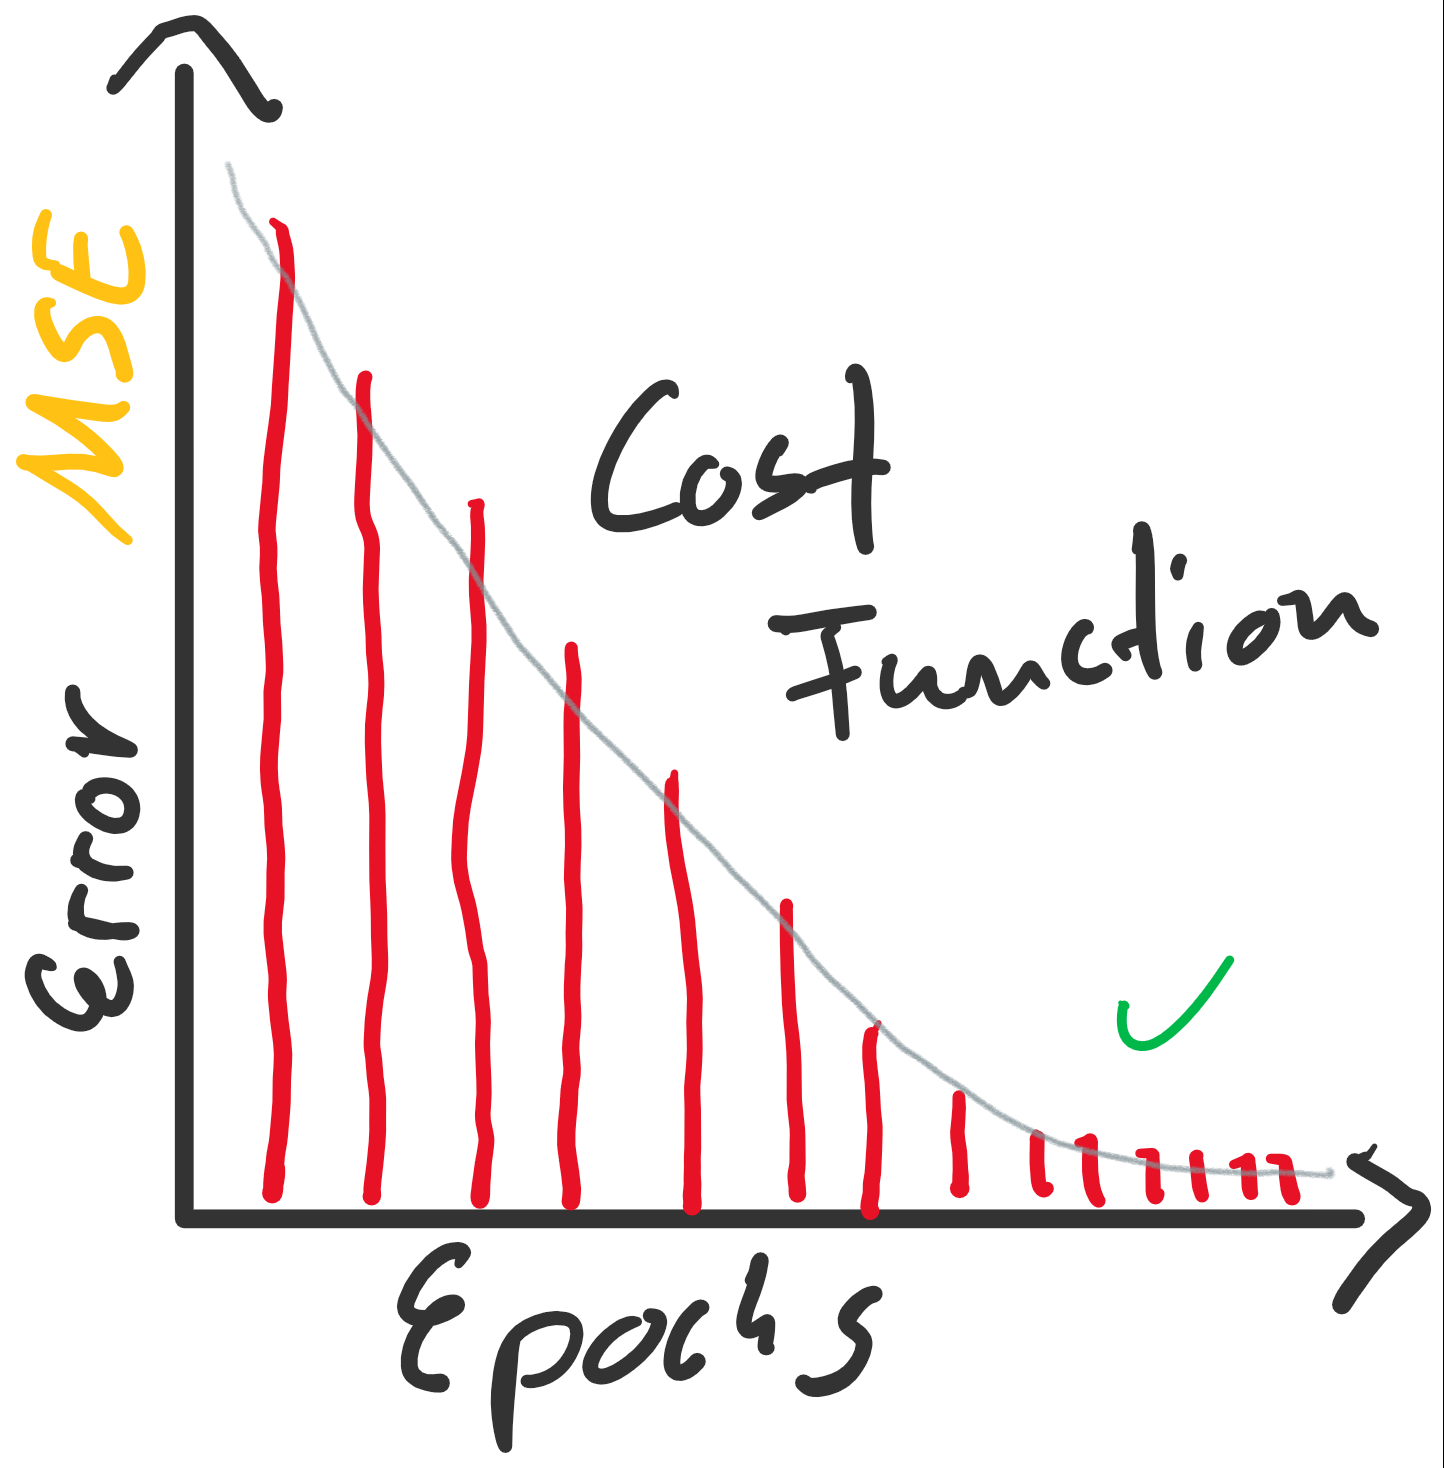
bzw. partiell nach jedem vorhandenen w_j:

\frac{\partial}{\partial w_j}MSE = \frac{\partial}{\partial w} \frac{1}{2} \cdot \sum(\^y - y_i)^2

\frac{\partial}{\partial w_j}MSE = \frac{\partial}{\partial w} \frac{1}{2} \cdot \sum(w^T \cdot x_i - y_i)^2

\frac{\partial}{\partial w_j}MSE = \frac{2}{n} \cdot \sum(w^T \cdot x_i - y_i) \cdot x_{ij}

Woher wir das x_{ij} am Ende her haben? Das ergibt sie aus der Kettenregel: Die äußere Funktion wurde abgeleitet, so wurde aus \frac{1}{2} \cdot \sum(w^T \cdot x_i - y_i)^2 dann \frac{2}{n} \cdot \sum(w^T \cdot x_i - y_i). Jedoch muss im Sinne eben dieser Kettenregel auch die innere Funktion abgeleitet werden. Da wir nach w_j ableiten, bleibt nur x_ij erhalten.

Damit können wir arbeiten! So kompliziert ist die Formel nun auch wieder nicht: \frac{2}{n} \cdot \sum(w^T \cdot x_i - y_i) \cdot x_{ij}

Mit dieser Formel können wir unsere Gewichte an den Fehler anpassen: (f\nabla ist der Gradient der Funktion!)
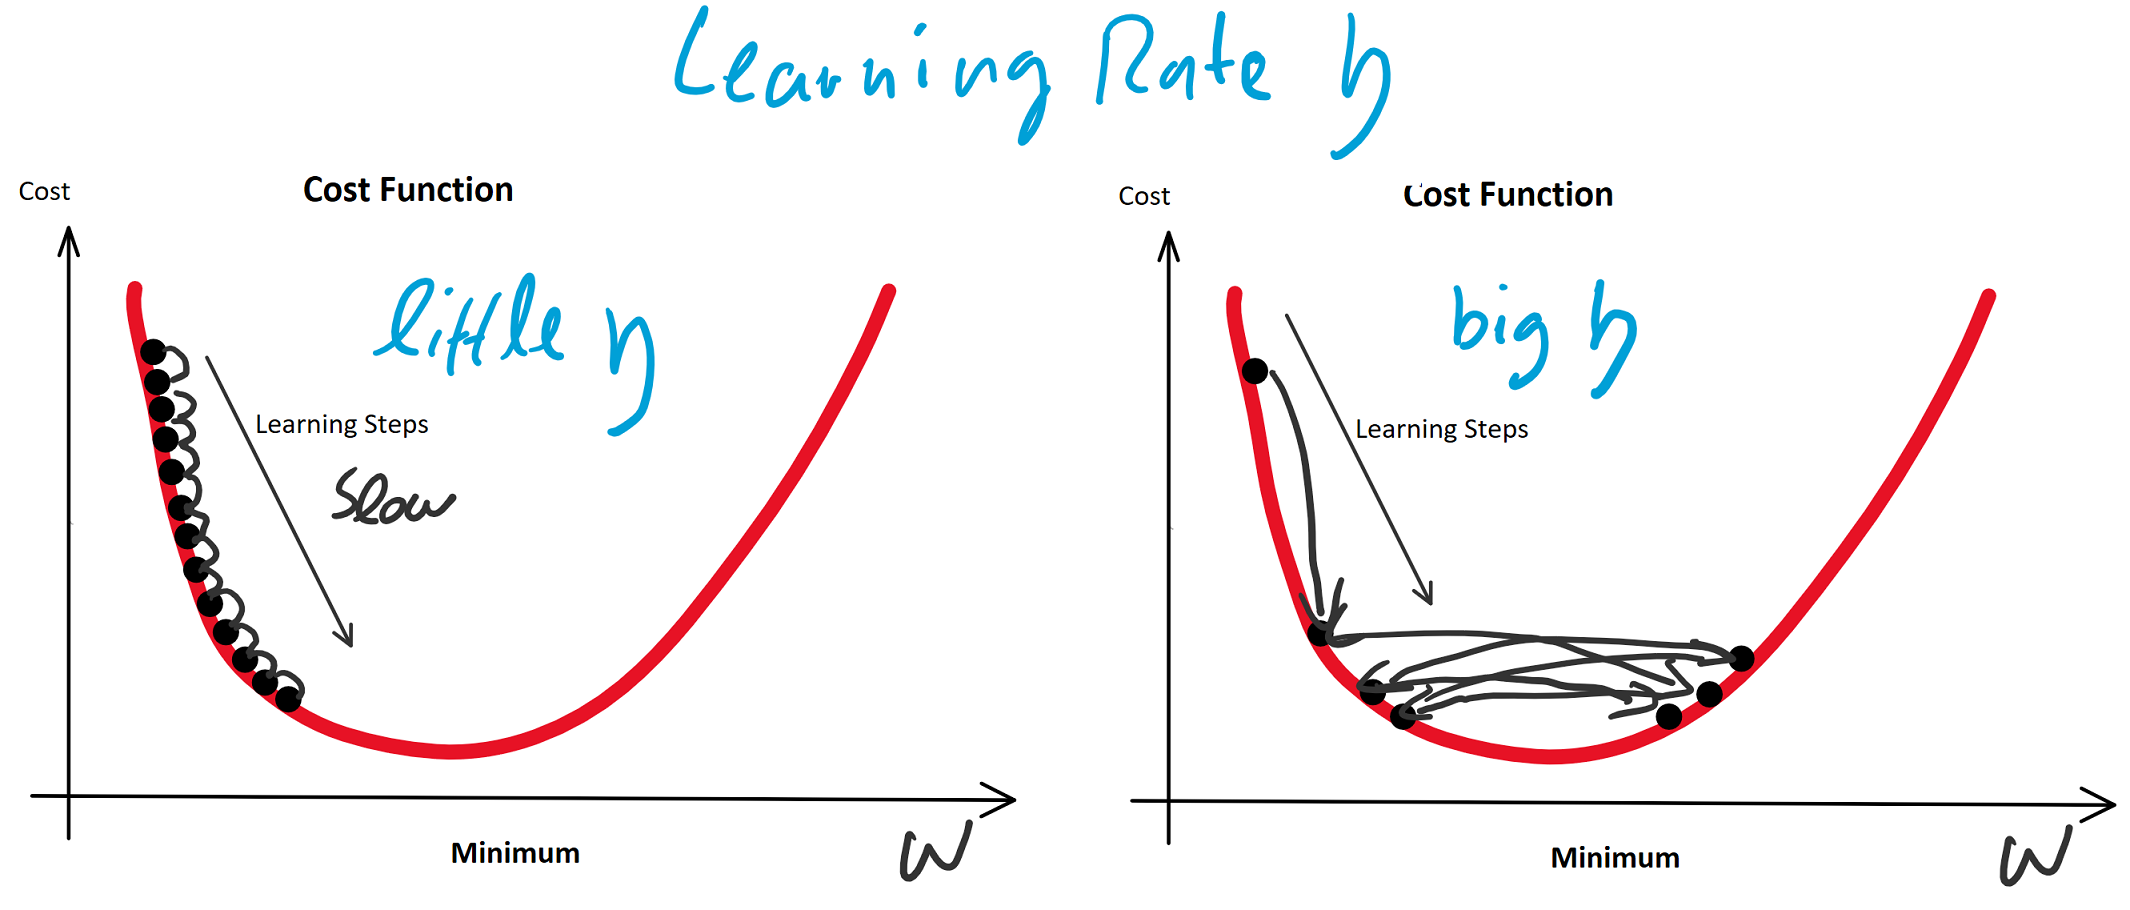
w_j = w_j - \nabla MSE(w_j)

Initialisieren der Gewichtungen

Die Gewichtungen \alpha und \beta müssen anfänglich mit Werten initialisiert werden. In der Regression bietet es sich an, die Gewichte anfänglich mit 0.00 zu initialisieren.

Bei vielen neuronalen Netzen, mit nicht-linearen Aktivierungsfunktionen, ist das jedoch eher ungünstig und zufällige Werte sind initial besser. Gut erprobt sind normal-verteilte Zufallswerte.

Lernrate

Nur eine Kleinigkeit haben wir bisher vergessen: Wir brauchen einen Faktor, mit dem wir anpassen. Hier wäre der Faktor 1. Das ist in der Regel viel zu groß. Dieser Faktor wird geläufig als Lernrate (Learning Rate) \eta (eta) bezeichnet:

w_j = w_j - \eta \cdot \nabla MSE(w_j)

Die Lernrate \eta ist ein Knackpunkt und der erste Parameter des Lernalgorithmus, den es anzupassen gilt, wenn das Training nicht konvergiert.

Die Lernrate \eta darf nicht zu groß klein gewählt werden, da das Training sonst zu viele Epochen benötigt. Ungeduldige erhöhen die Lernrate möglicherweise aber so sehr, dass der Lernalgorithmus im Minimum der Fehlerfunktion vorbeiläuft und diesen stets überspringt. Hier würde der Algorithmus also sozusagen konvergieren, weil nicht mehr besser werden, aber das resultierende Modell wäre weit vom Optimum entfernt.

Beginnen wir mit der Implementierung als Python-Klasse:

Die Klasse sollte so funktionieren, bevor wir sie verwenden, sollten wir die Input-Werte standardisieren:

Bei diesem Beispiel mit künstlich erzeugten Werten ist das Standardisieren bzw. das Fehlen des Standardisierens zwar nicht kritisch, aber man sollte es sich zur Gewohnheit machen. Testweise es einfach mal weglassen 🙂

Kommen wir nun zum Einsatz der Klasse, die die Regression via Gradientenabstieg absolvieren soll:

Was tut diese Instanz der Klasse LinearRegressionGD nun eigentlich?

Bildlich gesprochen, legt sie eine Gerade auf den Boden des Koordinatensystems, denn die Gewichtungen werden mit 0.00 initialisiert, y ist also gleich 0.00, egal welche Werte in x 
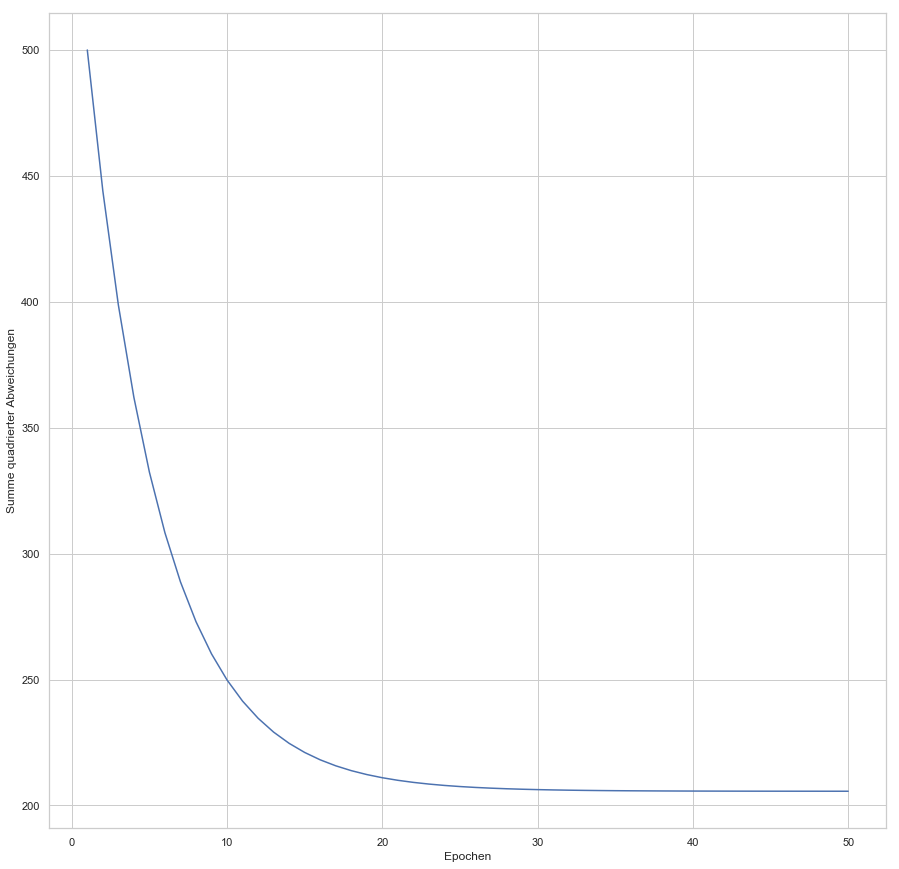
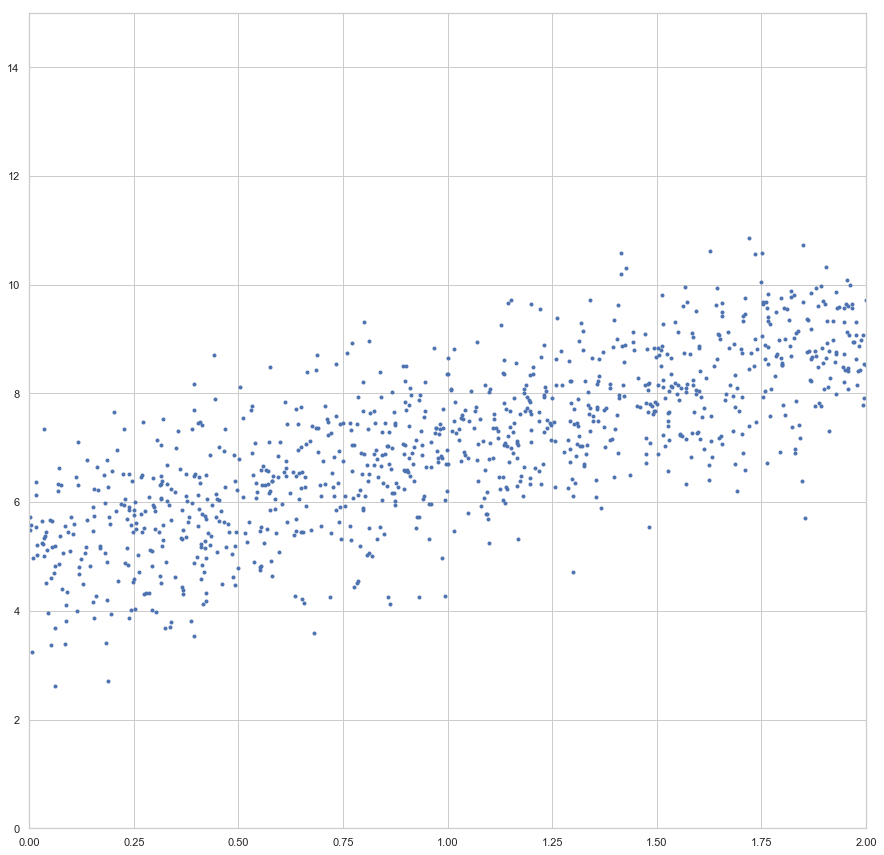
enthalten sind. Der Fehler ist dann aber sehr groß (sollte maximal sein, im Vergleich zu zukünftigen Epochen). Die Gewichte werden also angepasst, die Gerade somit besser in die Punktwolke platziert. Mit jeder Epoche wird die Gerade erneut in die Punktwolke gelegt, der Gesamtfehler (über alle
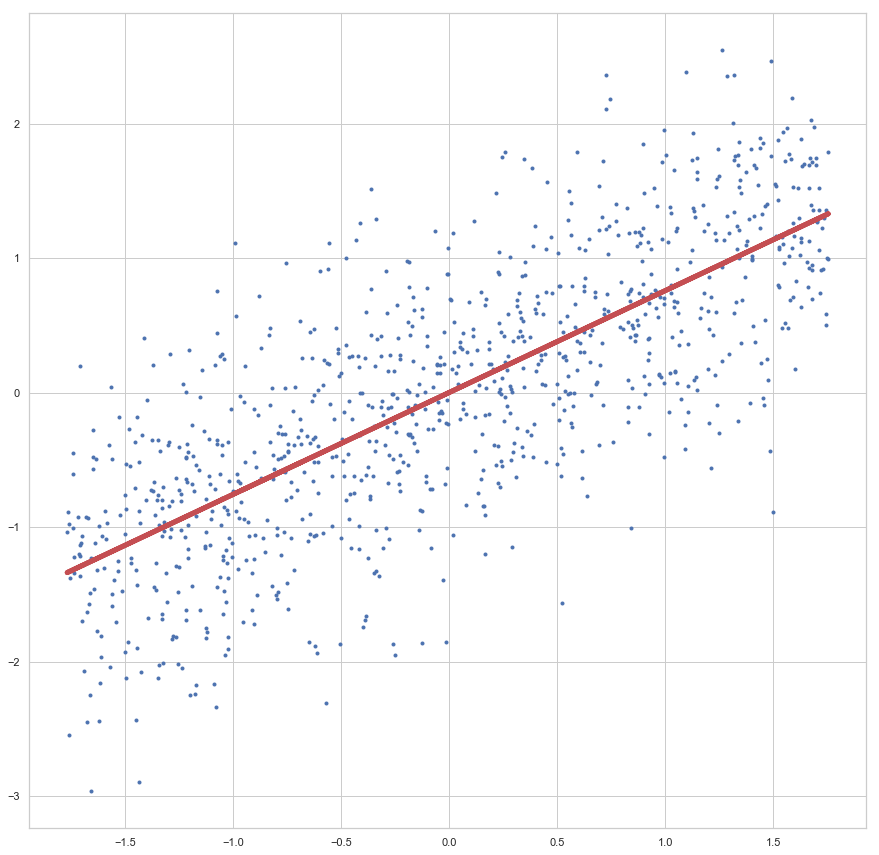
 x, da wir es hier mit dem Batch-Verfahren zutun haben) berechnet, die Werte angepasst… bis die vorgegebene Zahl an Epochen abgelaufen ist.

Schauen wir uns das Ergebnis des Trainings an:

Die Linie sieht passend aus, oder? Da wir hier nicht zu sehr in die Theorie der Regressionsanalyse abdriften möchten, lassen wir das testen und prüfen der Akkuratesse mal aus, hier möchte ich auf meinen Artikel Regressionsanalyse in Python mit Scikit-Learn verweisen.

Prüfen sollten wir hingegen mal, wie schnell der Lernalgorithmus mit der vorgegebenen Lernrate eta konvergiert:

Hier die Verlaufskurve der Cost Function:

Die Kurve zeigt uns, dass spätestens nach 40 Epochen kaum noch Verbesserung (im Sinne der Gesamtfehler-Minimierung) erreicht wird.

Wichtige Hinweise

Natürlich war das nun nur ein erster kleiner Einstieg und wer es verstanden hat, hat viel gewonnen. Denn erst dann kann man sich vorstellen, wie ein einzelnen Neuron eines künstlichen neuronalen Netzes grundsätzlich trainiert werden kann.

Folgendes sollte noch beachtet werden:

  • Lernrate \eta:
    Die Lernrate ist ein wichtiger Parameter. Wer das Programmier-Beispiel bei sich zum Laufen gebracht hat, einfach mal die Lernrate auf Werte zwischen 10.00 und 0.00000001 setzen, schauen was passiert 🙂
  • Globale Minima vs lokale Minima:
    Diese lineare zwei-dimensionale Regression ist ziemlich einfach. Neuronale Netze sind hingegen komplexer und haben nicht einfach nur eine simple konvexe Fehlerfunktion. Hier gibt es mehrere Hügel und Täler in der Fehlerfunktion und die Gefahr ist groß, in einem lokalen, nicht aber in einem globalen Minimum zu landen.
  • Stochastisches Gradientenverfahren:
    Wir haben hier das sogenannte Batch-Verfahren verwendet. Dieses ist grundsätzlich besser als die stochastische Methode. Denn beim Batch verwenden wir den gesamten Stapel an x-Werten für die Fehlerbestimmung. Allerdings ist dies bei großen Daten zu rechen- und speicherintensiv. Dann werden kleinere Unter-Stapel (Sub-Batches) zufällig aus den x-Werten ausgewählt, der Fehler daraus bestimmt (was nicht ganz so akkurat ist, wie als würden wir den Fehler über alle x berechnen) und der Gradient bestimmt. Dies ist schon Rechen- und Speicherkapazität, erfordert aber meistens mehr Epochen.

Buchempfehlung

Die folgenden zwei Bücher haben mir bei der Erstellung dieses Beispiels geholfen und kann ich als hilfreiche und deutlich weiterführende Lektüre empfehlen:


Machine Learning mit Python und Scikit-Learn und TensorFlow: Das umfassende Praxis-Handbuch für Data Science, Predictive Analytics und Deep Learning (mitp Professional) Hands-On Machine Learning with Scikit-Learn and TensorFlow: Concepts, Tools, and Techniques for Building Intelligent Systems