Visual Question Answering with Keras – Part 1
This is Part I of II of the Article Series Visual Question Answering with Keras
Making Computers Intelligent to answer from images
 If we look closer in the history of Artificial Intelligence (AI), the Deep Learning has gained more popularity in the recent years and has achieved the human-level performance in the tasks such as Speech Recognition, Image Classification, Object Detection, Machine Translation and so on. However, as humans, not only we but also a five-year child can normally perform these tasks without much inconvenience. But the development of such systems with these capabilities has always considered an ambitious goal for the researchers as well as for developers.
In this series of blog posts, I will cover an introduction to something called VQA (Visual Question Answering), its available datasets, the Neural Network approach for VQA and its implementation in Keras and the applications of this challenging problem in real life.
Table of Contents:
1 Introduction
2 What is exactly Visual Question Answering?
3 Prerequisites
4 Datasets available for VQA
4.1 DAQUAR Dataset
4.2 CLEVR Dataset
4.3 FigureQA Dataset
4.4 VQA Dataset
5 Real-life applications of VQA
6 Conclusion
- Introduction:
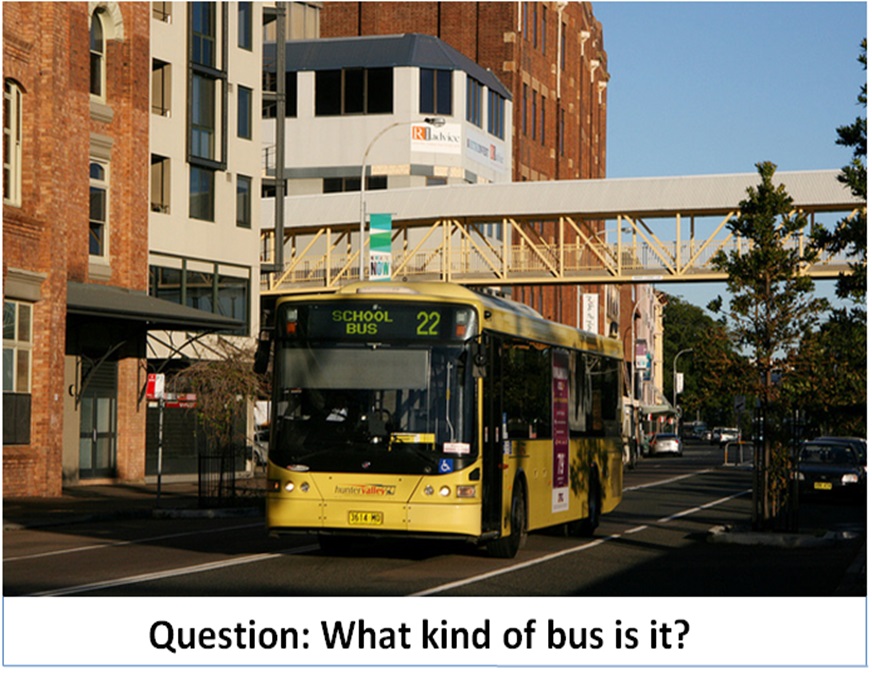
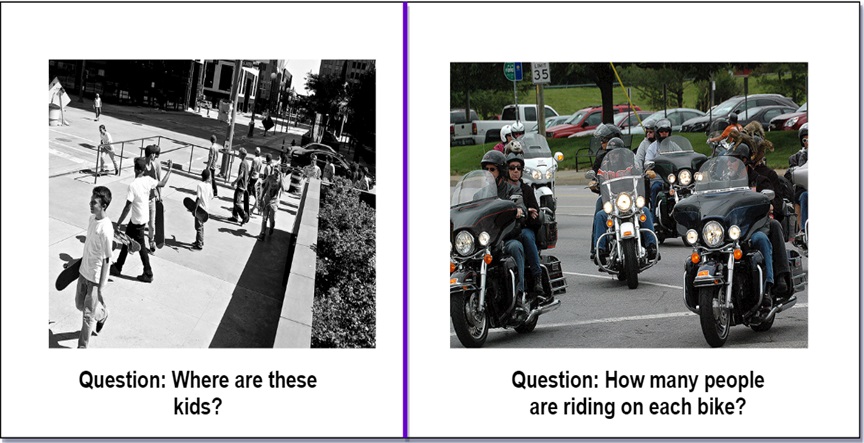
Let’s say you are given a below picture along with one question. Can you answer it?
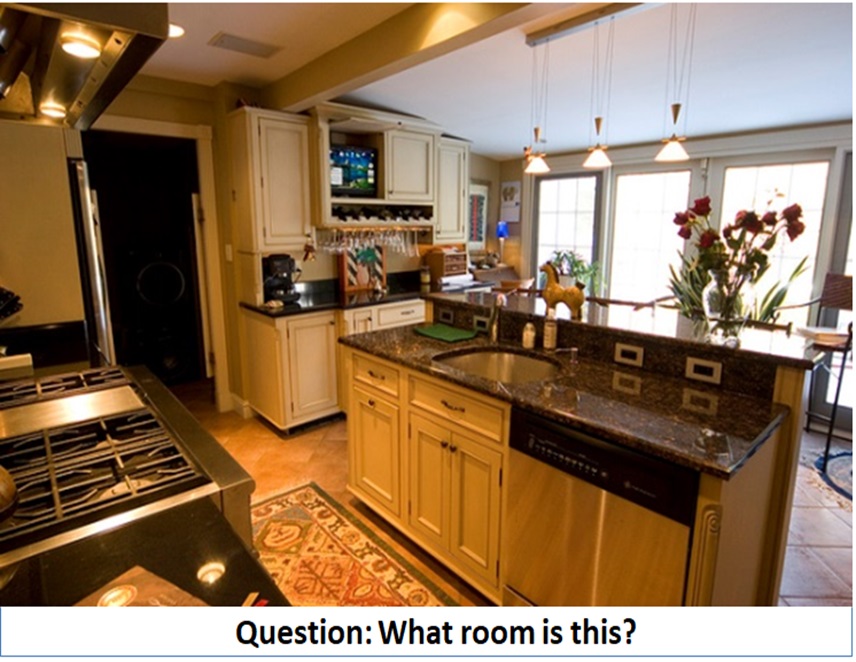
I expect confidently you all say it is the Kitchen without much inconvenience which is also the right answer. Even a five-year child who just started to learn things might answer this question correctly.
Alright, but can you write a computer program for such type of task that takes image and question about the image as an input and gives us answer as output?
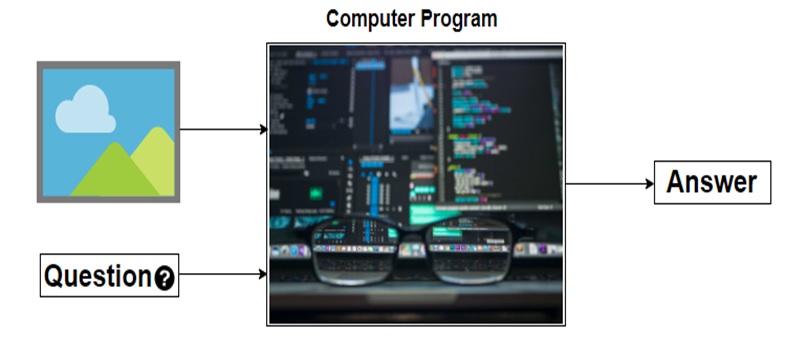
Before the development of the Deep Neural Network, this problem was considered as one of the difficult, inconceivable and challenging problem for the AI researcher’s community. However, due to the recent advancement of Deep Learning the systems are capable of answering these questions with the promising result if we have a required dataset.
Now I hope you have got at least some intuition of a problem that we are going to discuss in this series of blog posts. Let’s try to formalize the problem in the below section.
- What is exactly Visual Question Answering?:
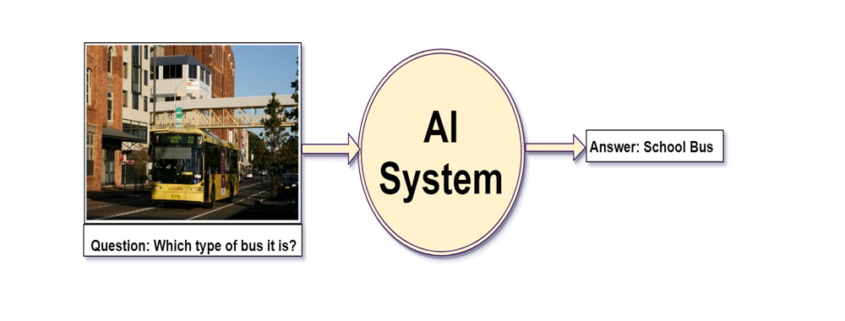
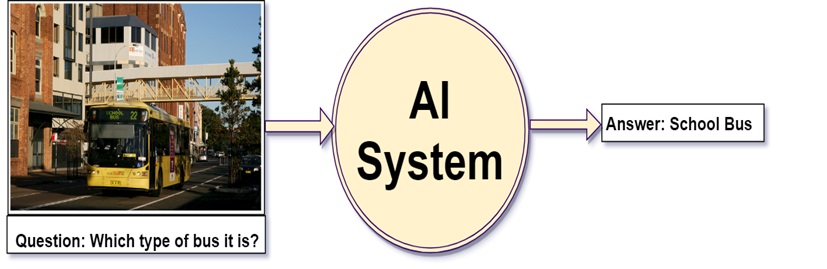
We can define, “Visual Question Answering(VQA) is a system that takes an image and natural language question about the image as an input and generates natural language answer as an output.”
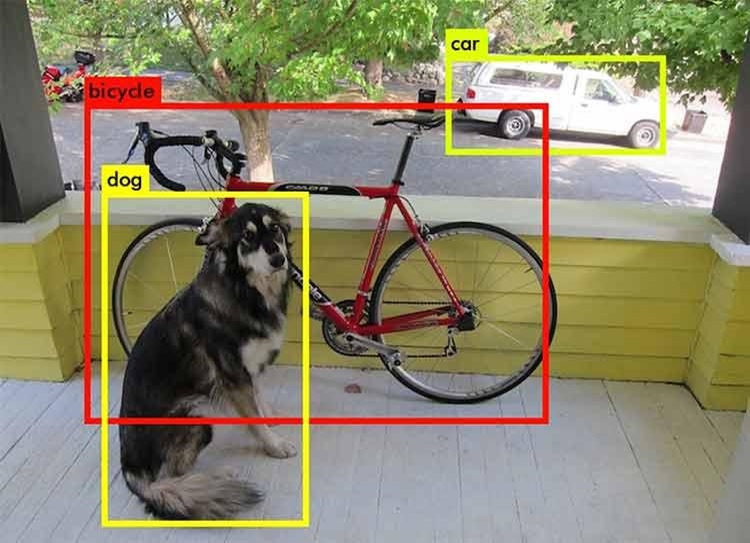
VQA is a research area that requires an understanding of vision(Computer Vision) as well as text(NLP). The main beauty of VQA is that the reasoning part is performed in the context of the image. So if we have an image with the corresponding question then the system must able to understand the image well in order to generate an appropriate answer. For example, if the question is the number of persons then the system must able to detect faces of the persons. To answer the color of the horse the system need to detect the objects in the image. Many of these common problems such as face detection, object detection, binary object classification(yes or no), etc. have been solved in the field of Computer Vision with good results.
To summarize a good VQA system must be able to address the typical problems of CV as well as NLP.
To get a better feel of VQA you can try online VQA demo by CloudCV. You just go to this link and try uploading the picture you want and ask the related question to the picture, the system will generate the answer to it.
- Prerequisites:
In the next post, I will walk you through the code for this problem using Keras. So I assume that you are familiar with:
- Fundamental concepts of Machine Learning
- Multi-Layered Perceptron
- Convolutional Neural Network
- Recurrent Neural Network (especially LSTM)
- Gradient Descent and Backpropagation
- Transfer Learning
- Hyperparameter Optimization
- Python and Keras syntax
- Datasets available for VQA:
As you know problems related to the CV or NLP the availability of the dataset is the key to solve the problem. The complex problems like VQA, the dataset must cover all possibilities of questions answers in real-world scenarios. In this section, I will cover some of the datasets available for VQA.
4.1 DAQUAR Dataset:
The DAQUAR dataset is the first dataset for VQA that contains only indoor scenes. It shows the accuracy of 50.2% on the human baseline. It contains images from the NYU_Depth dataset.
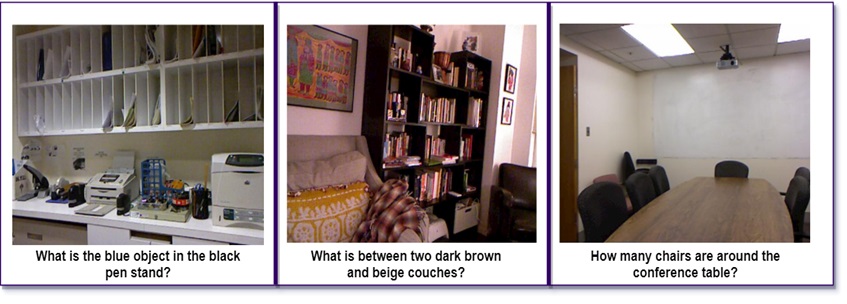
Example of DAQUAR dataset
The main disadvantage of DAQUAR is the size of the dataset is very small to capture all possible indoor scenes.
4.2 CLEVR Dataset:
The CLEVR Dataset from Stanford contains the questions about the object of a different type, colors, shapes, sizes, and material.
It has
- A training set of 70,000 images and 699,989 questions
- A validation set of 15,000 images and 149,991 questions
- A test set of 15,000 images and 14,988 questions
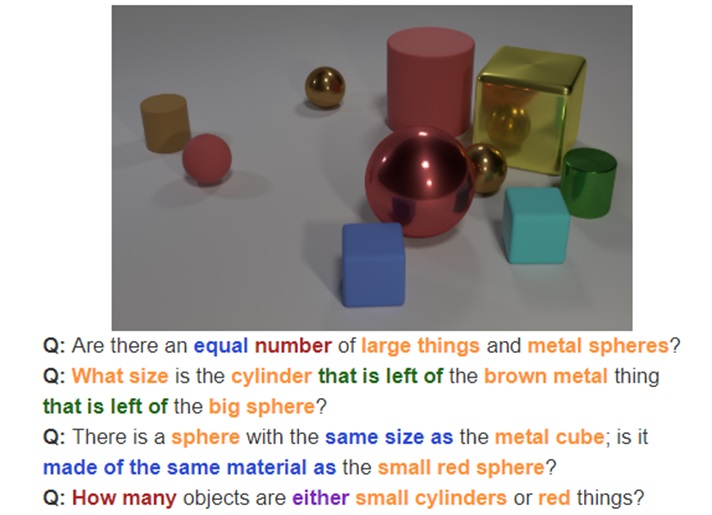
Image Source: https://cs.stanford.edu/people/jcjohns/clevr/?source=post_page
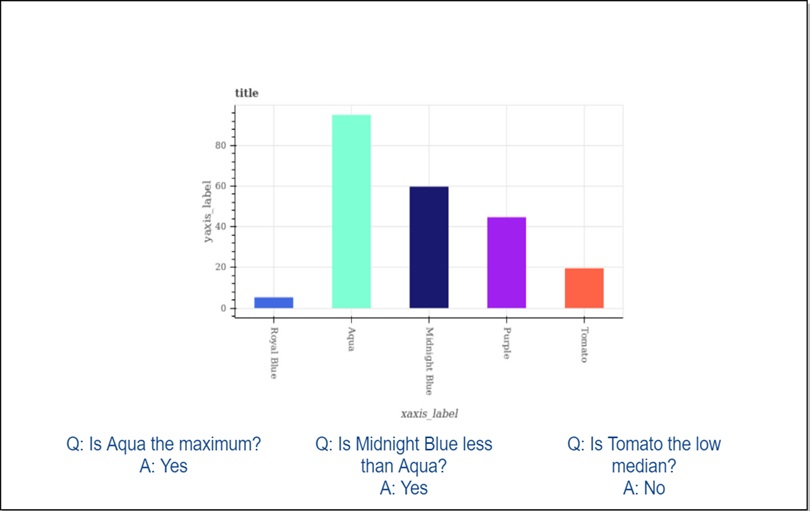
4.3 FigureQA Dataset:
FigureQA Dataset contains questions about the bar graphs, line plots, and pie charts. It has 1,327,368 questions for 100,000 images in the training set.
4.4 VQA Dataset:
As comapred to all datasets that we have seen so far VQA dataset is relatively larger. The VQA dataset contains open ended as well as multiple choice questions. VQA v2 dataset contains:
- 82,783 training images from COCO (common objects in context) dataset
- 40, 504 validation images and 81,434 validation images
- 443,757 question-answer pairs for training images
- 214,354 question-answer pairs for validation images.
As you might expect this dataset is very huge and contains 12.6 GB of training images only. I have used this dataset in the next post but a very small subset of it.
This dataset also contains abstract cartoon images. Each image has 3 questions and each question has 10 multiple choice answers.
- Real-life applications of VQA:
There are many applications of VQA. One of the famous applications is to help visually impaired people and blind peoples. In 2016, Microsoft has released the “Seeing AI” app for visually impaired people to describe the surrounding environment around them. You can watch this video for the prototype of the Seeing AI app.
Another application could be on social media or e-commerce sites. VQA can be also used for educational purposes.
- Conclusion:
I hope this explanation will give you a good idea of Visual Question Answering. In the next blog post, I will walk you through the code in Keras.
If you like my explanations, do provide some feedback, comments, etc. and stay tuned for the next post.