Must-have Skills to Master Data Science

The need to process a massive amount of data sets is making Data Science the most-demanded job across diverse industry verticals. In today’s times, organizations are actively looking for Data Scientists.

But What does a Data Scientist do?

Data Scientist design data models, create various algorithms to extract the data the organization needs, and then they analyze the gathered data and communicate the data insights with the business stakeholders.

If you are looking forward to pursuing a career in Data Science, then this blog is for you 🙂

Data Scientists often come from many different educational and work experience backgrounds but few skills are common and essential.

Let’s have a look at all the essential skills required to become a Data Scientist:

  1. Multivariable Calculus & Linear Algebra
  2. Probability & Statistics
  3. Programming Skills (Python & R)
  4. Machine Learning Algorithms
  5. Data Visualization
  6. Data Wrangling
  7. Data Intuition

Let’s dive deeper into all these skills one by one.

Multivariable Calculus & Linear Algebra:

Having a solid understanding of math concepts is very helpful for a Data Scientist.

Key Concepts:

  • Matrices
  • Linear Algebra Functions
  • Derivatives and Gradient
  • Relational Algebra

Probability & Statistics:

Probability and Statistics play a major role in Data Science for estimation and prediction purposes.

Key concepts required:

  • Probability Distributions
  • Conditional Probability
  • Bayesian Thinking
  • Descriptive Statistics
  • Random Variables
  • Hypothesis Testing and Regression
  • Maximum Likelihood Estimation

Programming Skills (Python & R):

Python :

Start with Python Fundamentals using a jupyter notebook, which comes pre-packaged with Python libraries.

Important Python Libraries used:

  • NumPy (For Data Exploration)
  • Pandas (For Data Exploration)
  • Matplotlib (For Data Visualization)

R:

It is a programming language and software environment used for statistical computing and graphics. 

Key Concepts required:

  • R Languages fundamentals and basic syntax
  • Vectors, Matrices, Factors
  • Data frames
  • Basic Graphics

Machine Learning Algorithms

Machine Learning is an innovative and essential field in the industry. There are quite a few algorithms out there, major ones are as follows –

  • Linear Regression
  • Logistic Regression
  • Decision Trees
  • Random Forest
  • Naïve Bayes
  • Support Vector Machines
  • Dimensionality Reduction
  • K-means
  • Artificial Neural Networks

Data Visualization:

Data visualization is very essential when it comes to analyzing a massive amount of information and data. 

To make data-driven decisions, data visualization tools, and technologies are essential in the world of Data Science.

Data Visualization tools:

  • Tableau
  • Microsoft Power Bi
  • E Charts
  • Datawrapper
  • HighCharts

Data Wrangling:

Data wrangling, this term refers to the process of cleaning and refining the messy and complex data available into a more usable format. 

It is considered one of the most crucial parts of working with data.

Important Steps to Data Wrangling:

  1. Discovering
  2. Structuring
  3. Cleaning
  4. Enriching
  5. Validating
  6. Documenting

Tools used:

  • Tabula
  • Google DataPrep
  • Data Wrangler
  • CSVkit

Data Wrangling can be done using Python and R.

Data Intuition:

Data Intuition in Data Science is an intuitive understanding of concepts. It’s one of the most significant skills required to become a Data Scientist.

It’s about recognizing patterns where none are observable on the surface.

This is something that you need to develop. It is a skill that will only come with experience.

A Data Scientist should know which Data Science methods to apply to the problem at hand.

Conclusion:

 As you can see, all these skills – from programming to algorithmic methods, work with one another to build on top of each other for gathering deeper data insights.

There are a wide number of courses available online for developing these skills and to help you become a true talent in this data industry.

Sure, this journey isn’t an easy one to follow but it’s not impossible. With sheer determination and consistency, you will be able to cross all the hurdles in your Data Science career path.

Sechs Eigenschaften einer modernen Business Intelligence

Völlig unabhängig von der Branche, in der Sie tätig sind, benötigen Sie Informationssysteme, die Ihre geschäftlichen Daten auswerten, um Ihnen Entscheidungsgrundlagen zu liefern. Diese Systeme werden gemeinläufig als sogenannte Business Intelligence (BI) bezeichnet. Tatsächlich leiden die meisten BI-Systeme an Mängeln, die abstellbar sind. Darüber hinaus kann moderne BI Entscheidungen teilweise automatisieren und umfassende Analysen bei hoher Flexibilität in der Nutzung ermöglichen.


english-flagRead this article in English:
“Six properties of modern Business Intelligence”


Lassen Sie uns die sechs Eigenschaften besprechen, die moderne Business Intelligence auszeichnet, die Berücksichtigungen von technischen Kniffen im Detail bedeuten, jedoch immer im Kontext einer großen Vision für die eigene Unternehmen-BI stehen:

1.      Einheitliche Datenbasis von hoher Qualität (Single Source of Truth)

Sicherlich kennt jeder Geschäftsführer die Situation, dass sich seine Manager nicht einig sind, wie viele Kosten und Umsätze tatsächlich im Detail entstehen und wie die Margen pro Kategorie genau aussehen. Und wenn doch, stehen diese Information oft erst Monate zu spät zur Verfügung.

In jedem Unternehmen sind täglich hunderte oder gar tausende Entscheidungen auf operative Ebene zu treffen, die bei guter Informationslage in der Masse sehr viel fundierter getroffen werden können und somit Umsätze steigern und Kosten sparen. Demgegenüber stehen jedoch viele Quellsysteme aus der unternehmensinternen IT-Systemlandschaft sowie weitere externe Datenquellen. Die Informationsbeschaffung und -konsolidierung nimmt oft ganze Mitarbeitergruppen in Anspruch und bietet viel Raum für menschliche Fehler.

Ein System, das zumindest die relevantesten Daten zur Geschäftssteuerung zur richtigen Zeit in guter Qualität in einer Trusted Data Zone als Single Source of Truth (SPOT) zur Verfügung stellt. SPOT ist das Kernstück moderner Business Intelligence.

Darüber hinaus dürfen auch weitere Daten über die BI verfügbar gemacht werden, die z. B. für qualifizierte Analysen und Data Scientists nützlich sein können. Die besonders vertrauenswürdige Zone ist jedoch für alle Entscheider diejenige, über die sich alle Entscheider unternehmensweit synchronisieren können.

2.      Flexible Nutzung durch unterschiedliche Stakeholder

Auch wenn alle Mitarbeiter unternehmensweit auf zentrale, vertrauenswürdige Daten zugreifen können sollen, schließt das bei einer cleveren Architektur nicht aus, dass sowohl jede Abteilung ihre eigenen Sichten auf diese Daten erhält, als auch, dass sogar jeder einzelne, hierfür qualifizierte Mitarbeiter seine eigene Sicht auf Daten erhalten und sich diese sogar selbst erstellen kann.

Viele BI-Systeme scheitern an der unternehmensweiten Akzeptanz, da bestimmte Abteilungen oder fachlich-definierte Mitarbeitergruppen aus der BI weitgehend ausgeschlossen werden.

Moderne BI-Systeme ermöglichen Sichten und die dafür notwendige Datenintegration für alle Stakeholder im Unternehmen, die auf Informationen angewiesen sind und profitieren gleichermaßen von dem SPOT-Ansatz.

3.      Effiziente Möglichkeiten zur Erweiterung (Time to Market)

Bei den Kernbenutzern eines BI-Systems stellt sich die Unzufriedenheit vor allem dann ein, wenn der Ausbau oder auch die teilweise Neugestaltung des Informationssystems einen langen Atem voraussetzt. Historisch gewachsene, falsch ausgelegte und nicht besonders wandlungsfähige BI-Systeme beschäftigen nicht selten eine ganze Mannschaft an IT-Mitarbeitern und Tickets mit Anfragen zu Änderungswünschen.

Gute BI versteht sich als Service für die Stakeholder mit kurzer Time to Market. Die richtige Ausgestaltung, Auswahl von Software und der Implementierung von Datenflüssen/-modellen sorgt für wesentlich kürzere Entwicklungs- und Implementierungszeiten für Verbesserungen und neue Features.

Des Weiteren ist nicht nur die Technik, sondern auch die Wahl der Organisationsform entscheidend, inklusive der Ausgestaltung der Rollen und Verantwortlichkeiten – von der technischen Systemanbindung über die Datenbereitstellung und -aufbereitung bis zur Analyse und dem Support für die Endbenutzer.

4.      Integrierte Fähigkeiten für Data Science und AI

Business Intelligence und Data Science werden oftmals als getrennt voneinander betrachtet und geführt. Zum einen, weil Data Scientists vielfach nur ungern mit – aus ihrer Sicht – langweiligen Datenmodellen und vorbereiteten Daten arbeiten möchten. Und zum anderen, weil die BI in der Regel bereits als traditionelles System im Unternehmen etabliert ist, trotz der vielen Kinderkrankheiten, die BI noch heute hat.

Data Science, häufig auch als Advanced Analytics bezeichnet, befasst sich mit dem tiefen Eintauchen in Daten über explorative Statistik und Methoden des Data Mining (unüberwachtes maschinelles Lernen) sowie mit Predictive Analytics (überwachtes maschinelles Lernen). Deep Learning ist ein Teilbereich des maschinellen Lernens (Machine Learning) und wird ebenfalls für Data Mining oder Predictvie Analytics angewendet. Bei Machine Learning handelt es sich um einen Teilbereich der Artificial Intelligence (AI).

In der Zukunft werden BI und Data Science bzw. AI weiter zusammenwachsen, denn spätestens nach der Inbetriebnahme fließen die Prädiktionsergebnisse und auch deren Modelle wieder in die Business Intelligence zurück. Vermutlich wird sich die BI zur ABI (Artificial Business Intelligence) weiterentwickeln. Jedoch schon heute setzen viele Unternehmen Data Mining und Predictive Analytics im Unternehmen ein und setzen dabei auf einheitliche oder unterschiedliche Plattformen mit oder ohne Integration zur BI.

Moderne BI-Systeme bieten dabei auch Data Scientists eine Plattform, um auf qualitativ hochwertige sowie auf granularere Rohdaten zugreifen zu können.

5.      Ausreichend hohe Performance

Vermutlich werden die meisten Leser dieser sechs Punkte schon einmal Erfahrung mit langsamer BI gemacht haben. So dauert das Laden eines täglich zu nutzenden Reports in vielen klassischen BI-Systemen mehrere Minuten. Wenn sich das Laden eines Dashboards mit einer kleinen Kaffee-Pause kombinieren lässt, mag das hin und wieder für bestimmte Berichte noch hinnehmbar sein. Spätestens jedoch bei der häufigen Nutzung sind lange Ladezeiten und unzuverlässige Reports nicht mehr hinnehmbar.

Ein Grund für mangelhafte Performance ist die Hardware, die sich unter Einsatz von Cloud-Systemen bereits beinahe linear skalierbar an höhere Datenmengen und mehr Analysekomplexität anpassen lässt. Der Einsatz von Cloud ermöglicht auch die modulartige Trennung von Speicher und Rechenleistung von den Daten und Applikationen und ist damit grundsätzlich zu empfehlen, jedoch nicht für alle Unternehmen unbedingt die richtige Wahl und muss zur Unternehmensphilosophie passen.

Tatsächlich ist die Performance nicht nur von der Hardware abhängig, auch die richtige Auswahl an Software und die richtige Wahl der Gestaltung von Datenmodellen und Datenflüssen spielt eine noch viel entscheidender Rolle. Denn während sich Hardware relativ einfach wechseln oder aufrüsten lässt, ist ein Wechsel der Architektur mit sehr viel mehr Aufwand und BI-Kompetenz verbunden. Dabei zwingen unpassende Datenmodelle oder Datenflüsse ganz sicher auch die neueste Hardware in maximaler Konfiguration in die Knie.

6.      Kosteneffizienter Einsatz und Fazit

Professionelle Cloud-Systeme, die für BI-Systeme eingesetzt werden können, bieten Gesamtkostenrechner an, beispielsweise Microsoft Azure, Amazon Web Services und Google Cloud. Mit diesen Rechnern – unter Einweisung eines erfahrenen BI-Experten – können nicht nur Kosten für die Nutzung von Hardware abgeschätzt, sondern auch Ideen zur Kostenoptimierung kalkuliert werden. Dennoch ist die Cloud immer noch nicht für jedes Unternehmen die richtige Lösung und klassische Kalkulationen für On-Premise-Lösungen sind notwendig und zudem besser planbar als Kosten für die Cloud.

Kosteneffizienz lässt sich übrigens auch mit einer guten Auswahl der passenden Software steigern. Denn proprietäre Lösungen sind an unterschiedliche Lizenzmodelle gebunden und können nur über Anwendungsszenarien miteinander verglichen werden. Davon abgesehen gibt es jedoch auch gute Open Source Lösungen, die weitgehend kostenfrei genutzt werden dürfen und für viele Anwendungsfälle ohne Abstriche einsetzbar sind.

Die Total Cost of Ownership (TCO) gehören zum BI-Management mit dazu und sollten stets im Fokus sein. Falsch wäre es jedoch, die Kosten einer BI nur nach der Kosten für Hardware und Software zu bewerten. Ein wesentlicher Teil der Kosteneffizienz ist komplementär mit den Aspekten für die Performance des BI-Systems, denn suboptimale Architekturen arbeiten verschwenderisch und benötigen mehr und teurere Hardware als sauber abgestimmte Architekturen. Die Herstellung der zentralen Datenbereitstellung in adäquater Qualität kann viele unnötige Prozesse der Datenaufbereitung ersparen und viele flexible Analysemöglichkeiten auch redundante Systeme direkt unnötig machen und somit zu Einsparungen führen.

In jedem Fall ist ein BI für Unternehmen mit vielen operativen Prozessen grundsätzlich immer günstiger als kein BI zu haben. Heutzutage könnte für ein Unternehmen nichts teurer sein, als nur nach Bauchgefühl gesteuert zu werden, denn der Markt tut es nicht und bietet sehr viel Transparenz.

Dennoch sind bestehende BI-Architekturen hin und wieder zu hinterfragen. Bei genauerem Hinsehen mit BI-Expertise ist die Kosteneffizienz und Datentransparenz häufig möglich.

Process Mining Tools – Artikelserie

Process Mining ist nicht länger nur ein Buzzword, sondern ein relevanter Teil der Business Intelligence. Process Mining umfasst die Analyse von Prozessen und lässt sich auf alle Branchen und Fachbereiche anwenden, die operative Prozesse haben, die wiederum über operative IT-Systeme erfasst werden. Um die zunehmende Bedeutung dieser Data-Disziplin zu verstehen, reicht ein Blick auf die Entwicklung der weltweiten Datengenerierung an. Waren es 2010 noch 2 Zettabytes (ZB), sind laut Statista für das Jahr 2020 mehr als 50 ZB an Daten zu erwarten. Für 2025 wird gar mit einem Bestand von 175 ZB gerechnet.

Hier wird das Datenvolumen nach Jahren angezeit

Abbildung 1 zeigt die Entwicklung des weltweiten Datenvolumen (Stand 2018). Quelle: https://www.statista.com/statistics/871513/worldwide-data-created/

Warum jetzt eigentlich Process Mining?

Warum aber profitiert insbesondere Process Mining von dieser Entwicklung? Der Grund liegt in der Unordnung dieser Datenmenge. Die Herausforderung der sich viele Unternehmen gegenübersehen, liegt eben genau in der Analyse dieser unstrukturierten Daten. Hinzu kommt, dass nahezu jeder Prozess Datenspuren in Informationssystemen hinterlässt. Die Betrachtung von Prozessen auf Datenebene birgt somit ein enormes Potential, welches in Anbetracht der Entwicklung zunehmend an Bedeutung gewinnt.

Was war nochmal Process Mining?

Process Mining ist eine Analysemethodik, welche dazu befähigt, aus den abgespeicherten Datenspuren der Informationssysteme eine Rekonstruktion der realen Prozesse zu schaffen. Diese Prozesse können anschließend als Prozessflussdiagramm dargestellt und ausgewertet werden. Die klassischen Anwendungsfälle reichen von dem Aufspüren (Discovery) unbekannter Prozesse, über einen Soll-Ist-Vergleich (Conformance) bis hin zur Anpassung/Verbesserung (Enhancement) bestehender Prozesse. Mittlerweile setzen viele Firmen darüber hinaus auf eine Integration von RPA und Data Science im Process Mining. Und die Analyse-Tiefe wird zunehmen und bis zur Analyse einzelner Klicks reichen, was gegenwärtig als sogenanntes „Task Mining“ bezeichnet wird.

Hier wird ein typischer Process Mining Workflow dargestellt

Abbildung 2 zeigt den typischen Workflow eines Process Mining Projektes. Oftmals dient das ERP-System als zentrale Datenquelle. Die herausgearbeiteten Event-Logs werden anschließend mittels Process Mining Tool visualisiert.

In jedem Fall liegt meistens das Gros der Arbeit auf die Bereitstellung und Vorbereitung der Daten und der Transformation dieser in sogenannte „Event-Logs“, die den Input für die Process Mining Tools darstellen. Deshalb arbeiten viele Anbieter von Process Mining Tools schon länger an Lösungen, um die mit der Datenvorbereitung verbundenen zeit -und arbeitsaufwendigen Schritte zu erleichtern. Während fast alle Tool-Anbieter vorgefertigte Protokolle für Standardprozesse anbieten, gehen manche noch weiter und bieten vollumfängliche Plattform Lösungen an, welche eine effiziente Integration der aufwendigen ETL-Prozesse versprechen. Der Funktionsumfang der Process Mining Tools geht daher mittlerweile deutlich über eine reine Darstellungsfunktion hinaus und deckt ggf. neue Trends sowie optimierte Einsteigerbarrieren mit ab.

Motivation dieser Artikelserie

Die Motivation diesen Artikel zu schreiben liegt nicht in der Erläuterung der Methode des Process Mining. Hierzu gibt es mittlerweile zahlreiche Informationsquellen. Eine besonders empfehlenswerte ist das Buch „Process Mining“ von Will van der Aalst, einem der Urväter des Process Mining. Die Motivation dieses Artikels liegt viel mehr in der Betrachtung der zahlreichen Process Mining Tools am Markt. Sehr oft erlebe ich als Data-Consultant, dass Process Mining Projekte im Vorfeld von der Frage nach dem „besten“ Tool dominiert werden. Diese Fragestellung ist in Ihrer Natur sicherlich immer individuell zu beantworten. Da individuelle Projekte auch einen individuellen Tool-Einsatz bedingen, beschäftige ich mich meist mit einem großen Spektrum von Process Mining Tools. Daher ist es mir in dieser Artikelserie ein Anliegen einen allgemeingültigen Überblick zu den üblichen Process Mining Tools zu erarbeiten. Dabei möchte ich mich nicht auf persönliche Erfahrungen stützen, sondern die Tools anhand von Testdaten einem praktischen Vergleich unterziehen, der für den Leser nachvollziehbar ist.

Um den Umfang der Artikelserie zu begrenzen, werden die verschiedenen Tools nur in Ihren Kernfunktionen angewendet und verglichen. Herausragende Funktionen oder Eigenschaften der jeweiligen Tools werden jedoch angemerkt und ggf. in anderen Artikeln vertieft. Das Ziel dieser Artikelserie soll sein, dem Leser einen ersten Einblick über die am Markt erhältlichen Tools zu geben. Daher spricht dieser Artikel insbesondere Einsteiger aber auch Fortgeschrittene im Process Mining an, welche einen Überblick über die Tools zu schätzen wissen und möglicherweise auch mal über den Tellerand hinweg schauen mögen.

Die Tools

Die Gruppe der zu betrachteten Tools besteht aus den folgenden namenhaften Anwendungen:

Die Auswahl der Tools orientiert sich an den „Market Guide for Process Mining 2019“ von Gartner. Aussortiert habe ich jene Tools, mit welchen ich bisher wenig bis gar keine Berührung hatte. Diese Auswahl an Tools verspricht meiner Meinung nach einen spannenden Einblick von verschiedene Process Mining Tools am Markt zu bekommen.

Die Anwendung in der Praxis

Um die Tools realistisch miteinander vergleichen zu können, werden alle Tools die gleichen Datengrundlage benutzen. Die Datenbasis wird folglich über die gesamte Artikelserie hinweg für die Darstellungen mit den Tools genutzt. Ich werde im nächsten Artikel explizit diese Datenbasis kurz erläutern.

Das Ziel der praktischen Untersuchung soll sein, die Beispieldaten in die verschiedenen Tools zu laden, um den enthaltenen Prozess zu visualisieren. Dabei möchte ich insbesondere darauf achten wie bedienbar und anpassungsfähig/flexibel die Tools mir erscheinen. An dieser Stelle möchte ich eindeutig darauf hinweisen, dass dieser Vergleich und seine Bewertung meine Meinung ist und keineswegs Anspruch auf Vollständigkeit beansprucht. Da der Markt in Bewegung ist, behalte ich mir ferner vor, diese Artikelserie regelmäßig anzupassen.

Die Kriterien

Neben der Bedienbarkeit und der Anpassungsfähigkeit der Tools möchte ich folgende zusätzliche Gesichtspunkte betrachten:

  • Bedienbarkeit: Wie leicht gehen die Analysen von der Hand? Wie einfach ist der Einstieg?
  • Anpassungsfähigkeit: Wie flexibel reagiert das Tool auf meine Daten und Analyse-Wünsche?
  • Integrationsfähigkeit: Welche Schnittstellen bringt das Tool mit? Läuft es auch oder nur in der Cloud?
  • Skalierbarkeit: Ist das Tool dazu in der Lage, auch große und heterogene Daten zu verarbeiten?
  • Zukunftsfähigkeit: Wie steht es um Machine Learning, ETL-Modeller oder Task Mining?
  • Preisgestaltung: Nach welchem Modell bestimmt sich der Preis?

Die Datengrundlage

Die Datenbasis bildet ein Demo-Datensatz der von Celonis für die gesamte Artikelserie netter Weise zur Verfügung gestellt wurde. Dieser Datensatz bildet einen Versand Prozess vom Zeitpunkt des Kaufes bis zur Auslieferung an den Kunden ab. In der folgenden Abbildung ist der Soll Prozess abgebildet.

Hier wird die Variante 1 der Demo Daten von Celonis als Grafik dargestellt

Abbildung 4 zeigt den gewünschten Versand Prozess der Datengrundlage von dem Kauf des Produktes bis zur Auslieferung.

Die Datengrundlage besteht aus einem 60 GB großen Event-Log, welcher lokal in einer Microsoft SQL Datenbank vorgehalten wird. Da diese Tabelle über 600 Mio. Events beinhaltet, wird die Datengrundlage für die Analyse der einzelnen Tools auf einen Ausschnitt von 60 Mio. Events begrenzt. Um die Performance der einzelnen Tools zu testen, wird jedoch auf die gesamte Datengrundlage zurückgegriffen. Der Ausschnitt der Event-Log Tabelle enthält 919 verschiedene Varianten und weisst somit eine ausreichende Komplexität auf, welche es mit den verschiednene Tools zu analysieren gilt.

Folgender Veröffentlichungsplan gilt für diese Artikelserie und wird mit jeder Veröffentlichung verlinkt:

  1. Celonis (erscheint demnächst)
  2. PAFnow (erscheint demnächst)
  3. MEHRWERK (erscheint demnächst)
  4. Lana Labs (erscheint demnächst)
  5. Signavio (erscheint demnächst)
  6. Process Gold (erscheint demnächst)
  7. Fluxicon Disco (erscheint demnächst)
  8. Aris Process Mining der Software AG (erscheint demnächst)

Interview – Machine Learning in Marketing und CRM

Interview mit Herrn Laurenz Wuttke von der datasolut GmbH über Machine Learning in Marketing und CRM.

Laurenz Wuttke ist Data Scientist und Gründer der datasolut GmbH. Er studierte Wirtschaftsinformatik an der Hochschule Hannover und befasst sich bereits seit 2011 mit Marketing- bzw. CRM-Systemen und der Datenanalyse. Heute ist er Dozent für Big Data im Marketing an der Hochschule Düsseldorf und unterstützt Unternehmen dabei, durch den Einsatz von künstlicher Intelligenz, individuell auf die Kundenbedürfnisse tausender Kunden einzugehen. Damit jeder Marketing Manager jedem Kunden das richtige Angebot zur richtigen Zeit machen kann.

Data Science Blog: Herr Wuttke, Marketing gilt als einer der Pionier-Bereiche der Unternehmen für den Einstieg in Big Data Analytics. Wie etabliert ist Big Data und Data Science heute im Marketing?  

Viele Unternehmen in Deutschland erkennen gerade Chancen und den Wert ihrer Daten. Dadurch investieren die Unternehmen in Big Data Infrastruktur und Data Science Teams.

Gleichzeitig denke ich, wir stehen im Marketing gerade am Anfang einer neuen Daten-Ära. Big Data und Data Science sind im Moment noch ein Thema der großen Konzerne. Viele kleine und mittelständische Unternehmen haben noch viele offene Potentiale in Bezug auf intelligente Kundenanalysen.

Durch stetig steigende Preise für die Kundenakquise, wird die Erhaltung und Steigerung einer guten Kundenbindung immer wichtiger. Und genau hier sehe ich die Vorteile durch Data Science im Marketing. Unternehmen können viel genauer auf Kundenbedürfnisse eingehen, antizipieren welches Produkt als nächstes gekauft wird und so ihr Marketing zielgenau ausrichten. Dieses „personalisierte Marketing“ führt zu einer deutlich stärkeren Kundenbindung und steigert langfristig Umsätze.

Viele amerikanische Unternehmen machen es vor, aber auch deutsche Unternehmen wie Zalando oder AboutYou investieren viel Geld in die Personalisierung ihres Marketings. Ich denke, die Erfolge sprechen für sich.

Data Science Blog: Ein häufiges Anliegen für viele Marketing Manager ist die treffsichere Kundensegmentierung nach vielerlei Kriterien. Welche Verbesserungen sind hier möglich und wie können Unternehmen diese erreichen?

Kundensegmentierungen sind ein wichtiger Bestandteil vieler Marketingstrategien. Allerdings kann man hier deutlich weitergehen und Marketing im Sinne von „Segments of One“ betreiben. Das bedeutet wir haben für jeden einzelnen Kunden eine individuelle „Next Best Action und Next Best Offer“.

Somit wird jeder Kunde aus Sicht des Marketings individuell betrachtet und bekommt individuelle Produktempfehlungen sowie Marketingmaßnahmen, welche auf das jeweilige Kundenbedürfnis zugeschnitten sind.

Dies ist auch ein wichtiger Schritt für die Marketingautomatisierung, denn wir können im Marketing schlichtweg keine tausenden von Kunden persönlich betreuen.

Data Science Blog: Sind die Kundencluster dann erkannt, stellt sich die Frage, wie diese besser angesprochen werden können. Wie funktioniert die dafür notwendige Kundenanalyse?

Ganz unterschiedlich, je nach Geschäftsmodell und Branche fällt die Kundenanalyse anders aus. Wir schauen uns unterschiedliche Merkmale zum historischen Kaufverhalten, Demografie und Produktnutzung an. Daraus ergeben sich in der Regel sehr schnell Kundenprofile oder Personas, die gezielt angesprochen werden können.

Data Science Blog: Oft werden derartige Analyse-Vorhaben auf Grund der Befürchtung, die relevanten Daten seien nicht verfügbar oder die Datenqualität sei einer solchen Analyse nicht würdig, gar nicht erst gestartet. Sind das begründete Bedenken?

Nein, denn oft kommen die Daten, die für eine Kundenanalyse oder die Vorhersage von Ergebnissen braucht, aus Datenquellen wie z.B. den Transaktionsdaten. Diese Daten hat jedes Unternehmen in guter Qualität vorliegen.

Natürlich werden die Analysen besser, wenn weitere Datenquellen wie bspw. Produktmetadaten, Kundeneigenschaften oder das Klickverhalten zur Verfügung stehen, aber es ist kein Muss.

Aus meiner Praxiserfahrung kann ich sagen, dass hier oft ungenutzte Potentiale schlummern.

Data Science Blog: Wie ist da eigentlich Ihre Erfahrung bzgl. der Interaktion zwischen Marketing und Business Intelligence? Sollten Marketing Manager ihre eigenen Datenexperten haben oder ist es besser, diese Ressourcen zentral in einer BI-Abteilung zu konzentrieren?

Aus meiner Sicht funktioniert moderenes Marketing heute nicht mehr ohne valide Datenbasis. Aus diesem Grund ist die Zusammenarbeit von Marketing und Business Intelligence unersetzbar, besonders wenn es um Bestandskundenmarketing geht. Hier laufen idealerweise alle Datenquellen in einer 360 Grad Kundensicht zusammen.

Dies kann dann auch als die Datenquelle für Machine Learning und Data Science verwendet werden. Alle wichtigen Daten können aus einer strukturierten 360 Grad Sicht zu einer Machine Learning Datenbasis (ML-Feature Store) umgewandelt werden. Das spart enorm viel Zeit und viel Geld.

Zu Ihrer zweiten Frage: Ich denke es gibt Argumente für beide Konstrukte, daher habe ich da keine klare Präferenz. Mir ist immer wichtig, dass der fachliche Austausch zwischen Technik und Fachbereich gut funktioniert. Ziele müssen besprochen und gegeben falls angepasst werden, um immer in die richtige Richtung zu gehen. Wenn diese Voraussetzung mit einer guten Data Science Infrastruktur gegeben ist, wird Data Science für wirklich skalierbar.

Data Science Blog: Benötigen Unternehmen dafür eine Customer Data Platform (CDP) oder zumindest ein CRM? Womit sollten Unternehmen beginnen, sollten sie noch ganz am Anfang stehen?

Eine Customer Data Platform (CDP) ist von Vorteil, ist aber kein Muss für den Anfang. Ein guts CRM-System oder gute gepflegte Kundendatenbank reicht zunächst für den Anfang.

Natürlich bietet eine CDP einen entscheidenden Vorteil durch die Zusammenführung von der Online- und der CRM-Welt. Das Klickverhalten hat einen enormen Einfluss auf die analytischen Modelle und hilft dabei, Kunden immer besser zu verstehen. Das ist besonders wichtig in unserer Zeit, da wir immer weniger direkten Kundenkontakt haben und zukünftig wird dieser auch noch weiter abnehmen.

Zusammengefasst: Wer diese Kundendaten intelligent miteinander verknüpft hat einen großen Vorteil.

Data Science Blog: Wie integrieren Sie App- und Webtracking in Ihre Analysen?

Trackingdaten aus Apps und Webseiten sind ein wichtiger Bestandteil unserer Machine Learning Modelle. Sie geben wichtige Informationen über das Kundenverhalten preis. So können die Trackingdaten gute Merkmale für Anwendungsfälle wie Churn Prediction, Customer Lifetime Value und Next Best Offer sein.

Häufig sind die Trackingdaten von unterschiedlichen Anbietern (Google Analytics, Piwik etc.) leicht anders in ihrer Struktur, dafür haben wir uns einen intelligenten Ansatz überlegt, um diese zu vereinheitlichen und in unseren Modellen anzuwenden.

Data Science Blog: Zurück zum Kunden. Seine Bedürfnisse stehen bei erfolgreichen Unternehmen im Fokus stehen. Einige Geschäftsmodelle basieren auf Abonnements oder Mitgliedschaften. Wie können Sie solchen Unternehmen helfen?

Abonnements und Subscriptions sind ein großer Trend: Der Kunde wird zum Nutzer und es fallen viele Kundendaten an, die gesammelt werden können. Viele unserer Kunden haben subscription- oder vertragsbasierte Geschäftsmodelle, was ich persönlich sehr interessante Geschäftsmodelle finde.

Diese haben häufig die Herausforderung ihre Kunden langfristig zu binden und eine gesunde Kundenbindung aufzubauen. Die Akquisition ist meistens sehr teuer und die Kundenabwanderung oder Customer Churn zu reduzieren damit ein strategisches Ziel. Wirklich erfolgreich werden diese dann, wenn die Churn Rate geringgehalten wird.

Die Lösung für eine niedrige Kundenabwanderung, neben einem guten Produkt und gutem Kundenservice, ist eine Churn Prediction und darauf aufbauende Churn Prevention Maßnahmen. Wir nehmen uns dazu das historische Kundenverhalten, schauen uns die Kündiger an und modellieren daraus eine Vorhersage für die Kundenabwanderung. So können Unternehmen abwanderungsgefährdete Kunden schon frühzeitig erkennen und entsprechend handeln. Das hat den entscheidenden Vorteil, dass man nicht einen schon verlorenen Kunden erneut gewinnen muss.

Es gibt aber auch Möglichkeiten schon weit vor der eigentlichen Churn-Gefahr anzusetzen, bei drohender Inaktivität. So haben wir für einen großen Fitness-App-Anbieter ein Alarmsystem entwickelt, das Kunden automatisiert Engagement-Kampagnen versendet, um bei drohender Inaktivität, den Kunden auf die Angebote aufmerksam zu machen. Sie kennen das von der Netflix-App, welche Ihnen jeden Abend einen guten Tipp für das Fernsehprogramm bereitstellt.

Data Science Blog: Gehen wir mal eine Ebene höher. So mancher CMO hat mit dem CFO den Deal, jährlich nur einen bestimmten Betrag ins Marketing zu stecken. Wie hilft Data Science bei der Budget-Verteilung auf die Bestandskunden?

Da gibt es eine einfache Lösung für „Customer Lifetime Value Prognosen“. Durch Machine Learning wird für jeden einzelnen Kunden eine Umsatz-Vorhersage für einen bestimmten Zeitraum getroffen. So kann das Bestandkundenmarketing das Marketingbudget ganz gezielt einsetzen und nach dem Kundenwert steuern. Ich gebe Ihnen ein Beispiel: Kundenreaktivierung im Handel. Sie haben ein bestimmtes Budget und können nicht jedem Kunden eine Reaktivierungsmaßnahme zukommen lassen. Wenn Sie einen gut berechneten Customer Lifetime Value haben, können Sie sich so auf die wertigen Kunden konzentrieren und diese reaktivieren.

Data Science Blog: Mit welchen Technologien arbeiten Sie bevorzugt? Welche Tools sind gerade im Kontext von analytischen Aufgaben im Marketing besonders effizient?

Wir haben uns in den letzten Jahren besonders auf Python und PySpark fokussiert. Mit der Entwicklung von Python für Data Science konnten die anderen Umgebungen kaum mithalten und somit ist Python aus meiner Sicht derzeit die beste Umgebung für unsere Lösungen.

Auch die Cloud spielt eine große Rolle für uns. Als kleines Unternehmen haben wir uns bei datasolut auf die AWS Cloud fokussiert, da wir gar nicht in der Lage wären, riesige Datenbestände unserer Kunden zu hosten.

Vor allem von dem hohen Automatisierungsgrad in Bezug auf Datenverarbeitung und Machine Learning bietet AWS alles, was das Data Science Herz begehrt.

Data Science Blog: Was würden Sie einem Junior Marketing Manager und einem Junior Data Scientist für den Ausbau seiner Karriere raten? Wie werden diese jungen Menschen zukünftig beruflich erfolgreich?

Dem Junior Marketing Manager würde ich immer raten, dass er sich Datenanalyse-Skills erarbeiten soll. Aber vor allem sollte er verstehen, was mit Daten alles möglich ist und wie diese eingesetzt werden können. Auch in meiner Vorlesung zu „Big Data im Marketing“ an der Hochschule Düsseldorf unterrichte ich Studierende, die auf Marketing spezialisiert sind. Hier gebe ich stets diesen Ratschlag.

Bei den Junior Daten Scientist ist es andersherum. Ich sehe in der Praxis immer wieder Data Scientists, die den Transfer zwischen Marketing und Data Science nicht gut hinbekommen. Daher rate ich jedem Data Scientist, der sich auf Marketing und Vertrieb fokussieren will, dass hier fachliches Know-How essentiell ist. Kein Modell oder Score hat einen Wert für ein Unternehmen, wenn es nicht gut im Marketing eingesetzt wird und dabei hilft, Marketingprozesse zu automatisieren.

Ein weiterer wichtiger Aspekt ist, dass sich Data Science und Machine Learning gerade rasant ändern. Die Automatisierung (Stichwort: AutoML) von diesen Prozessen ist auf der Überholspur, dass zeigen die großen Cloudanbieter ganz deutlich. Auch wir nutzen diese Technologie schon in der Praxis. Was der Algorithmus aber nicht übernehmen kann, ist der Transfer und Enablement der Fachbereiche.

Data Science Blog: Zum Schluss noch eine Bitte: Was ist Ihre Prophezeiung für die kommenden Jahre 2021/2022. What is the next big thing in Marketing Analytics?

Es gibt natürlich viele kleinere Trends, welche das Marketing verändern werden. Ich denke jedoch, dass die größte Veränderung für die Unternehmen sein wird, dass es einen viel großflächigeren Einsatz von Machine Learning im Marketing geben wird. Dadurch wird der Wettbewerb härter und für viele Unternehmen wird Marketing Analytics ein essentieller Erfolgsfaktor sein.

Simple RNN

Prerequisites for understanding RNN at a more mathematical level

Writing the A gentle introduction to the tiresome part of understanding RNN Article Series on recurrent neural network (RNN) is nothing like a creative or ingenious idea. It is quite an ordinary topic. But still I am going to write my own new article on this ordinary topic because I have been frustrated by lack of sufficient explanations on RNN for slow learners like me.

I think many of readers of articles on this website at least know that RNN is a type of neural network used for AI tasks, such as time series prediction, machine translation, and voice recognition. But if you do not understand how RNNs work, especially during its back propagation, this blog series is for you.

After reading this articles series, I think you will be able to understand RNN in more mathematical and abstract ways. But in case some of the readers are allergic or intolerant to mathematics, I tried to use as little mathematics as possible.

Ideal prerequisite knowledge:

  • Some understanding on densely connected layers (or fully connected layers, multilayer perception) and how their forward/back propagation work.
  •  Some understanding on structure of Convolutional Neural Network.

*In this article “Densely Connected Layers” is written as “DCL,” and “Convolutional Neural Network” as “CNN.”

1, Difficulty of Understanding RNN

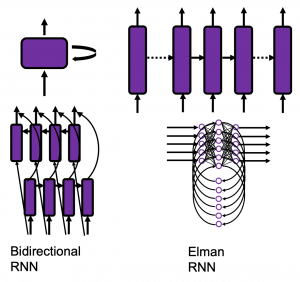
I bet a part of difficulty of understanding RNN comes from the variety of its structures. If you search “recurrent neural network” on Google Image or something, you will see what I mean. But that cannot be helped because RNN enables a variety of tasks.

Another major difficulty of understanding RNN is understanding its back propagation algorithm. I think some of you found it hard to understand chain rules in calculating back propagation of densely connected layers, where you have to make the most of linear algebra. And I have to say backprop of RNN, especially LSTM, is a monster of chain rules. I am planing to upload not only a blog post on RNN backprop, but also a presentation slides with animations to make it more understandable, in some external links.

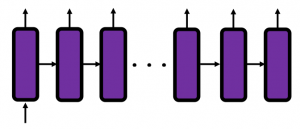
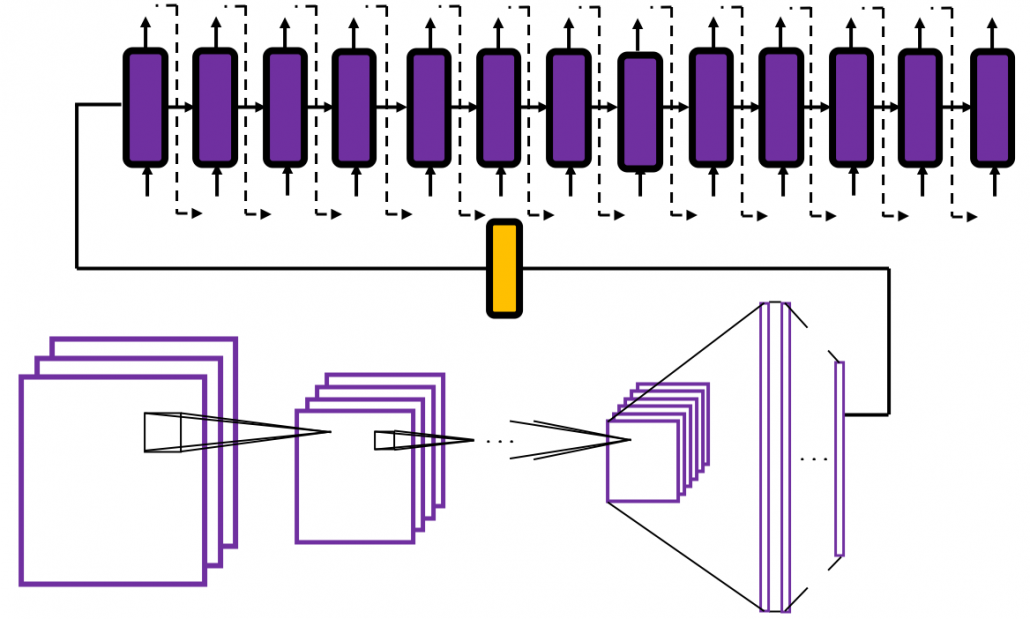
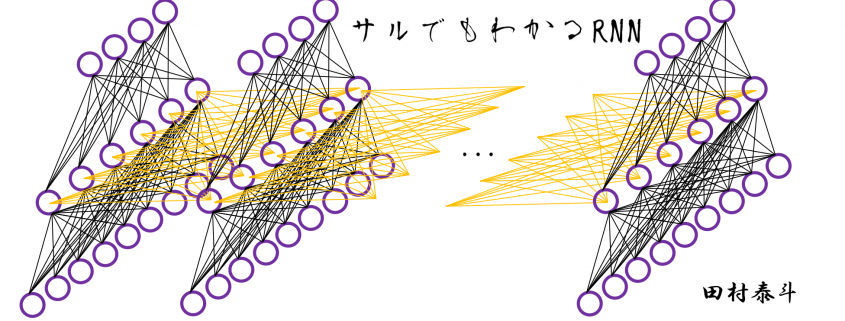
In order to avoid such confusions, I am going to introduce a very simplified type of RNN, which I call a “simple RNN.” The RNN displayed as the head image of this article is a simple RNN.

2, How Neurons are Connected

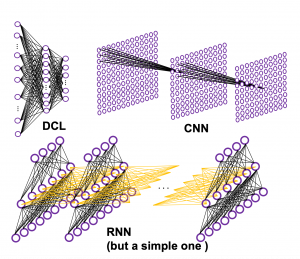
How to connect neurons and how to activate them is what neural networks are all about. Structures of those neurons are easy to grasp as long as that is about DCL or CNN. But when it comes to the structure of RNN, many study materials try to avoid showing that RNNs are also connections of neurons, as well as DCL or CNN(*If you are not sure how neurons are connected in CNN, this link should be helpful. Draw a random digit in the square at the corner.). In fact the structure of RNN is also the same, and as long as it is a simple RNN, and it is not hard to visualize its structure.

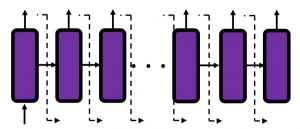
Even though RNN is also connections of neurons, usually most RNN charts are simplified, using blackboxes. In case of simple RNN, most study material would display it as the chart below.

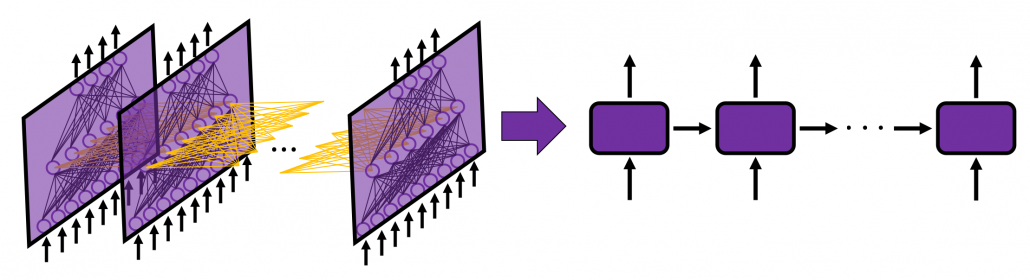
But that also cannot be helped because fancier RNN have more complicated connections of neurons, and there are no longer advantages of displaying RNN as connections of neurons, and you would need to understand RNN in more abstract way, I mean, as you see in most of textbooks.

I am going to explain details of simple RNN in the next article of this series.

3, Neural Networks as Mappings

If you still think that neural networks are something like magical spider webs or models of brain tissues, forget that. They are just ordinary mappings.

If you have been allergic to mathematics in your life, you might have never heard of the word “mapping.” If so, at least please keep it in mind that the equation y=f(x), which most people would have seen in compulsory education, is a part of mapping. If you get a value x, you get a value y corresponding to the x.

But in case of deep learning, x is a vector or a tensor, and it is denoted in bold like \boldsymbol{x} . If you have never studied linear algebra , imagine that a vector is a column of Excel data (only one column), a matrix is a sheet of Excel data (with some rows and columns), and a tensor is some sheets of Excel data (each sheet does not necessarily contain only one column.)

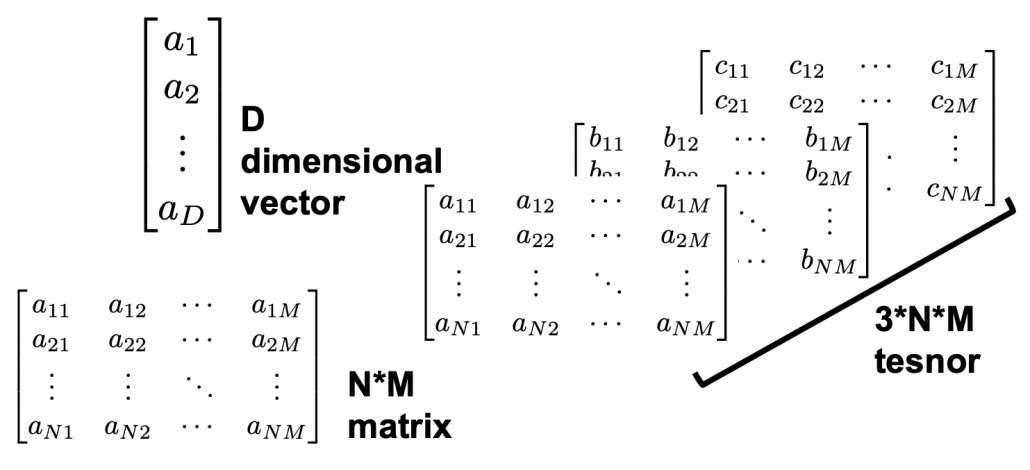
CNNs are mainly used for image processing, so their inputs are usually image data. Image data are in many cases (3, hight, width) tensors because usually an image has red, blue, green channels, and the image in each channel can be expressed as a height*width matrix (the “height” and the “width” are number of pixels, so they are discrete numbers).

The convolutional part of CNN (which I call “feature extraction part”) maps the tensors to a vector, and the last part is usually DCL, which works as classifier/regressor. At the end of the feature extraction part, you get a vector. I call it a “semantic vector” because the vector has information of “meaning” of the input image. In this link you can see maps of pictures plotted depending on the semantic vector. You can see that even if the pictures are not necessarily close pixelwise, they are close in terms of the “meanings” of the images.

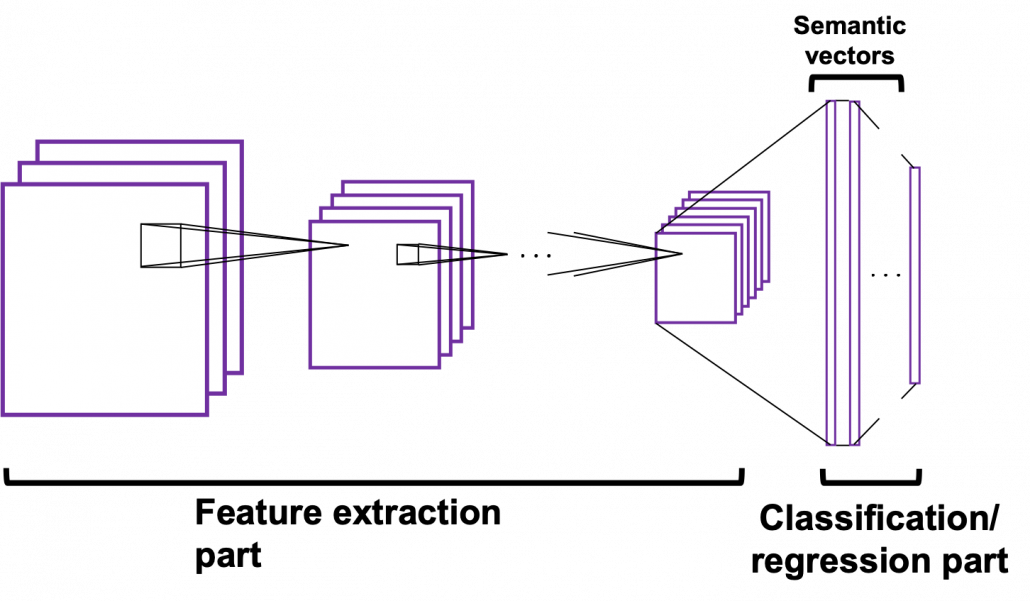
In the example of a dog/cat classifier introduced by François Chollet, the developer of Keras, the CNN maps (3, 150, 150) tensors to 2-dimensional vectors, (1, 0) or (0, 1) for (dog, cat).

Wrapping up the points above, at least you should keep two points in mind: first, DCL is a classifier or a regressor, and CNN is a feature extractor used for image processing. And another important thing is, feature extraction parts of CNNs map images to vectors which are more related to the “meaning” of the image.

Importantly, I would like you to understand RNN this way. An RNN is also just a mapping.

*I recommend you to at least take a look at the beautiful pictures in this link. These pictures give you some insight into how CNN perceive images.

4, Problems of DCL and CNN, and needs for RNN

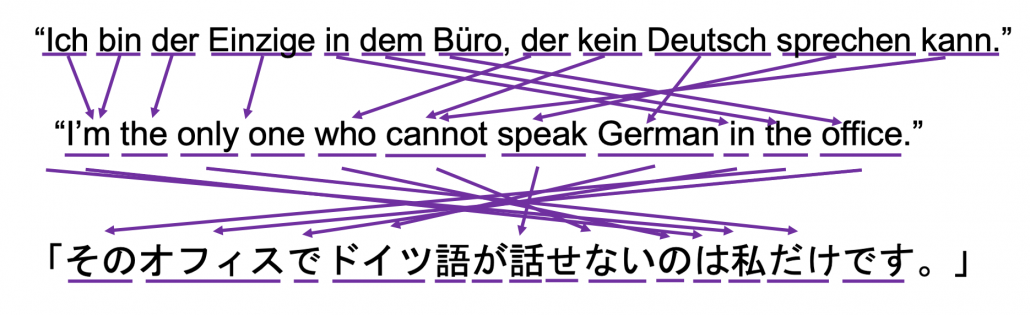
Taking an example of RNN task should be helpful for this topic. Probably machine translation is the most famous application of RNN, and it is also a good example of showing why DCL and CNN are not proper for some tasks. Its algorithms is out of the scope of this article series, but it would give you a good insight of some features of RNN. I prepared three sentences in German, English, and Japanese, which have the same meaning. Assume that each sentence is divided into some parts as shown below and that each vector corresponds to each part. In machine translation we want to convert a set of the vectors into another set of vectors.

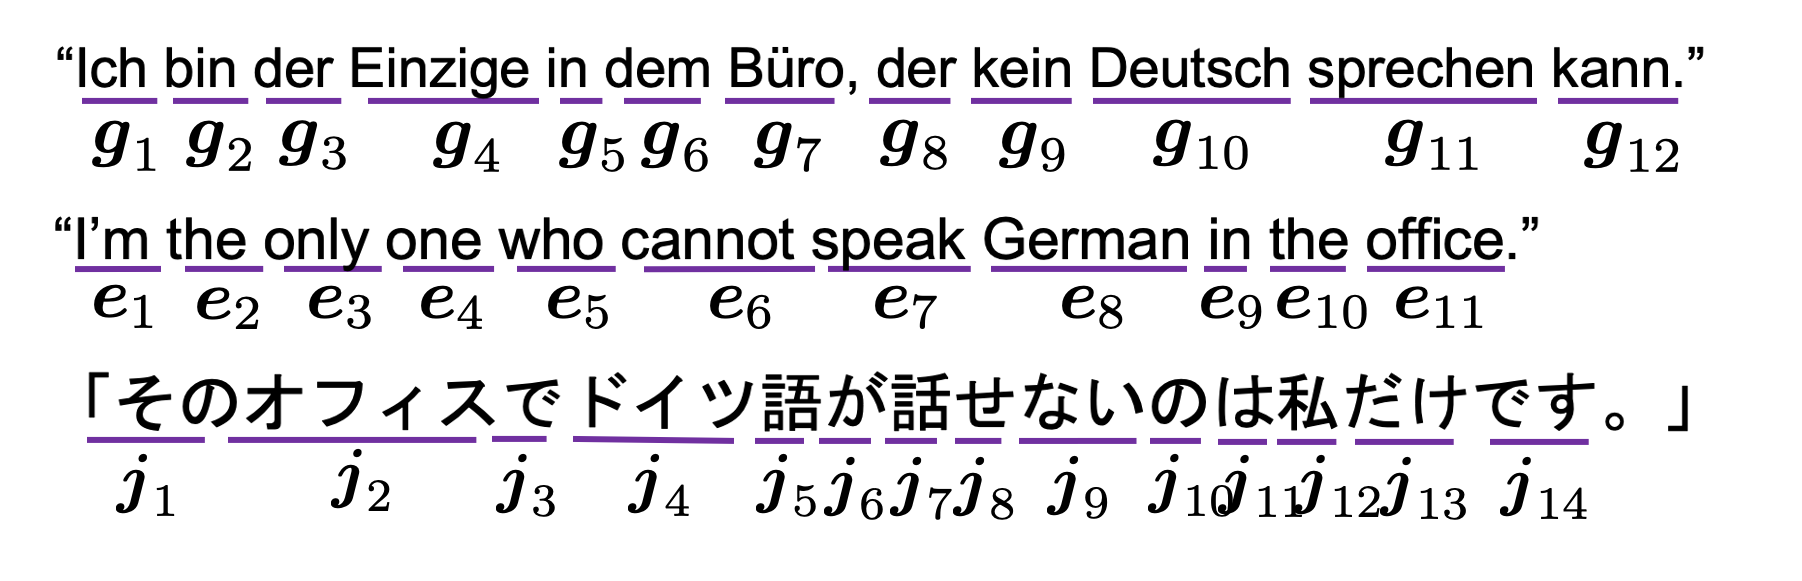
Then let’s see why DCL and CNN are not proper for such task.

  • The input size is fixed: In case of the dog/cat classifier I have mentioned, even though the sizes of the input images varies, they were first molded into (3, 150, 150) tensors. But in machine translation, usually the length of the input is supposed to be flexible.
  • The order of inputs does not mater: In case of the dog/cat classifier the last section, even if the input is “cat,” “cat,” “dog” or “dog,” “cat,” “cat” there’s no difference. And in case of DCL, the network is symmetric, so even if you shuffle inputs, as long as you shuffle all of the input data in the same way, the DCL give out the same outcome . And if you have learned at least one foreign language, it is easy to imagine that the orders of vectors in sequence data matter in machine translation.

*It is said English language has phrase structure grammar, on the other hand Japanese language has dependency grammar. In English, the orders of words are important, but in Japanese as long as the particles and conjugations are correct, the orders of words are very flexible. In my impression, German grammar is between them. As long as you put the verb at the second position and the cases of the words are correct, the orders are also relatively flexible.

5, Sequence Data

We can say DCL and CNN are not useful when you want to process sequence data. Sequence data are a type of data which are lists of vectors. And importantly, the orders of the vectors matter. The number of vectors in sequence data is usually called time steps. A simple example of sequence data is meteorological data measured at a spot every ten minutes, for instance temperature, air pressure, wind velocity, humidity. In this case the data is recorded as 4-dimensional vector every ten minutes.

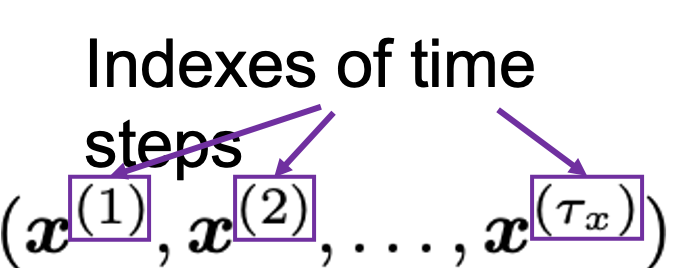
But this “time step” does not necessarily mean “time.” In case of natural language processing (including machine translation), which you I mentioned in the last section, the numberings of each vector denoting each part of sentences are “time steps.”

And RNNs are mappings from a sequence data to another sequence data.

In case of the machine translation above, the each sentence in German, English, and German is expressed as sequence data \boldsymbol{G}=(\boldsymbol{g}_1,\dots ,\boldsymbol{g}_{12}), \boldsymbol{E}=(\boldsymbol{e}_1,\dots ,\boldsymbol{e}_{11}), \boldsymbol{J}=(\boldsymbol{j}_1,\dots ,\boldsymbol{j}_{14}), and machine translation is nothing but mappings between these sequence data.


*At least I found a paper on the RNN’s capability of universal approximation on many-to-one RNN task. But I have not found any papers on universal approximation of many-to-many RNN tasks. Please let me know if you find any clue on whether such approximation is possible. I am desperate to know that. 

6, Types of RNN Tasks

RNN tasks can be classified into some types depending on the lengths of input/output sequences (the “length” means the times steps of input/output sequence data).

If you want to predict the temperature in 24 hours, based on several time series data points in the last 96 hours, the task is many-to-one. If you sample data every ten minutes, the input size is 96*6=574 (the input data is a list of 574 vectors), and the output size is 1 (which is a value of temperature). Another example of many-to-one task is sentiment classification. If you want to judge whether a post on SNS is positive or negative, the input size is very flexible (the length of the post varies.) But the output size is one, which is (1, 0) or (0, 1), which denotes (positive, negative).

*The charts in this section are simplified model of RNN used for each task. Please keep it in mind that they are not 100% correct, but I tried to make them as exact as possible compared to those in other study materials.

Music/text generation can be one-to-many tasks. If you give the first sound/word you can generate a phrase.

Next, let’s look at many-to-many tasks. Machine translation and voice recognition are likely to be major examples of many-to-many tasks, but here name entity recognition seems to be a proper choice. Name entity recognition is task of finding proper noun in a sentence . For example if you got two sentences “He said, ‘Teddy bears on sale!’ ” and ‘He said, “Teddy Roosevelt was a great president!” ‘ judging whether the “Teddy” is a proper noun or a normal noun is name entity recognition.

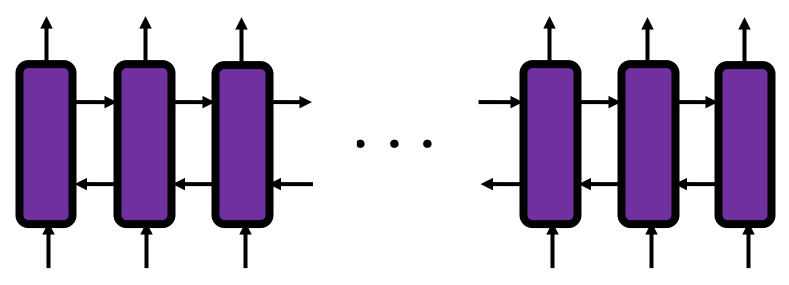
Machine translation and voice recognition, which are more popular, are also many-to-many tasks, but they use more sophisticated models. In case of machine translation, the inputs are sentences in the original language, and the outputs are sentences in another language. When it comes to voice recognition, the input is data of air pressure at several time steps, and the output is the recognized word or sentence. Again, these are out of the scope of this article but I would like to introduce the models briefly.

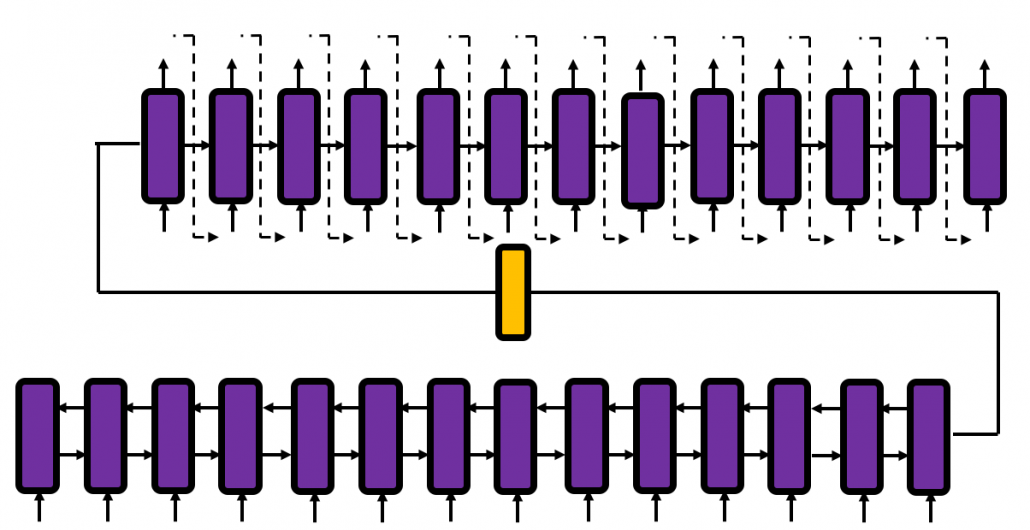
Machine translation uses a type of RNN named sequence-to-sequence model (which is often called seq2seq model). This model is also very important for other natural language processes tasks in general, such as text summarization. A seq2seq model is divided into the encoder part and the decoder part. The encoder gives out a hidden state vector and it used as the input of the decoder part. And decoder part generates texts, using the output of the last time step as the input of next time step.

Voice recognition is also a famous application of RNN, but it also needs a special type of RNN.

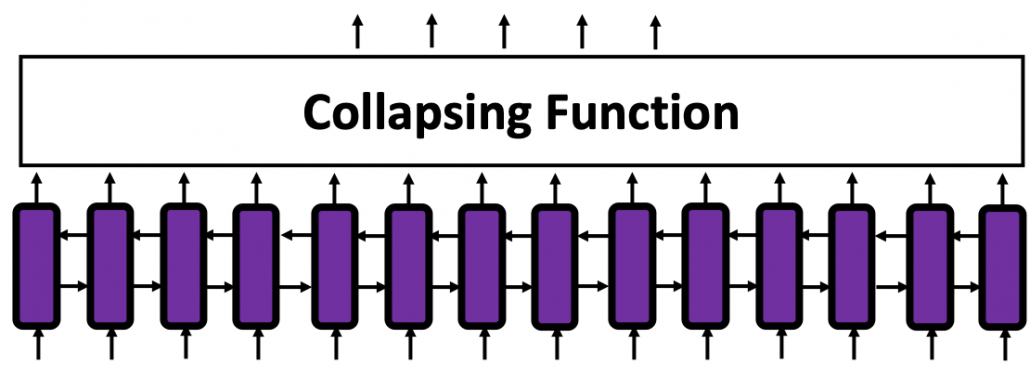
*To be honest, I don’t know what is the state-of-the-art voice recognition algorithm. The example in this article is a combination of RNN and a collapsing function made using Connectionist Temporal Classification (CTC). In this model, the output of RNN is much longer than the recorded words or sentences, so a collapsing function reduces the output into next output with normal length.

You might have noticed that RNNs in the charts above are connected in both directions. Depending on the RNN tasks you need such bidirectional RNNs.  I think it is also easy to imagine that such networks are necessary. Again, machine translation is a good example.

And interestingly, image captioning, which enables a computer to describe a picture, is one-to-many-task. As the output is a sentence, it is easy to imagine that the output is “many.” If it is a one-to-many task, the input is supposed to be a vector.

Where does the input come from? I mentioned that the last some layers in of CNN are closely connected to how CNNs extract meanings of pictures. Surprisingly such vectors, which I call a “semantic vectors” is the inputs of image captioning task (after some transformations, depending on the network models).

I think this articles includes major things you need to know as prerequisites when you want to understand RNN at more mathematical level. In the next article, I would like to explain the structure of a simple RNN, and how it forward propagate.

* I make study materials on machine learning, sponsored by DATANOMIQ. I do my best to make my content as straightforward but as precise as possible. I include all of my reference sources. If you notice any mistakes in my materials, please let me know (email: yasuto.tamura@datanomiq.de). And if you have any advice for making my materials more understandable to learners, I would appreciate hearing it.

Einführung und Vertiefung in R Statistics mit den Dortmunder R-Kursen!

Im Rahmen der Dortmunder R Kurse bieten wir unsere Expertise in Schulungen für die Programmiersprache R an. Zielgruppe unserer Fortbildungen sind nicht nur Statistiker, sondern auch Anwender jeder Fachrichtung aus Industrie und Forschungseinrichtungen, die mit R ihre Daten analysieren wollen. Die Dortmunder R-Kurse werden ausschließlich von Statistikern mit langjähriger Erfahrung angeboten. Die Referenten gehören zum engsten Kreis der internationalen R-Gemeinschaft. Die angebotenen Kurse haben sich vielfach national und international bewährt.

Unsere Termine für die Online-Durchführung in diesem Jahr:

8., 9. und 10. Juni: R-Basiskurs (jeweils 9:00 – 14:00 Uhr)

22., 23., 24. und 25. Juni: R-Vertiefungskurs (jeweils 9:00 – 13:00 Uhr)

Kosten jeweils 750.00€, bei Buchung beider Kurse im Juni erhalten Sie einen Preisnachlass von 200€.

Zur Anmeldung gelangen Sie über den nachfolgenden Link:
https://www.zhb.tu-dortmund.de/zhb/wb/de/home/Seminare/Andere_Veranst/index.html

R Basiskurs

Das Seminar R Basiskurs für Anfänger findet am 8., 9. und 10. Juni 2020 statt. Den Teilnehmern wird der praxisrelevante Part der Programmiersprache näher gebracht, um so die Grundlagen zur ersten Datenanalyse — von Datensatz zu statistischen Kennzahlen und ersten Visualisierungen — zu schaffen. Anmeldeschluss ist der 25. Mai 2020.

Programm:

  • Installation von R und zugehöriger Entwicklungsumgebung
  • Grundlagen von R: Syntax, Datentypen, Operatoren, Funktionen, Indizierung
  • R-Hilfe effektiv nutzen
  • Ein- und Ausgabe von Daten
  • Behandlung fehlender Werte
  • Statistische Kennzahlen
  • Visualisierung

R Vertiefungskurs

Das Seminar R-Vertiefungskurs für Fortgeschrittene findet am 22., 23., 24. und 25. Juni (jeweils von 9:00 – 13:00 Uhr) statt. Die Veranstaltung ist ideal für Teilnehmende mit ersten Vorkenntnissen, die ihre Analysen effizient mit R durchführen möchten. Anmeldeschluss ist der 11. Juni 2020.

Der Vertiefungskurs baut inhaltlich auf dem Basiskurs auf. Es besteht aber keine Verpflichtung, bei Besuch des Vertiefungskurses zuvor den Basiskurs zu absolvieren, wenn bereits entsprechende Vorkenntnisse in R vorhanden sind.

Programm:

  • Eigene Funktionen, Schleifen vermeiden durch *apply
  • Einführung in ggplot2 und dplyr
  • Statistische Tests und Lineare Regression
  • Dynamische Berichterstellung
  • Angewandte Datenanalyse anhand von Fallbeispielen

Links zur Veranstaltung direkt:

R-Basiskurs: https://dortmunder-r-kurse.de/kurse/r-basiskurs/

R-Vertiefungskurs: https://dortmunder-r-kurse.de/kurse/r-vertiefungskurs/

As Businesses Struggle With ML, Automation Offers a Solution

In recent years, machine learning technology and the business solutions it enables has developed into a big business in and of itself. According to the industry analysts at IDC, spending on ML and AI technology is set to grow to almost $98 billion per year by 2023. In practical terms, that figure represents a business environment where ML technology has become a key priority for companies of every kind.

That doesn’t mean that the path to adopting ML technology is easy for businesses. Far from it. In fact, survey data seems to indicate that businesses are still struggling to get their machine learning efforts up and running. According to one such survey, it currently takes the average business as many as 90 days to deploy a single machine learning model. For 20% of businesses, that number is even higher.

From the data, it seems clear that something is missing in the methodologies that most companies rely on to make meaningful use of machine learning in their business workflows. A closer look at the situation reveals that the vast majority of data workers (analysts, data scientists, etc.) spend an inordinate amount of time on infrastructure work – and not on creating and refining machine learning models.

Streamlining the ML Adoption Process

To fix that problem, businesses need to turn to another growing area of technology: automation. By leveraging the latest in automation technology, it’s now possible to build an automated machine learning pipeline (AutoML pipeline) that cuts down on the repetitive tasks that slow down ML deployments and lets data workers get back to the work they were hired to do. With the right customized solution in place, a business’s ML team can:

  • Reduce the time spent on data collection, cleaning, and ingestion
  • Minimize human errors in the development of ML models
  • Decentralize the ML development process to create an ML-as-a-service model with increased accessibility for all business stakeholders

In short, an AutoML pipeline turns the high-effort functions of the ML development process into quick, self-adjusting steps handled exclusively by machines. In some use cases, an AutoML pipeline can even allow non-technical stakeholders to self-create ML solutions tailored to specific business use cases with no expert help required. In that way, it can cut ML costs, shorten deployment time, and allow data scientists to focus on tackling more complex modelling work to develop custom ML solutions that are still outside the scope of available automation techniques.

The Parts of an AutoML Pipeline

Although the frameworks and tools used to create an AutoML pipeline can vary, they all contain elements that conform to the following areas:

  • Data Preprocessing – Taking available business data from a variety of sources, cleaning it, standardizing it, and conducting missing value imputation
  • Feature Engineering – Identifying features in the raw data set to create hypotheses for the model to base predictions on
  • Model Selection – Choosing the right ML approach or hyperparameters to produce the desired predictions
  • Tuning Hyperparameters – Determining which hyperparameters help the model achieve optimal performance

As anyone familiar with ML development can tell you, the steps in the above process tend to represent the majority of the labour and time-intensive work that goes into creating a model that’s ready for real-world business use. It is also in those steps where the lion’s share of business ML budgets get consumed, and where most of the typical delays occur.

The Limitations and Considerations for Using AutoML

Given the scope of the work that can now become part of an AutoML pipeline, it’s tempting to imagine it as a panacea – something that will allow a business to reduce its reliance on data scientists going forward. Right now, though, the technology can’t do that. At this stage, AutoML technology is still best used as a tool to augment the productivity of business data teams, not to supplant them altogether.

To that end, there are some considerations that businesses using AutoML will need to keep in mind to make sure they get reliable, repeatable, and value-generating results, including:

  • Transparency – Businesses must establish proper vetting procedures to make sure they understand the models created by their AutoML pipeline, so they can explain why it’s making the choices or predictions it’s making. In some industries, such as in medicine or finance, this could even fall under relevant regulatory requirements.
  • Extensibility – Making sure the AutoML framework may be expanded and modified to suit changing business needs or to tackle new challenges as they arise.
  • Monitoring and Maintenance – Since today’s AutoML technology isn’t a set-it-and-forget-it proposition, it’s important to establish processes for the monitoring and maintenance of the deployment so it can continue to produce useful and reliable ML models.

The Bottom Line

As it stands today, the convergence of automation and machine learning holds the promise of delivering ML models at scale for businesses, which would greatly speed up the adoption of the technology and lower barriers to entry for those who have yet to embrace it. On the whole, that’s great news both for the businesses that will benefit from increased access to ML technology, as well as for the legions of data professionals tasked with making it all work.

It’s important to note, of course, that complete end-to-end ML automation with no human intervention is still a long way off. While businesses should absolutely explore building an automated machine learning pipeline to speed up development time in their data operations, they shouldn’t lose sight of the fact that they still need plenty of high-skilled data scientists and analysts on their teams. It’s those specialists that can make appropriate and productive use of the technology. Without them, an AutoML pipeline would accomplish little more than telling the business what it wants to hear.

The good news is that the AutoML tools that exist right now are sufficient to alleviate many of the real-world problems businesses face in their road to ML adoption. As they become more commonplace, there’s little doubt that the lead time to deploy machine learning models is going to shrink correspondingly – and that businesses will enjoy higher ROI and enhanced outcomes as a result.

Six properties of modern Business Intelligence

Regardless of the industry in which you operate, you need information systems that evaluate your business data in order to provide you with a basis for decision-making. These systems are commonly referred to as so-called business intelligence (BI). In fact, most BI systems suffer from deficiencies that can be eliminated. In addition, modern BI can partially automate decisions and enable comprehensive analyzes with a high degree of flexibility in use.


Read this article in German:
“Sechs Eigenschaften einer modernen Business Intelligence“


Let us discuss the six characteristics that distinguish modern business intelligence, which mean taking technical tricks into account in detail, but always in the context of a great vision for your own company BI:

1. Uniform database of high quality

Every managing director certainly knows the situation that his managers do not agree on how many costs and revenues actually arise in detail and what the margins per category look like. And if they do, this information is often only available months too late.

Every company has to make hundreds or even thousands of decisions at the operational level every day, which can be made much more well-founded if there is good information and thus increase sales and save costs. However, there are many source systems from the company’s internal IT system landscape as well as other external data sources. The gathering and consolidation of information often takes up entire groups of employees and offers plenty of room for human error.

A system that provides at least the most relevant data for business management at the right time and in good quality in a trusted data zone as a single source of truth (SPOT). SPOT is the core of modern business intelligence.

In addition, other data on BI may also be made available which can be useful for qualified analysts and data scientists. For all decision-makers, the particularly trustworthy zone is the one through which all decision-makers across the company can synchronize.

2. Flexible use by different stakeholders

Even if all employees across the company should be able to access central, trustworthy data, with a clever architecture this does not exclude that each department receives its own views of this data. Many BI systems fail due to company-wide inacceptance because certain departments or technically defined employee groups are largely excluded from BI.

Modern BI systems enable views and the necessary data integration for all stakeholders in the company who rely on information and benefit equally from the SPOT approach.

3. Efficient ways to expand (time to market)

The core users of a BI system are particularly dissatisfied when the expansion or partial redesign of the information system requires too much of patience. Historically grown, incorrectly designed and not particularly adaptable BI systems often employ a whole team of IT staff and tickets with requests for change requests.

Good BI is a service for stakeholders with a short time to market. The correct design, selection of software and the implementation of data flows / models ensures significantly shorter development and implementation times for improvements and new features.

Furthermore, it is not only the technology that is decisive, but also the choice of organizational form, including the design of roles and responsibilities – from the technical system connection to data preparation, pre-analysis and support for the end users.

4. Integrated skills for Data Science and AI

Business intelligence and data science are often viewed and managed separately from each other. Firstly, because data scientists are often unmotivated to work with – from their point of view – boring data models and prepared data. On the other hand, because BI is usually already established as a traditional system in the company, despite the many problems that BI still has today.

Data science, often referred to as advanced analytics, deals with deep immersion in data using exploratory statistics and methods of data mining (unsupervised machine learning) as well as predictive analytics (supervised machine learning). Deep learning is a sub-area of ​​machine learning and is used for data mining or predictive analytics. Machine learning is a sub-area of ​​artificial intelligence (AI).

In the future, BI and data science or AI will continue to grow together, because at the latest after going live, the prediction models flow back into business intelligence. BI will probably develop into ABI (Artificial Business Intelligence). However, many companies are already using data mining and predictive analytics in the company, using uniform or different platforms with or without BI integration.

Modern BI systems also offer data scientists a platform to access high-quality and more granular raw data.

5. Sufficiently high performance

Most readers of these six points will probably have had experience with slow BI before. It takes several minutes to load a daily report to be used in many classic BI systems. If loading a dashboard can be combined with a little coffee break, it may still be acceptable for certain reports from time to time. At the latest, however, with frequent use, long loading times and unreliable reports are no longer acceptable.

One reason for poor performance is the hardware, which can be almost linearly scaled to higher data volumes and more analysis complexity using cloud systems. The use of cloud also enables the modular separation of storage and computing power from data and applications and is therefore generally recommended, but not necessarily the right choice for all companies.

In fact, performance is not only dependent on the hardware, the right choice of software and the right choice of design for data models and data flows also play a crucial role. Because while hardware can be changed or upgraded relatively easily, changing the architecture is associated with much more effort and BI competence. Unsuitable data models or data flows will certainly bring the latest hardware to its knees in its maximum configuration.

6. Cost-effective use and conclusion

Professional cloud systems that can be used for BI systems offer total cost calculators, such as Microsoft Azure, Amazon Web Services and Google Cloud. With these computers – with instruction from an experienced BI expert – not only can costs for the use of hardware be estimated, but ideas for cost optimization can also be calculated. Nevertheless, the cloud is still not the right solution for every company and classic calculations for on-premise solutions are necessary.

Incidentally, cost efficiency can also be increased with a good selection of the right software. Because proprietary solutions are tied to different license models and can only be compared using application scenarios. Apart from that, there are also good open source solutions that can be used largely free of charge and can be used for many applications without compromises.

However, it is wrong to assess the cost of a BI only according to its hardware and software costs. A significant part of cost efficiency is complementary to the aspects for the performance of the BI system, because suboptimal architectures work wastefully and require more expensive hardware than neatly coordinated architectures. The production of the central data supply in adequate quality can save many unnecessary processes of data preparation and many flexible analysis options also make redundant systems unnecessary and lead to indirect savings.

In any case, a BI for companies with many operational processes is always cheaper than no BI. However, if you take a closer look with BI expertise, cost efficiency is often possible.

Interview – There is no stand-alone strategy for AI, it must be part of the company-wide strategy

Ronny FehlingRonny Fehling is Partner and Associate Director for Artificial Intelligence as the Boston Consulting Group GAMMA. With more than 20 years of continually progressive experience in leading business and technology innovation, spearheading digital transformation, and aligning the corporate strategy with Artificial Intelligence he industry-leading organizations to grow their top-line and kick-start their digital transformation.

Ronny Fehling is furthermore speaker of the Predictive Analytics World for Industry 4.0 in May 2020.

Data Science Blog: Mr. Fehling, you are consulting companies and business leaders about AI and how to get started with it. AI as a definition is often misleading. How do you define AI?

This is a good question. I think there are two ways to answer this:

From a technical definition, I often see expressions about “simulation of human intelligence” and “acting like a human”. I find using these terms more often misleading rather than helpful. I studied AI back when it wasn’t yet “cool” and still middle of the AI winter. And yes, we have much more compute power and access to data, but we also think about data in a very different way. For me, I typically distinguish between machine learning, which uses algorithms and statistical methods to identify patterns in data, and AI, which for me attempts to interpret the data in a given context. So machine learning can help me identify and analyze frequency patterns in text and even predict the next word I will type based on my history. AI will help me identify ‘what’ I’m writing about – even if I don’t explicitly name it. It can tell me that when I’m asking “I’m looking for a place to stay” that I might want to see a list of hotels around me. In other words: machine learning can detect correlations and similar patterns, AI uses machine learning to generate insights.

I always wondered why top executives are so frequently asking about the definition of AI because at first it seemed to me not as relevant to the discussion on how to align AI with their corporate strategy. However, I started to realize that their question is ultimately about “What is AI and what can it do for me?”.

For me, AI can do three things really good, which humans cannot really do and previous approaches couldn’t cope with:

  1. Finding similar patterns in historical data. Imagine 20 years of data like maintenance or repair documents of a manufacturing plant. Although they describe work done on a multitude of products due to a multitude of possible problems, AI can use this to look for a very similar situation based on a current problem description. This can be used to identify a common root cause as well as a common solution approach, saving valuable time for the operation.
  2. Finding correlations across time or processes. This is often used in predictive maintenance use cases. Here, the AI tries to see what similar events happen typically at some time before a failure happen. This way, it can alert the operator much earlier about an impending failure, say due to a change in the vibration pattern of the machine.
  3. Finding an optimal solution path based on many constraints. There are many problems in the business world, where choosing the optimal path based on complex situations is critical. Let’s say that suddenly a severe weather warning at an airport forces an airline to have to change their scheduling because of a reduced airport capacity. Delays for some aircraft can cause disruptions because passengers or personnel not being able to connect anymore. Knowing which aircraft to delay, which to cancel, which to switch while causing the minimal amount of disruption to passengers, crew, maintenance and ground-crew is something AI can help with.

The key now is to link these fundamental capabilities with the business context of the company and how it can ultimately help transform.

Data Science Blog: Companies are still starting with their own company-wide data strategy. And now they are talking about AI strategies. Is that something which should be handled separately?

In my experience – both based on having seen the implementations of several corporate data strategies as well as my upbringing at Oracle – the data strategy and AI strategy are co-dependent and cannot be separated. Very often I hear from clients that they think they first need to bring their data in order before doing AI project. And yes, without good data access, AI cannot really work. In fact, most of the time spent on AI is spent on processing, cleansing, understanding and contextualizing the data. However, you cannot really know what data will be needed in which form without knowing what you want to use it for. This is why strategies that handle data and AI separately mostly fail and generate huge costs.

Data Science Blog: What are the important steps for developing a good data strategy? Is there something like a general approach?

In my eyes, the AI strategy defines the data strategy step by step as more use cases are implemented. Rather than focusing too quickly at how to get all corporate data into a data lake, it will be much more important to start creating a use-case, technology and data governance. This governance has to be established once the AI strategy is starting to mature to enable the scale up and productization. At the beginning is to find the (very few) use-cases that can serve as light house projects to demonstrate (1) value impact, (2) a way to go from MVP to Pilot, and (3) how to address the data challenge. This will then more naturally identify the elements of governance, data access and technology that are required.

Data Science Blog: What are the most common questions from business leaders to you regarding AI? Why do they hesitate to get started?

By far it the most common question I get is: how do I get started? The hesitations often come from multiple sources like: “We don’t have the talent in house to do AI”, “Our data is not good enough”, “We don’t know which use-case to start with”, “It’s not easy for us to embrace agile and failure culture because our products are mission critical”, “We don’t know how much value this can bring us”.

Data Science Blog: Most managers prefer to start small and with lower risk. They seem to postpone bigger ideas to a later stage, at least some milestones should be reached. Is that a good idea or should they think bigger?

AI is often associated (rightfully so) with a new way of working – agile and embracing failures. Similarly, there is also the perception of significant cost to starting with AI (talent, technology, data). These perceptions often lead managers wanting to start with several smaller ambition use-cases where failure isn’t that grave. Once they have proven itself somehow, they would then move on to bigger projects. The problem with this strategy is on the one side that you fragment your few precious AI resources on too many projects and at the same time you cannot really demonstrate an impact since the projects weren’t chosen based on their impact potential.

The AI pioneers typically were successful by “thinking big, starting small and scaling fast”. You start by assessing the value potential of a use-case, for example: my current OEE (Overall Equipment Efficiency) is at 65%. There is an addressable loss of 25% which would grow my top line by $X. With the help of AI experts, you then create a hypothesis of how you think you can reduce that loss. This might be by choosing one specific equipment and 50% of the addressable loss. This is now the measure against which you define your failure or non-failure criteria. Once you have proven an MVP that can solve this loss, you scale up by piloting it in real-life setting and then scaling it to all the equipment. At every step of this process, you have a failure criterion that is measured by the impact value.


Virtual Edition, 11-12 MAY, 2020

The premier machine learning
conference for industry 4.0

This year Predictive Analytics World for Industry 4.0 runs alongside Deep Learning World and Predictive Analytics World for Healthcare.

Interview – Predictive Maintenance and how it can unleash cost savings

Interview with Dr. Kai Goebel, Principal Scientist at PARC, a Xerox Company, about Predictive Maintenance and how it can unleash cost savings.

Dr. Kai Goebel is principal scientist as PARC with more than two decades experience in corporate and government research organizations. He is responsible for leading applied research on state awareness, prognostics and decision-making using data analytics, AI, hybrid methods and physics-base methods. He has also fielded numerous applications for Predictive Maintenance at General Electric, NASA, and PARC for uses as diverse as rocket launchpads, jet engines, and chemical plants.

Data Science Blog: Mr. Goebel, predictive maintenance is not just a hype since industrial companies are already trying to establish this use case of predictive analytics. What benefits do they really expect from it?

Predictive Maintenance is a good example for how value can be realized from analytics. The result of the analytics drives decisions about when to schedule maintenance in advance of an event that might cause unexpected shutdown of the process line. This is in contrast to an uninformed process where the decision is mostly reactive, that is, maintenance is scheduled because equipment has already failed. It is also in contrast to a time-based maintenance schedule. The benefits of Predictive Maintenance are immediately clear: one can avoid unexpected downtime, which can lead to substantial production loss. One can manage inventory better since lead times for equipment replacement can be managed well. One can also manage safety better since equipment health is understood and safety averse situations can potentially be avoided. Finally, maintenance operations will be inherently more efficient as they shift significant time from inspection to mitigation of.

Data Science Blog: What are the most critical success factors for implementing predictive maintenance?

Critical for success is to get the trust of the operator. To that end, it is imperative to understand the limitations of the analytics approach and to not make false performance promises. Often, success factors for implementation hinge on understanding the underlying process and the fault modes reasonably well. It is important to be able to recognize the difference between operational changes and abnormal conditions. It is equally important to recognize rare events reliably while keeping false positives in check.

Data Science Blog: What kind of algorithm does predictive maintenance work with? Do you differentiate between approaches based on classical machine learning and those based on deep learning?

Well, there is no one kind of algorithm that works for Predictive Mantenance everywhere. Instead, one should look at the plurality of all algorithms as tools in a toolbox. Then analyze the problem – how many examples for run-to-failure trajectories are there; what is the desired lead time to report on a problem; what is the acceptable false positive/false negative rate; what are the different fault modes; etc – and use the right kind of tool to do the job. Just because a particular approach (like the one you mentioned in your question) is all the hype right now does not mean it is the right tool for the problem. Sometimes, approaches from what you call “classical machine learning” actually work better. In fact, one should consider approaches even outside the machine learning domain, either as stand-alone approach as in a hybrid configuration. One may also have to invent new methods, for example to perform online learning of the dynamic changes that a system undergoes through its (long) life. In the end, a customer does not care about what approach one is using, only if it solves the problem.

Data Science Blog: There are several providers for predictive analytics software. Is it all about software tools? What makes the difference for having success?

Frequently, industrial partners lament that they have to spend a lot of effort in teaching a new software provider about the underlying industrial processes as well as the equipment and their fault modes. Others are tired of false promises that any kind of data (as long as you have massive amounts of it) can produce any kind of performance. If one does not physically sense a certain modality, no algorithmic magic can take place. In other words, it is not just all about the software. The difference for having success is understanding that there is no cookie cutter approach. And that realization means that one may have to role up the sleeves and to install new instrumentation.

Data Science Blog: What are coming trends? What do you think will be the main topic 2020 and 2021?

Predictive Maintenance is slowly evolving towards Prescriptive Maintenance. Here, one does not only seek to inform about an impending problem, but also what to do about it. Such an approach needs to integrate with the logistics element of an organization to find an optimal decision that trades off several objectives with regards to equipment uptime, process quality, repair shop loading, procurement lead time, maintainer availability, safety constraints, contractual obligations, etc.