Simple RNN

Understanding LSTM forward propagation in two ways

*This article is only for the sake of understanding the equations in the second page of the paper named “LSTM: A Search Space Odyssey”. If you have no trouble understanding the equations of LSTM forward propagation, I recommend you to skip this article and go the the next article.

1. Preface

I  heard that in Western culture, smart people write textbooks so that other normal people can understand difficult stuff, and that is why textbooks in Western countries tend to be bulky, but also they are not so difficult as they look. On the other hand in Asian culture, smart people write puzzling texts on esoteric topics, and normal people have to struggle to understand what noble people wanted to say. Publishers also require the authors to keep the texts as short as possible, so even though the textbooks are thin, usually students have to repeat reading the textbooks several times because usually they are too abstract.

Both styles have cons and pros, and usually I prefer Japanese textbooks because they are concise, and sometimes it is annoying to read Western style long texts with concrete straightforward examples to reach one conclusion. But a problem is that when it comes to explaining LSTM, almost all the text books are like Asian style ones. Every study material seems to skip the proper steps necessary for “normal people” to understand its algorithms. But after actually making concrete slides on mathematics on LSTM, I understood why: if you write down all the equations on LSTM forward/back propagation, that is going to be massive, and actually I had to make 100-page PowerPoint animated slides to make it understandable to people like me.

I already had a feeling that “Does it help to understand only LSTM with this precision? I should do more practical codings.” For example François Chollet, the developer of Keras, in his book, said as below.


For me that sounds like “We have already implemented RNNs for you, so just shut up and use Tensorflow/Keras.” Indeed, I have never cared about the architecture of my Mac Book Air, but I just use it every day, so I think he is to the point. To make matters worse, for me, a promising algorithm called Transformer seems to be replacing the position of LSTM in natural language processing. But in this article series and in my PowerPoint slides, I tried to explain as much as possible, contrary to his advice.

But I think, or rather hope,  it is still meaningful to understand this 23-year-old algorithm, which is as old as me. I think LSTM did build a generation of algorithms for sequence data, and actually Sepp Hochreiter, the inventor of LSTM, has received Neural Network Pioneer Award 2021 for his work.

I hope those who study sequence data processing in the future would come to this article series, and study basics of RNN just as I also study classical machine learning algorithms.

 *In this article “Densely Connected Layers” is written as “DCL,” and “Convolutional Neural Network” as “CNN.”

2. Why LSTM?

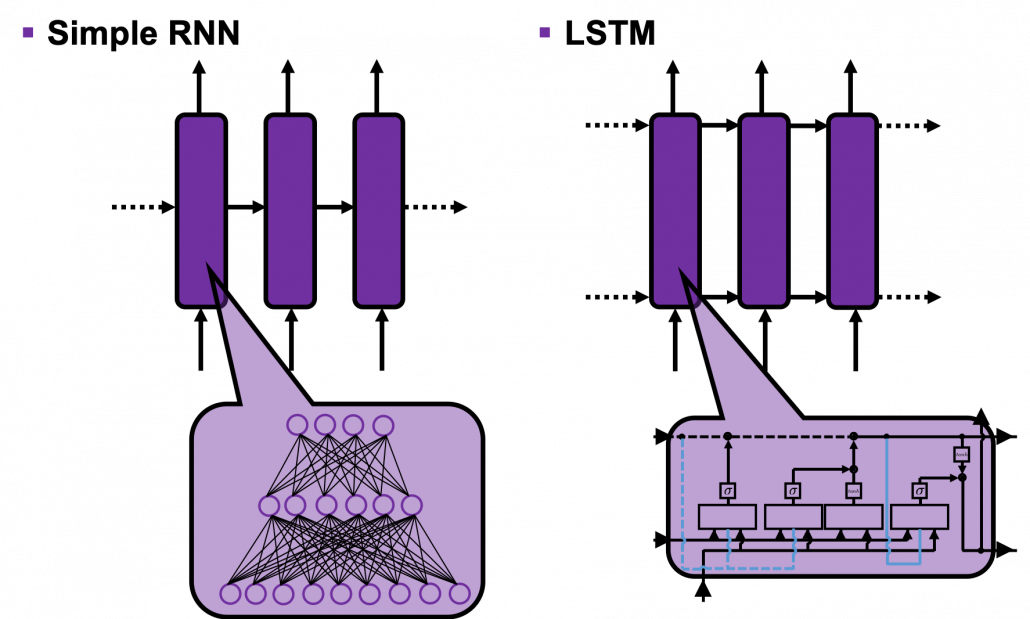
First of all, let’s take a brief look at what I said about the structures of RNNs,  in the first and the second article. A simple RNN is basically densely connected network with a few layers. But the RNN gets an input every time step, and it gives out an output at the time step. Part of information in the middle layer are succeeded to the next time step, and in the next time step, the RNN also gets an input and gives out an output. Therefore, virtually a simple RNN behaves almost the same way as densely connected layers with many layers during forward/back propagation if you focus on its recurrent connections.
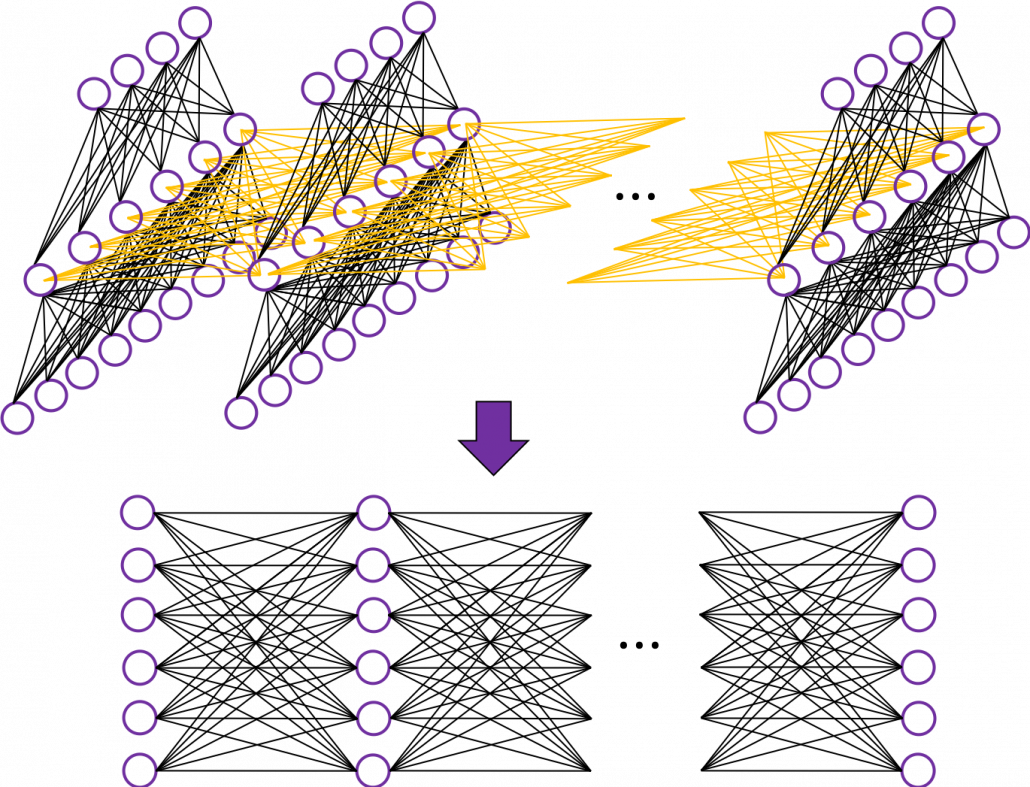
That is why simple RNNs suffer from vanishing/exploding gradient problems, where the information exponentially vanishes or explodes when its gradients are multiplied many times through many layers during back propagation. To be exact, I think you need to consider this problem precisely like you can see in this paper. But for now, please at least keep it in mind that when you calculate a gradient of an error function with respect to parameters of simple neural networks, you have to multiply parameters many times like below, and this type of calculation usually leads to vanishing/exploding gradient problem.

LSTM was invented as a way to tackle such problems as I mentioned in the last article.

3. How to display LSTM

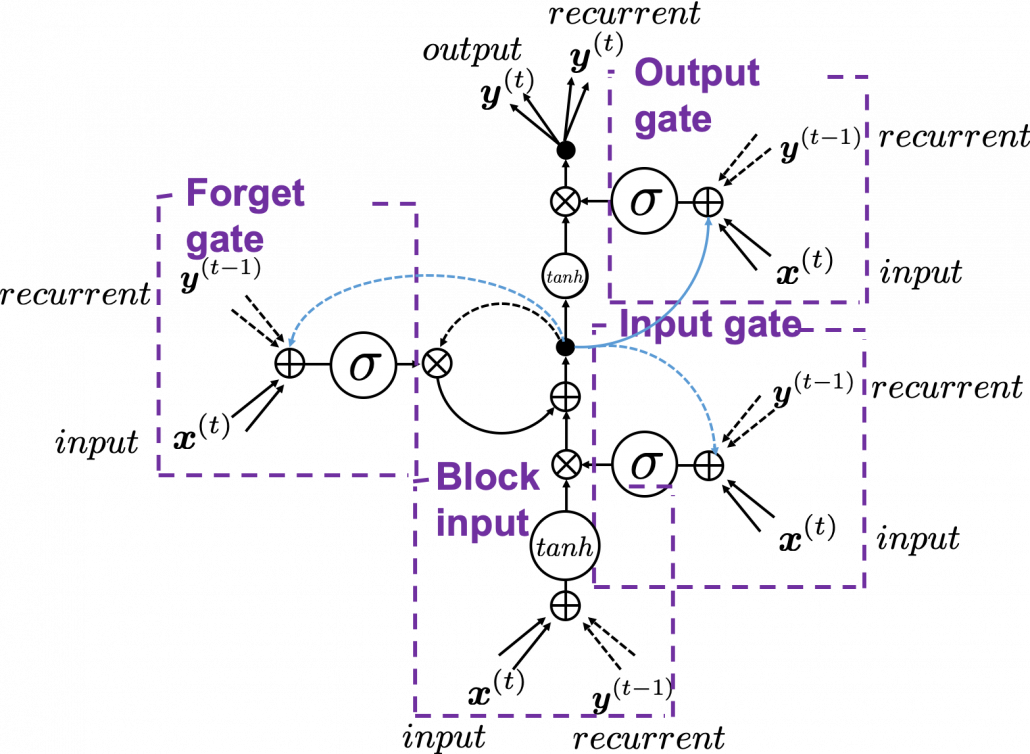
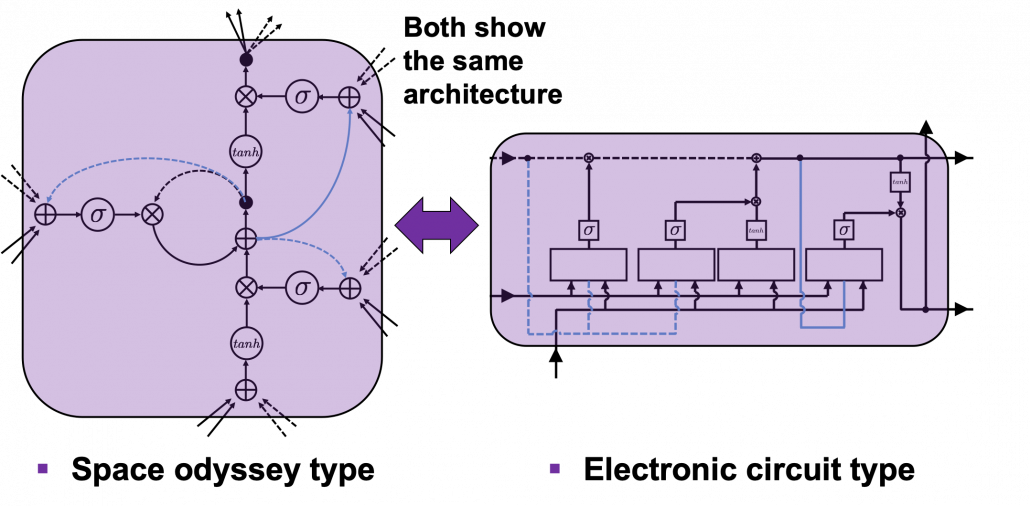
I would like you to just go to image search on Google, Bing, or Yahoo!, and type in “LSTM.” I think you will find many figures, but basically LSTM charts are roughly classified into two types: in this article I call them “Space Odyssey type” and “electronic circuit type”, and in conclusion, I highly recommend you to understand LSTM as the “electronic circuit type.”

*I just randomly came up with the terms “Space Odyssey type” and “electronic circuit type” because the former one is used in the paper I mentioned, and the latter one looks like an electronic circuit to me. You do not have to take how I call them seriously.

However, not that all the well-made explanations on LSTM use the “electronic circuit type,” and I am sure you sometimes have to understand LSTM as the “space odyssey type.” And the paper “LSTM: A Search Space Odyssey,” which I learned a lot about LSTM from,  also adopts the “Space Odyssey type.”

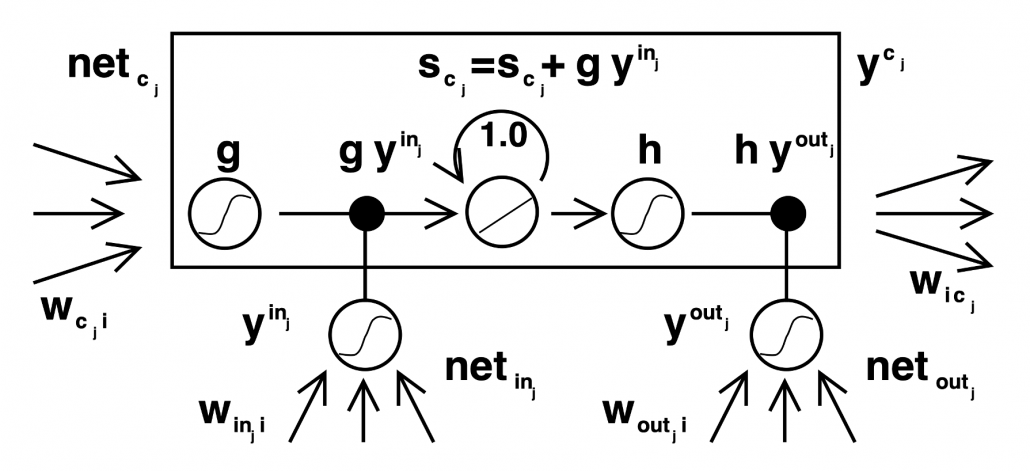
LSTM architectur visualization

The main reason why I recommend the “electronic circuit type” is that its behaviors look closer to that of simple RNNs, which you would have seen if you read my former articles.

*Behaviors of both of them look different, but of course they are doing the same things.

If you have some understanding on DCL, I think it was not so hard to understand how simple RNNs work because simple RNNs  are mainly composed of linear connections of neurons and weights, whose structures are the same almost everywhere. And basically they had only straightforward linear connections as you can see below.

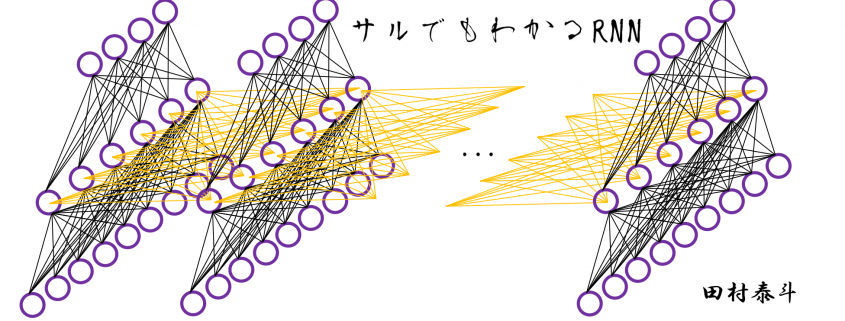
But from now on, I would like you to give up the ideas that LSTM is composed of connections of neurons like the head image of this article series. If you do that, I think that would be chaotic and I do not want to make a figure of it on Power Point. In short, sooner or later you have to understand equations of LSTM.

4. Forward propagation of LSTM in “electronic circuit type”

*For further understanding of mathematics of LSTM forward/back propagation, I recommend you to download my slides.

The behaviors of an LSTM block is quite similar to that of a simple RNN block: an RNN block gets an input every time step and gets information from the RNN block of the last time step, via recurrent connections. And the block succeeds information to the next block.

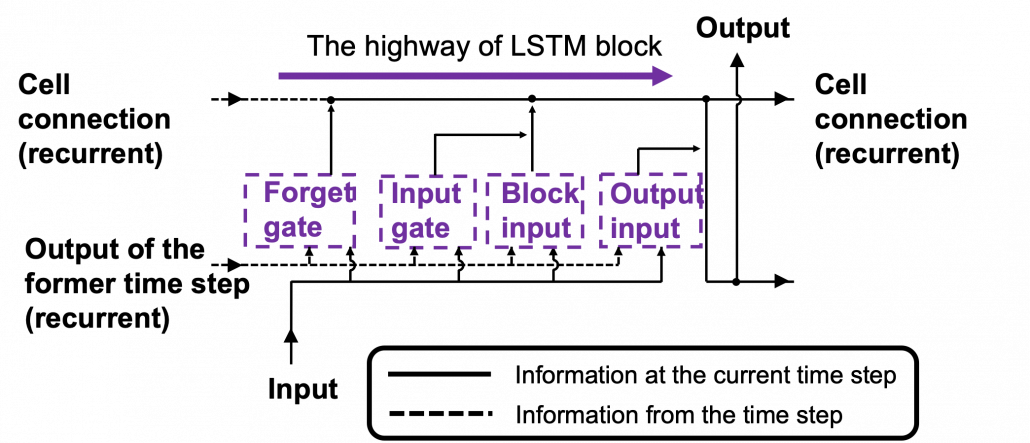
Let’s look at the simplified architecture of  an LSTM block. First of all, you should keep it in mind that LSTM have two streams of information: the one going through all the gates, and the one going through cell connections, the “highway” of LSTM block. For simplicity, we will see the architecture of an LSTM block without peephole connections, the lines in blue. The flow of information through cell connections is relatively uninterrupted. This helps LSTMs to retain information for a long time.

In a LSTM block, the input and the output of the former time step separately go through sections named “gates”: input gate, forget gate, output gate, and block input. The outputs of the forget gate, the input gate, and the block input join the highway of cell connections to renew the value of the cell.

*The small two dots on the cell connections are the “on-ramp” of cell conection highway.

*You would see the terms “input gate,” “forget gate,” “output gate” almost everywhere, but how to call the “block gate” depends on textbooks.

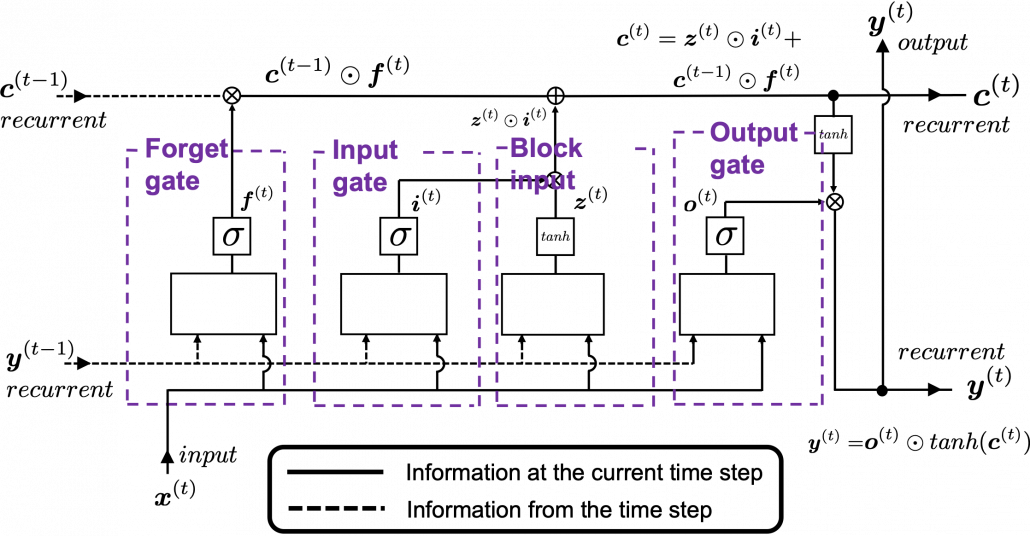
Let’s look at the structure of an LSTM block a bit more concretely. An LSTM block at the time step (t) gets \boldsymbol{y}^{(t-1)}, the output at the last time step,  and \boldsymbol{c}^{(t-1)}, the information of the cell at the time step (t-1), via recurrent connections. The block at time step (t) gets the input \boldsymbol{x}^{(t)}, and it separately goes through each gate, together with \boldsymbol{y}^{(t-1)}. After some calculations and activation, each gate gives out an output. The outputs of the forget gate, the input gate, the block input, and the output gate are respectively \boldsymbol{f}^{(t)}, \boldsymbol{i}^{(t)}, \boldsymbol{z}^{(t)}, \boldsymbol{o}^{(t)}. The outputs of the gates are mixed with \boldsymbol{c}^{(t-1)} and the LSTM block gives out an output \boldsymbol{y}^{(t)}, and gives \boldsymbol{y}^{(t)} and \boldsymbol{c}^{(t)} to the next LSTM block via recurrent connections.

You calculate \boldsymbol{f}^{(t)}, \boldsymbol{i}^{(t)}, \boldsymbol{z}^{(t)}, \boldsymbol{o}^{(t)} as below.

  • \boldsymbol{f}^{(t)}= \sigma(\boldsymbol{W}_{for} \boldsymbol{x}^{(t)} + \boldsymbol{R}_{for} \boldsymbol{y}^{(t-1)} +  \boldsymbol{b}_{for})
  • \boldsymbol{i}^{(t)}=\sigma(\boldsymbol{W}_{in} \boldsymbol{x}^{(t)} + \boldsymbol{R}_{in} \boldsymbol{y}^{(t-1)} + \boldsymbol{b}_{in})
  • \boldsymbol{z}^{(t)}=tanh(\boldsymbol{W}_z \boldsymbol{x}^{(t)} + \boldsymbol{R}_z \boldsymbol{y}^{(t-1)} + \boldsymbol{b}_z)
  • \boldsymbol{o}^{(t)}=\sigma(\boldsymbol{W}_{out} \boldsymbol{x}^{(t)} + \boldsymbol{R}_{out} \boldsymbol{y}^{(t-1)} + \boldsymbol{b}_{out})

*You have to keep it in mind that the equations above do not include peephole connections, which I am going to show with blue lines in the end.

The equations above are quite straightforward if you understand forward propagation of simple neural networks. You add linear products of \boldsymbol{y}^{(t)} and \boldsymbol{c}^{(t)} with different weights in each gate. What makes LSTMs different from simple RNNs is how to mix the outputs of the gates with the cell connections. In order to explain that, I need to introduce a mathematical operator called Hadamard product, which you denote as \odot. This is a very simple operator. This operator produces an elementwise product of two vectors or matrices with identical shape.

With this Hadamar product operator, the renewed cell and the output are calculated as below.

  • \boldsymbol{c}^{(t)} = \boldsymbol{z}^{(t)}\odot \boldsymbol{i}^{(t)} + \boldsymbol{c}^{(t-1)} \odot \boldsymbol{f}^{(t)}
  • \boldsymbol{y}^{(t)} = \boldsymbol{o}^{(t)} \odot tanh(\boldsymbol{c}^{(t)})

The values of \boldsymbol{f}^{(t)}, \boldsymbol{i}^{(t)}, \boldsymbol{z}^{(t)}, \boldsymbol{o}^{(t)} are compressed into the range of [0, 1] or [-1, 1] with activation functions. You can see that the input gate and the block input give new information to the cell. The part \boldsymbol{c}^{(t-1)} \odot \boldsymbol{f}^{(t)} means that the output of the forget gate “forgets” the cell of the last time step by multiplying the values from 0 to 1 elementwise. And the cell \boldsymbol{c}^{(t)} is activated with tanh() and the output of the output gate “suppress” the activated value of \boldsymbol{c}^{(t)}. In other words, the output gatedecides how much information to give out as an output of the LSTM block. The output of every gate depends on the input \boldsymbol{x}^{(t)}, and the recurrent connection \boldsymbol{y}^{(t-1)}. That means an LSTM block learns to forget the cell of the last time step, to renew the cell, and to suppress the output. To describe in an extreme manner, if all the outputs of every gate are always (1, 1, …1)^T, LSTMs forget nothing, retain information of inputs at every time step, and gives out everything. And  if all the outputs of every gate are always (0, 0, …0)^T, LSTMs forget everything, receive no inputs, and give out nothing.

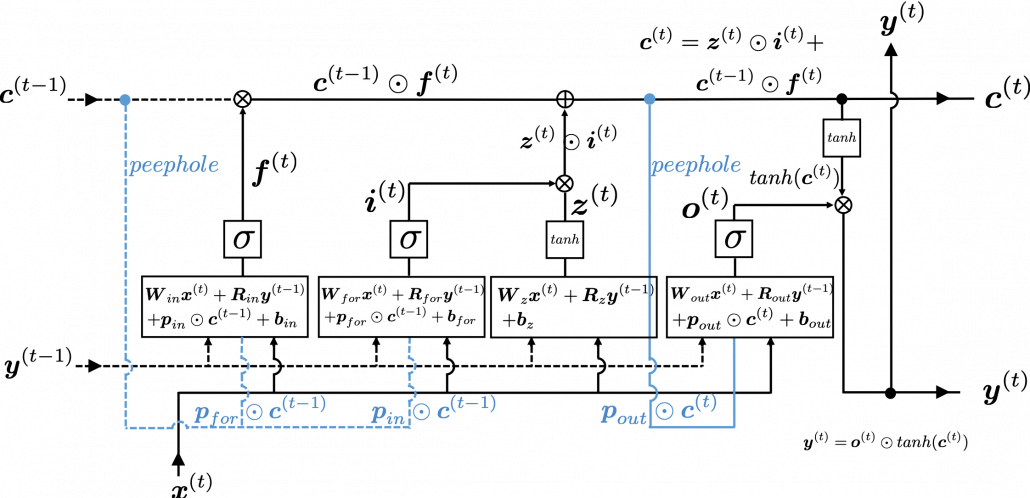
This model has one problem: the outputs of each gate do not directly depend on the information in the cell. To solve this problem, some LSTM models introduce some flows of information from the cell to each gate, which are shown as lines in blue in the figure below.

LSTM inner architecture

LSTM models, for example the one with or without peephole connection, depend on the library you use, and the model I have showed is one of standard LSTM structure. However no matter how complicated structure of an LSTM block looks, you usually cover it with a black box as below and show its behavior in a very simplified way.

5. Space Odyssey type

I personally think there is no advantages of understanding how LSTMs work with this Space Odyssey type chart, but in several cases you would have to use this type of chart. So I will briefly explain how to look at that type of chart, based on understandings of LSTMs you have gained through this article.

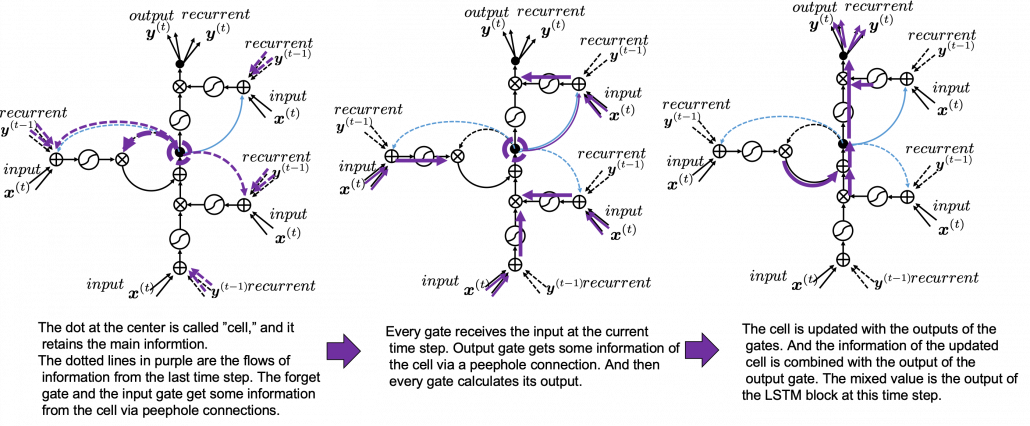
In Space Odyssey type of LSTM chart, at the center is a cell. Electronic circuit type of chart, which shows the flow of information of the cell as an uninterrupted “highway” in an LSTM block. On the other hand, in a Spacey Odyssey type of chart, the information of the cell rotate at the center. And each gate gets the information of the cell through peephole connections,  \boldsymbol{x}^{(t)}, the input at the time step (t) , sand \boldsymbol{y}^{(t-1)}, the output at the last time step (t-1), which came through recurrent connections. In Space Odyssey type of chart, you can more clearly see that the information of the cell go to each gate through the peephole connections in blue. Each gate calculates its output.

Just as the charts you have seen, the dotted line denote the information from the past. First, the information of the cell at the time step (t-1) goes to the forget gate and get mixed with the output of the forget cell In this process the cell is partly “forgotten.” Next, the input gate and the block input are mixed to generate part of new value of the the cell at time step  (t). And the partly “forgotten” \boldsymbol{c}^{(t-1)} goes back to the center of the block and it is mixed with the output of the input gate and the block input. That is how \boldsymbol{c}^{(t)} is renewed. And the value of new cell flow to the top of the chart, being mixed with the output of the output gate. Or you can also say the information of new cell is “suppressed” with the output gate.

I have finished the first four articles of this article series, and finally I am gong to write about back propagation of LSTM in the next article. I have to say what I have written so far is all for the next article, and my long long Power Point slides.


[References]

[1] Klaus Greff, Rupesh Kumar Srivastava, Jan Koutník, Bas R. Steunebrink, Jürgen Schmidhuber, “LSTM: A Search Space Odyssey,” (2017)

[2] Francois Chollet, Deep Learning with Python,(2018), Manning , pp. 202-204

[3] “Sepp Hochreiter receives IEEE CIS Neural Networks Pioneer Award 2021”, Institute of advanced research in artificial intelligence, (2020)
URL: https://www.iarai.ac.at/news/sepp-hochreiter-receives-ieee-cis-neural-networks-pioneer-award-2021/?fbclid=IwAR27cwT5MfCw4Tqzs3MX_W9eahYDcIFuoGymATDR1A-gbtVmDpb8ExfQ87A

[4] Oketani Takayuki, “Machine Learning Professional Series: Deep Learning,” (2015), pp. 120-125
岡谷貴之 著, 「機械学習プロフェッショナルシリーズ 深層学習」, (2015), pp. 120-125

[5] Harada Tatsuya, “Machine Learning Professional Series: Image Recognition,” (2017), pp. 252-257
原田達也 著, 「機械学習プロフェッショナルシリーズ 画像認識」, (2017), pp. 252-257

[6] “Understandable LSTM ~ With the Current Trends,” Qiita, (2015)
「わかるLSTM ~ 最近の動向と共に」, Qiita, (2015)
URL: https://qiita.com/t_Signull/items/21b82be280b46f467d1b

Simple RNN

A brief history of neural nets: everything you should know before learning LSTM

This series is not a college course or something on deep learning with strict deadlines for assignments, so let’s take a detour from practical stuff and take a brief look at the history of neural networks.

The history of neural networks is also a big topic, which could be so long that I had to prepare another article series. And usually I am supposed to begin such articles with something like “The term ‘AI’ was first used by John McCarthy in Dartmouth conference 1956…” but you can find many of such texts written by people with much more experiences in this field. Therefore I am going to write this article from my point of view, as an intern writing articles on RNN, as a movie buff, and as one of many Japanese men who spent a great deal of childhood with video games.

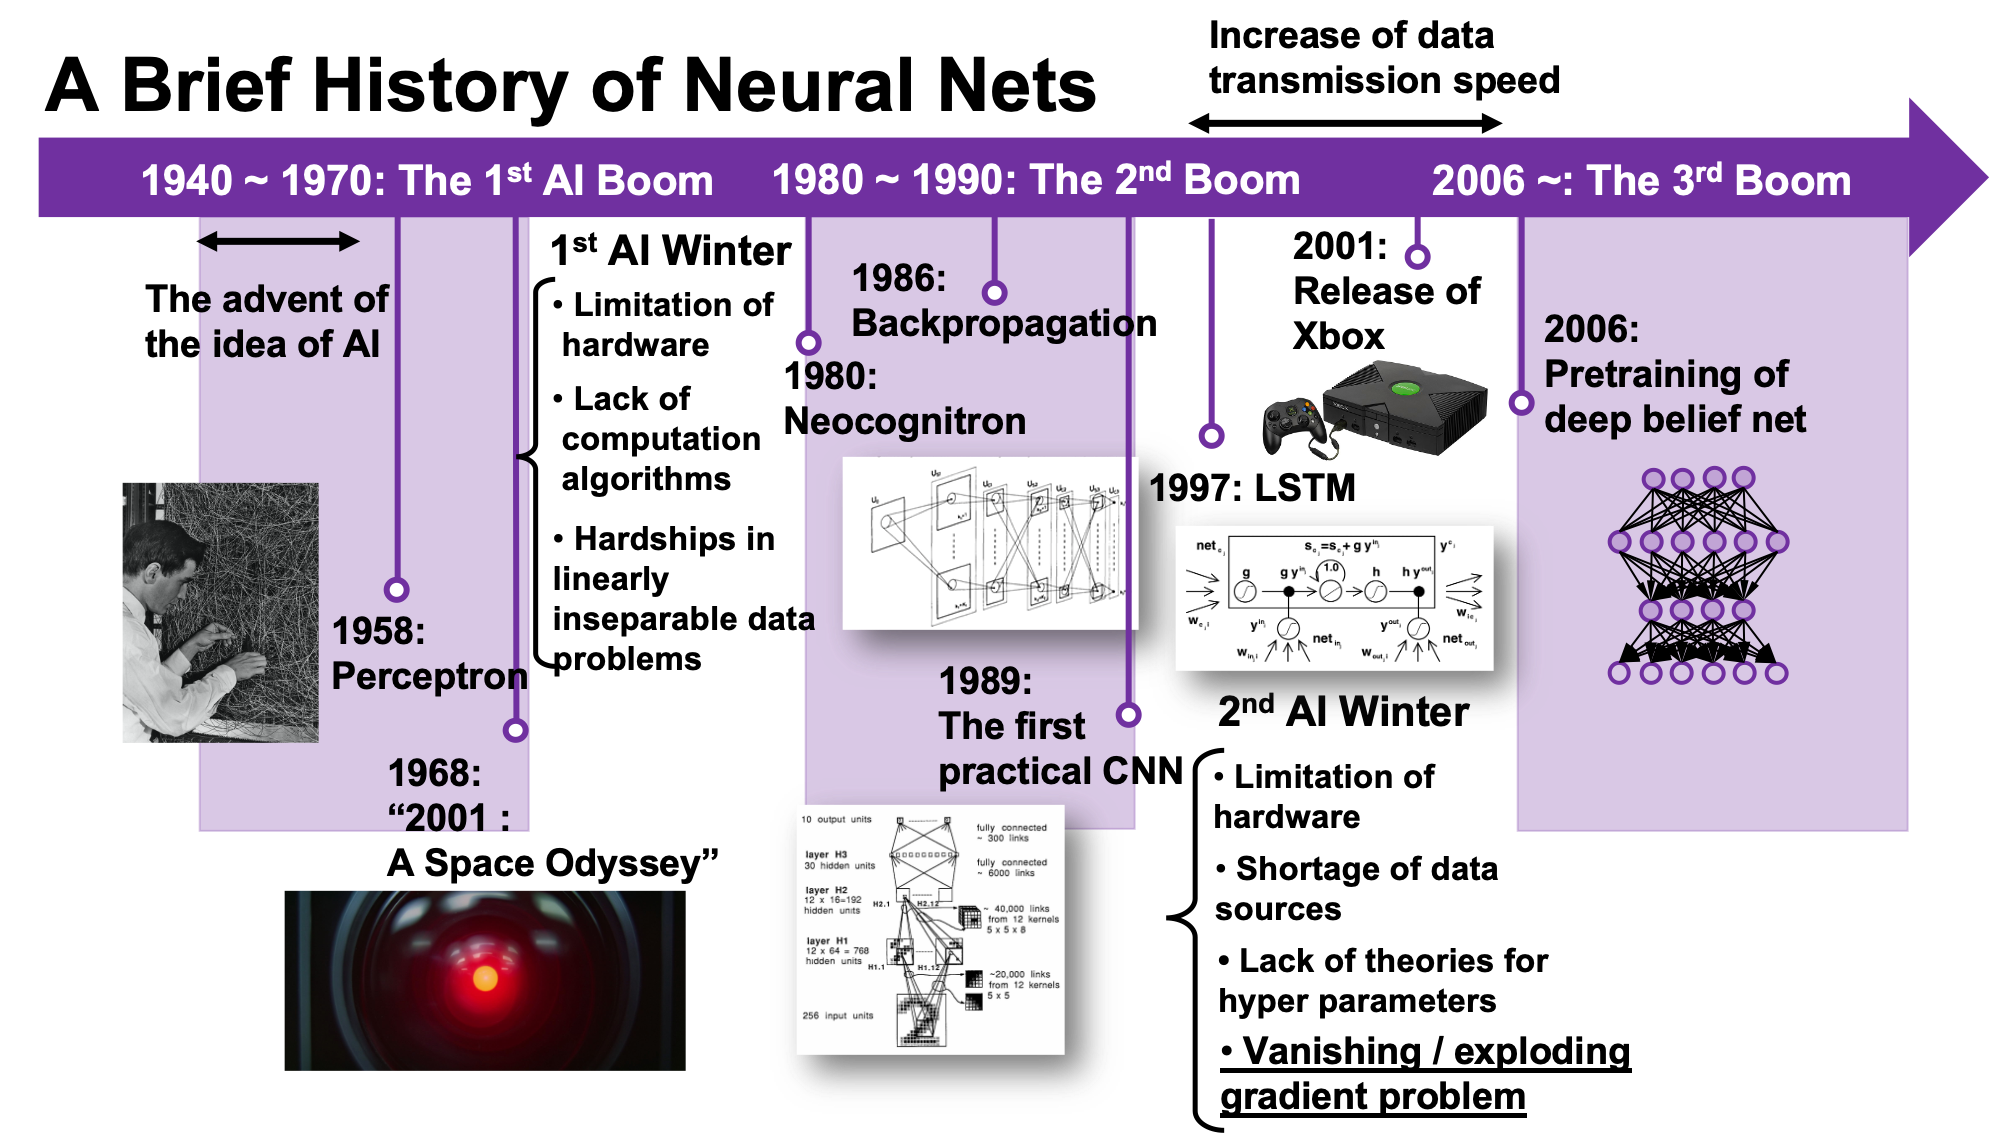
We are now in the third AI boom, and some researchers say this boom began in 2006. A professor in my university said there we are now in a kind of bubble economy in machine learning/data science industry, but people used to say “Stop daydreaming” to AI researchers. The second AI winter is partly due to vanishing/exploding gradient problem of deep learning. And LSTM was invented as one way to tackle such problems, in 1997.

1, First AI boom

In the first AI boom, I think people were literally “daydreaming.” Even though the applications of machine learning algorithms were limited to simple tasks like playing chess, checker, or searching route of 2d mazes, and sometimes this time is called GOFAI (Good Old Fashioned AI).

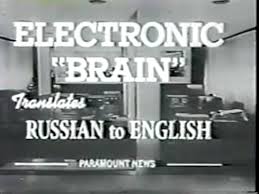
Source: https://www.youtube.com/watch?v=K-HfpsHPmvw&feature=youtu.be

Even today when someone use the term “AI” merely for tasks with neural networks, that amuses me because for me deep learning is just statistically and automatically training neural networks, which are capable of universal approximation, into some classifiers/regressors. Actually the algorithms behind that is quite impressive, but the structure of human brains is much more complicated. The hype of “AI” already started in this first AI boom. Let me take an example of machine translation in this video. In fact the research of machine translation already started in the early 1950s, and of  specific interest in the time was translation between English and Russian due to Cold War. In the first article of this series, I said one of the most famous applications of RNN is machine translation, such as Google Translation, DeepL. They are a type of machine translation called neural machine translation because they use neural networks, especially RNNs. Neural machine translation was an astonishing breakthrough around 2014 in machine translation field. The former major type of machine translation was statistical machine translation, based on statistical language models. And the machine translator in the first AI boom was rule base machine translators, which are more primitive than statistical ones.

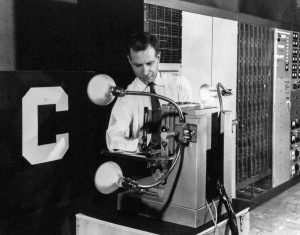
Source: https://news.cornell.edu/stories/2019/09/professors-perceptron-paved-way-ai-60-years-too-soon

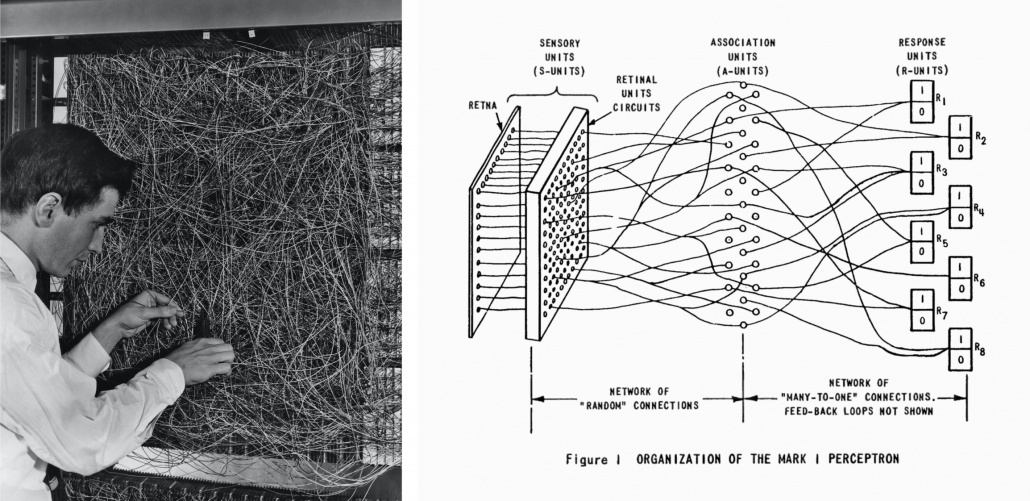
The most remarkable invention in this time was of course perceptron by Frank Rosenblatt. Some people say that this is the first neural network. Even though you can implement perceptron with a-few-line codes in Python, obviously they did not have Jupyter Notebook in those days. The perceptron was implemented as a huge instrument named Mark 1 Perceptron, and it was composed of randomly connected wires. I do not precisely know how it works, but it was a huge effort to implement even the most primitive type of neural networks. They needed to use a big lighting fixture to get a 20*20 pixel image using 20*20 array of cadmium sulphide photocells. The research by Rosenblatt, however, was criticized by Marvin Minsky in his book because perceptrons could only be used for linearly separable data. To make matters worse the criticism prevailed as that more general, multi-layer perceptrons were also not useful for linearly inseparable data (as I mentioned in the first article, multi-layer perceptrons, namely normal neural networks,  can be universal approximators, which have potentials to classify/regress various types of complex data). In case you do not know what “linearly separable” means, imagine that there are data plotted on a piece of paper. If an elementary school kid can draw a border line between two clusters of the data with a ruler and a pencil on the paper, the 2d data is “linearly separable”….

With big disappointments to the research on “electronic brains,” the budget of AI research was reduced and AI research entered its first winter.

Source: https://www.nzz.ch/digital/ehre-fuer-die-deep-learning-mafia-ld.1472761?reduced=true and https://anatomiesofintelligence.github.io/posts/2019-06-21-organization-mark-i-perceptron

I think  the frame problem(1969),  by John McCarthy and Patrick J. Hayes, is also an iconic theory in the end of the first AI boom. This theory is known as a story of creating a robot trying to pull out its battery on a wheeled wagon in a room. The first prototype of the robot, named R1, naively tried to pull out the wagon form the room, and the bomb exploded. The problems was obvious: R1 was not programmed to consider the risks by taking each action, so the researchers made the next prototype named R1D1, which was programmed to consider the potential risks of taking each action. When R1D1 tried to pull out the wagon, it realized the risk of pulling the bomb together with the battery. But soon it started considering all the potential risks, such as the risk of the ceiling falling down, the distance between the wagon and all the walls, and so on, when the bomb exploded. The next problem was also obvious: R1D1 was not programmed to distinguish if the factors are relevant of irrelevant to the main purpose, and the next prototype R2D1 was programmed to do distinguish them. This time, R2D1 started thinking about “whether the factor is  irrelevant to the main purpose,” on every factor measured, and again the bomb exploded. How can we get a perfect AI, R2D2?

The situation of mentioned above is a bit extreme, but it is said AI could also get stuck when it try to take some super simple actions like finding a number in a phone book and make a phone call. It is difficult for an artificial intelligence to decide what is relevant and what is irrelevant, but humans will not get stuck with such simple stuff, and sometimes the frame problem is counted as the most difficult and essential problem of developing AI. But personally I think the original frame problem was unreasonable in that McCarthy, in his attempts to model the real world, was inflexible in his handling of the various equations involved, treating them all with equal weight regardless of the particular circumstances of a situation. Some people say that McCarthy, who was an advocate for AI, also wanted to see the field come to an end, due to its failure to meet the high expectations it once aroused.

Not only the frame problem, but also many other AI-related technological/philosophical problems have been proposed, such as Chinese room (1980), the symbol grounding problem (1990), and they are thought to be as hardships in inventing artificial intelligence, but I omit those topics in this article.

*The name R2D2 did not come from the famous story of frame problem. The story was Daniel Dennett first proposed the story of R2D2 in his paper published in 1984. Star Wars was first released in 1977. It is said that the name R2D2 came from “Reel 2, Dialogue 2,” which George Lucas said while film shooting. And the design of C3PO came from Maria in Metropolis(1927). It is said that the most famous AI duo in movie history was inspired by Tahei and Matashichi in The Hidden Fortress(1958), directed by Kurosawa Akira.

Source: https://criterioncollection.tumblr.com/post/135392444906/the-original-r2-d2-and-c-3po-the-hidden-fortress

Interestingly, in the end of the first AI boom, 2001: A Space Odyssey, directed by Stanley Kubrick, was released in 1968. Unlike conventional fantasylike AI characters, for example Maria in Metropolis(1927), HAL 9000 was portrayed as a very realistic AI, and the movie already pointed out the risk of AI being insane when it gets some commands from several users. HAL 9000 still has been a very iconic character in AI field. For example when you say some quotes from 2001: A Space Odyssey to Siri you get some parody responses. I also thin you should keep it in mind that in order to make an AI like HAL 9000 come true, for now RNNs would be indispensable in many ways: you would need RNNs for better voice recognition, better conversational system, and for reading lips.

Source: https://imgflip.com/memetemplate/34339860/Open-the-pod-bay-doors-Hal

*Just as you cannot understand Monty Python references in Python official tutorials without watching Monty Python and the Holy Grail, you cannot understand many parodies in AI contexts without watching 2001: A Space Odyssey. Even though the movie had some interview videos with some researchers and some narrations, Stanley Kubrick cut off all the footage and made the movie very difficult to understand. Most people did not or do not understand that it is a movie about aliens who gave homework of coming to Jupiter to human beings.

2, Second AI boom/winter

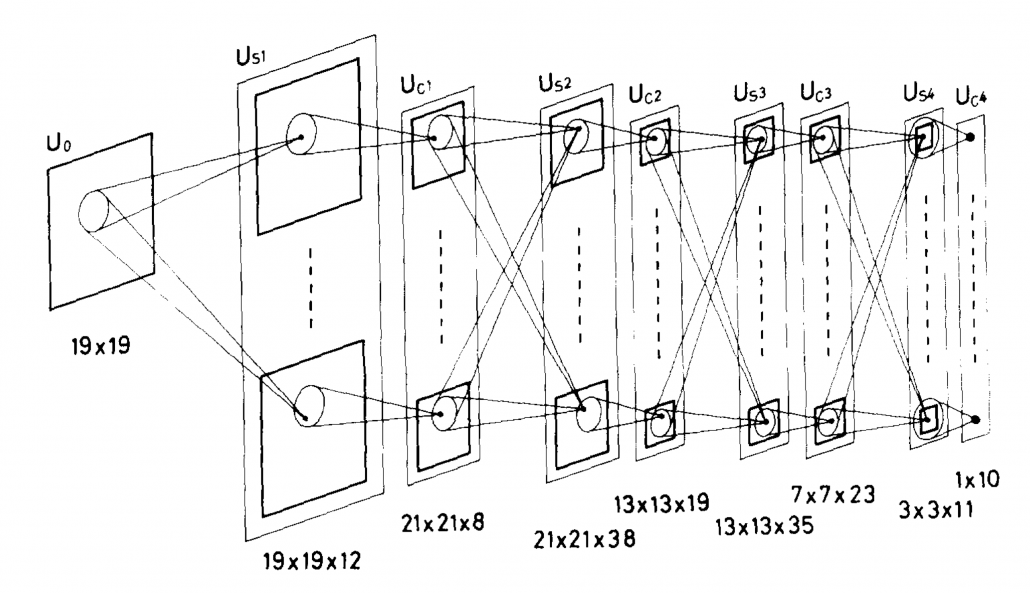
Source: Fukushima Kunihiko, “Neocognitron: A self-organizing neural network model for a mechanism of pattern recognition unaffected by shift in position,” (1980)

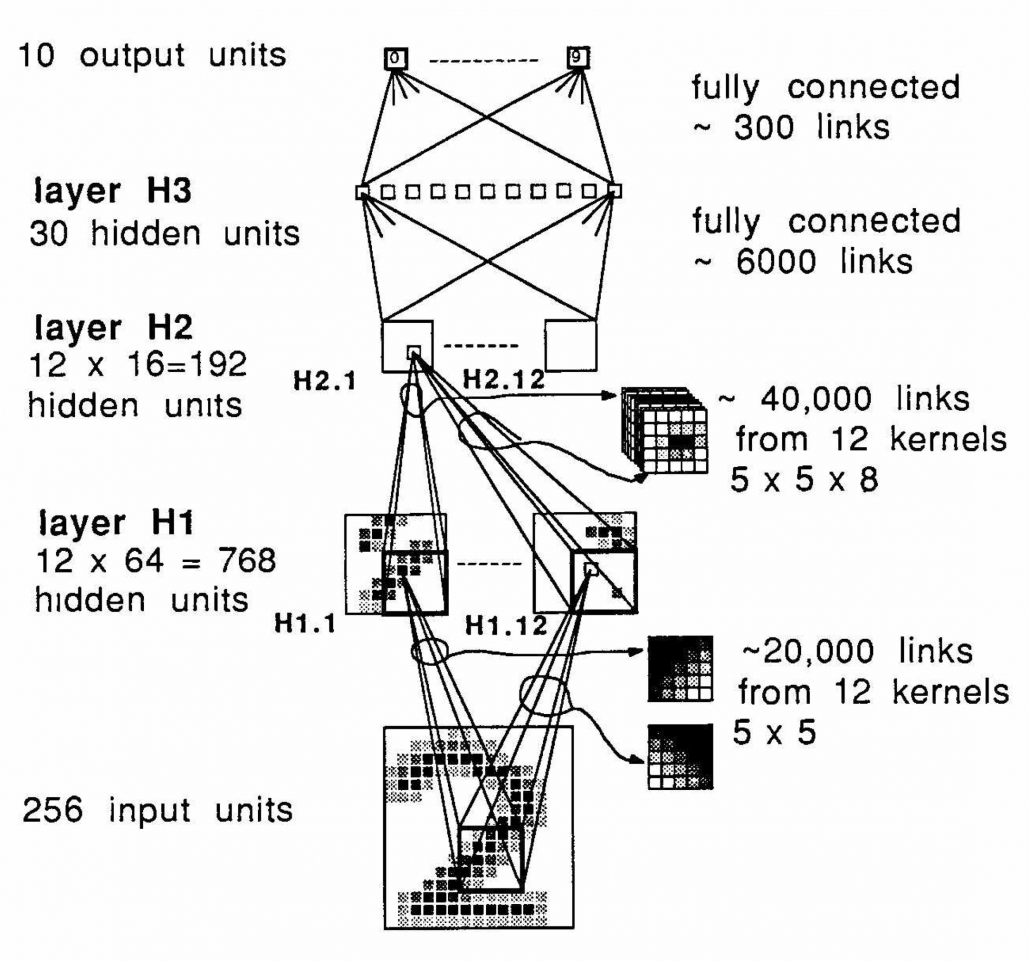
I am not going to write about the second AI boom in detail, but at least you should keep it in mind that convolutional neural network(CNN) is a keyword in this time. Neocognitron, an artificial model of how sight nerves perceive thing, was invented by Kunihiko Fukushima in 1980, and the model is said to be the origin on CNN. And Neocognitron got inspired by the Hubel and Wiesel’s research on sight nerves. In 1989, a group in AT & T Bell Laboratory led by Yann LeCun invented the first practical CNN to read handwritten digit.

Y. LeCun, “Backpropagation Applied to Handwritten Zip Code Recognition,” (1989)

Another turning point in this second AI boom was that back propagation algorithm was discovered, and the CNN by LeCun was also trained with back propagation. LeCun made a deep neural networks with some layers in 1998 for more practical uses.

But his research did not gain so much attention like today, because AI research entered its second winter at the beginning of the 1990s, and that was partly due to vanishing/exploding gradient problem of deep learning. People knew that neural networks had potentials of universal approximation, but when they tried to train naively stacked neural nets, the gradients, which you need for training neural networks, exponentially increased/decreased. Even though the CNN made by LeCun was the first successful case of “deep” neural nets which did not suffer from the vanishing/exploding gradient problem so much, deep learning research also stagnated in this time.

The ultimate goal of this article series is to understand LSTM at a more abstract/mathematical level because it is one of the practical RNNs, but the idea of LSTM (Long Short Term Memory) itself was already proposed in 1997 as an RNN algorithm to tackle vanishing gradient problem. (Exploding gradient problem is solved with a technique named gradient clipping, and this is easier than techniques for preventing vanishing gradient problems. I am also going to explain it in the next article.) After that some other techniques like introducing forget gate, peephole connections, were discovered, but basically it took some 20 years till LSTM got attentions like today. The reasons for that is lack of hardware and data sets, and that was also major reasons for the second AI winter.

Source: Sepp HochreiterJürgen, Schmidhuber, “Long Short-term Memory,” (1997)

In the 1990s, the mid of second AI winter, the Internet started prevailing for commercial uses. I think one of the iconic events in this time was the source codes WWW(World Wide Web) were announced in 1993. Some of you might still remember that you little by little became able to transmit more data online in this time. That means people came to get more and more access to various datasets in those days, which is indispensable for machine learning tasks.

After all, we could not get HAL 9000 by the end of 2001, but instead we got Xbox console.

3, Video game industry and GPU

Even though research on neural networks stagnated in the 1990s the same period witnessed an advance in the computation of massive parallel linear transformations, due to their need in fields such as image processing.

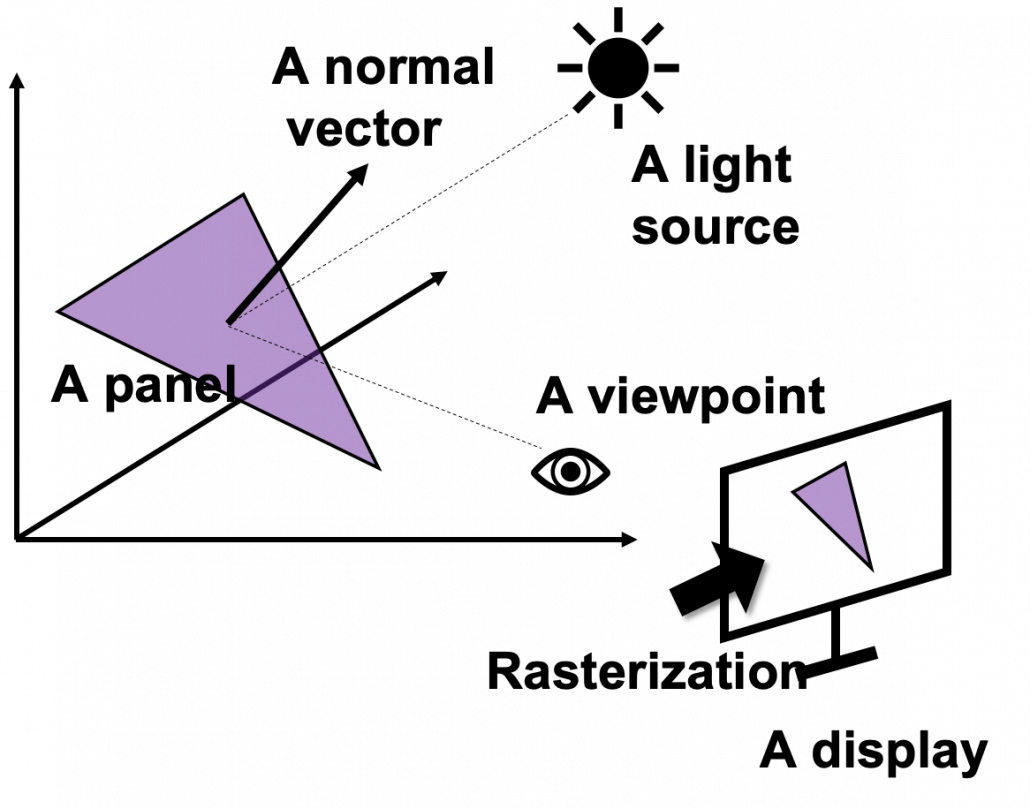
Computer graphics move or rotate in 3d spaces, and that is also linear transformations. When you think about a car moving in a city, it is convenient to place the car, buildings, and other objects on a fixed 3d space. But when you need to make computer graphics of scenes of the city from a view point inside the car, you put a moving origin point in the car and see the city. The spatial information of the city is calculated as vectors from the moving origin point. Of course this is also linear transformations. Of course I am not talking about a dot or simple figures moving in the 3d spaces. Computer graphics are composed of numerous plane panels, and each of them have at least three vertexes, and they move on 3d spaces. Depending on viewpoints, you need project the 3d graphics in 3d spaces on 2d spaces to display the graphics on devices. You need to calculate which part of the panel is projected to which pixel on the display, and that is called rasterization. Plus, in order to get photophotorealistic image, you need to think about how lights from light sources reflect on the panel and projected on the display. And you also have to put some textures on groups of panels. You might also need to change color spaces, which is also linear transformations.

My point is, in short, you really need to do numerous linear transformations in parallel in image processing.

When it comes to the use of CGI in movies,  two pioneer movies were released during this time: Jurassic Park in 1993, and Toy Story in 1995. It is famous that Pixar used to be one of the departments in ILM(Industrial Light and Magic), founded by George Lucas, and Steve Jobs bought the department. Even though the members in Pixar had not even made a long feature film in their lives, after trial and errors, they made the first CGI animated feature movie. On the other hand, in order to acquire funds for the production of Schindler’s List(1993), Steven Spielberg took on Jurassic Park(1993), consequently changing the history of CGI through this “side job.”

Source: http://renderstory.com/jurassic-park-23-years-later/

*I think you have realized that George Lucas is mentioned almost everywhere in this article. His influences on technologies are not only limited to image processing, but also sound measuring system, nonlinear editing system. Photoshop was also originally developed under his company. I need another article series for this topic, but maybe not in Data Science Blog.

Source: https://editorial.rottentomatoes.com/article/5-technical-breakthroughs-in-star-wars-that-changed-movies-forever/

Considering that the first wire-frame computer graphics made and displayed by computers appeared in the scene of displaying the wire frame structure of Death Star in a war room, in Star Wars: A New Hope, the development of CGI was already astonishing at this time. But I think deep learning owe its development more to video game industry.

*I said that the Death Star scene is the first use of graphics made and DISPLAYED by computers, because I have to say one of the first graphics in movie MADE by computer dates back to the legendary title sequence of Vertigo(1958).

When it comes to 3D video games the processing unit has to constantly deal with real time commands from controllers. It is famous that GPU was originally specifically designed for plotting computer graphics. Video game market is the biggest in entertainment industry in general, and it is said that the quality of computer graphics have the strongest correlation with video games sales, therefore enhancing this quality is a priority for the video game console manufacturers.

One good example to see how much video games developed is comparing original Final Fantasy 7 and the remake one. The original one was released in 1997, the same year as when LSTM was invented. And recently  the remake version of Final Fantasy 7 was finally released this year. The original one was also made with very big budget, and it was divided into three CD-ROMs. The original one was also very revolutionary given that the former ones of Final Fantasy franchise were all 2d video retro style video games. But still the computer graphics looks like polygons, and in almost all scenes the camera angle was fixed in the original one. On the other hand the remake one is very photorealistic and you can move the angle of the camera as you want while you play the video game.

There were also fierce battles by graphic processor manufacturers in computer video game market in the 1990s, but personally I think the release of Xbox console was a turning point in the development of GPU. To be concrete, Microsoft adopted a type of NV20 GPU for Xbox consoles, and that left some room of programmability for developers. The chief architect of NV20, which was released under the brand of GeForce3, said making major changes in the company’s graphic chips was very risky. But that decision opened up possibilities of uses of GPU beyond computer graphics.

Source: https://de.wikipedia.org/wiki/Nvidia-GeForce-3-Serie

I think that the idea of a programmable GPU provided other scientific fields with more visible benefits after CUDA was launched. And GPU gained its position not only in deep learning, but also many other fields including making super computers.

*When it comes to deep learning, even GPUs have strong rivals. TPU(Tensor Processing Unit) made by Google, is specialized for deep learning tasks, and have astonishing processing speed. And FPGA(Field Programmable Gate Array), which was originally invented customizable electronic circuit, proved to be efficient for reducing electricity consumption of deep learning tasks.

*I am not so sure about this GPU part. Processing unit, including GPU is another big topic, that is beyond my capacity to be honest.  I would appreciate it if you could share your view and some references to confirm your opinion, on the comment section or via email.

*If you are interested you should see this video of game fans’ reactions to the announcement of Final Fantasy 7. This is the industry which grew behind the development of deep learning, and many fields where you need parallel computations owe themselves to the nerds who spent a lot of money for video games, including me.

*But ironically the engineers who invented the GPU said they did not play video games simply because they were busy. If you try to study the technologies behind video games, you would not have much time playing them. That is the reality.

We have seen that the in this second AI winter, Internet and GPU laid foundation of the next AI boom. But still the last piece of the puzzle is missing: let’s look at the breakthrough which solved the vanishing /exploding gradient problem of deep learning in the next section.

4, Pretraining of deep belief networks: “The Dawn of Deep Learning”

Some researchers say the invention of pretraining of deep belief network by Geoffrey Hinton was a breakthrough which put an end to the last AI winter. Deep belief networks are different type of networks from the neural networks we have discussed, but their architectures are similar to those of the neural networks. And it was also unknown how to train deep belief nets when they have several layers. Hinton discovered that training the networks layer by layer in advance can tackle vanishing gradient problems. And later it was discovered that you can do pretraining neural networks layer by layer with autoencoders.

*Deep belief network is beyond the scope of this article series. I have to talk about generative models, Boltzmann machine, and some other topics.

The pretraining techniques of neural networks is not mainstream anymore. But I think it is very meaningful to know that major deep learning techniques such as using ReLU activation functions, optimization with Adam, dropout, batch normalization, came up as more effective algorithms for deep learning after the advent of the pretraining techniques, and now we are in the third AI boom.

In the next next article we are finally going to work on LSTM. Specifically, I am going to offer a clearer guide to a well-made paper on LSTM, named “LSTM: A Search Space Odyssey.”

* I make study materials on machine learning, sponsored by DATANOMIQ. I do my best to make my content as straightforward but as precise as possible. I include all of my reference sources. If you notice any mistakes in my materials, including grammatical errors, please let me know (email: yasuto.tamura@datanomiq.de). And if you have any advice for making my materials more understandable to learners, I would appreciate hearing it.

[References]

[1] Taniguchi Tadahiro, “An Illustrated Guide to Artificial Intelligence”, (2010), Kodansha pp. 3-11
谷口忠大 著, 「イラストで学ぶ人工知能概論」, (2010), 講談社, pp. 3-11

[2] Francois Chollet, Deep Learning with Python,(2018), Manning , pp. 14-24

[3] Oketani Takayuki, “Machine Learning Professional Series: Deep Learning,” (2015), pp. 1-5, 151-156
岡谷貴之 著, 「機械学習プロフェッショナルシリーズ 深層学習」, (2015), pp. 1-5, 151-156

[4] Abigail See, Matthew Lamm, “Natural Language Processingwith Deep LearningCS224N/Ling284 Lecture 8:Machine Translation,Sequence-to-sequence and Attention,” (2020),
URL: http://web.stanford.edu/class/cs224n/slides/cs224n-2020-lecture08-nmt.pdf

[5]C. M. Bishop, “Pattern Recognition and Machine Learning,” (2006), Springer, pp. 192-196

[6] Daniel C. Dennett, “Cognitive Wheels: the Frame Problem of AI,” (1984), pp. 1-2

[7] Machiyama Tomohiro, “Understanding Cinemas of 1967-1979,” (2014), Yosensya, pp. 14-30
町山智浩 著, 「<映画の見方>が分かる本」,(2014), 洋泉社, pp. 14-30

[8] Harada Tatsuya, “Machine Learning Professional Series: Image Recognition,” (2017), pp. 156-157
原田達也 著, 「機械学習プロフェッショナルシリーズ 画像認識」, (2017), pp. 156-157

[9] Suyama Atsushi, “Machine Learning Professional Series: Bayesian Deep Learning,” (2019)岡谷貴之 須山敦志 著, 「機械学習プロフェッショナルシリーズ ベイズ深層学習」, (2019)

[10] “Understandable LSTM ~ With the Current Trends,” Qiita, (2015)
「わかるLSTM ~ 最近の動向と共に」, Qiita, (2015)
URL: https://qiita.com/t_Signull/items/21b82be280b46f467d1b
[11] Hisa Ando, “WEB+DB PRESS plus series: Technologies Supporting Processors – The World Endlessly Pursuing Speed,” (2017), Gijutsu-hyoron-sya, pp 313-317
Hisa Ando, 「WEB+DB PRESS plusシリーズ プロセッサを支える技術― 果てしなくスピードを追求する世界」, (2017), 技術評論社, pp. 313-317

[12] “Takahashi Yoshiki and Utamaru discuss George Lucas,” miyearnZZ Labo, (2016)
“高橋ヨシキと宇多丸 ジョージ・ルーカスを語る,” miyearnZZ Labo, (2016)
URL: https://miyearnzzlabo.com/archives/38865

[13] Katherine Bourzac, “Chip Hall of Fame: Nvidia NV20 The first configurable graphics processor opened the door to a machine-learning revolution,” IEEE SPECTRUM, (2018)
URL: https://spectrum.ieee.org/tech-history/silicon-revolution/chip-hall-of-fame-nvidia-nv20

Sechs Eigenschaften einer modernen Business Intelligence

Völlig unabhängig von der Branche, in der Sie tätig sind, benötigen Sie Informationssysteme, die Ihre geschäftlichen Daten auswerten, um Ihnen Entscheidungsgrundlagen zu liefern. Diese Systeme werden gemeinläufig als sogenannte Business Intelligence (BI) bezeichnet. Tatsächlich leiden die meisten BI-Systeme an Mängeln, die abstellbar sind. Darüber hinaus kann moderne BI Entscheidungen teilweise automatisieren und umfassende Analysen bei hoher Flexibilität in der Nutzung ermöglichen.


english-flagRead this article in English:
“Six properties of modern Business Intelligence”


Lassen Sie uns die sechs Eigenschaften besprechen, die moderne Business Intelligence auszeichnet, die Berücksichtigungen von technischen Kniffen im Detail bedeuten, jedoch immer im Kontext einer großen Vision für die eigene Unternehmen-BI stehen:

1.      Einheitliche Datenbasis von hoher Qualität (Single Source of Truth)

Sicherlich kennt jeder Geschäftsführer die Situation, dass sich seine Manager nicht einig sind, wie viele Kosten und Umsätze tatsächlich im Detail entstehen und wie die Margen pro Kategorie genau aussehen. Und wenn doch, stehen diese Information oft erst Monate zu spät zur Verfügung.

In jedem Unternehmen sind täglich hunderte oder gar tausende Entscheidungen auf operative Ebene zu treffen, die bei guter Informationslage in der Masse sehr viel fundierter getroffen werden können und somit Umsätze steigern und Kosten sparen. Demgegenüber stehen jedoch viele Quellsysteme aus der unternehmensinternen IT-Systemlandschaft sowie weitere externe Datenquellen. Die Informationsbeschaffung und -konsolidierung nimmt oft ganze Mitarbeitergruppen in Anspruch und bietet viel Raum für menschliche Fehler.

Ein System, das zumindest die relevantesten Daten zur Geschäftssteuerung zur richtigen Zeit in guter Qualität in einer Trusted Data Zone als Single Source of Truth (SPOT) zur Verfügung stellt. SPOT ist das Kernstück moderner Business Intelligence.

Darüber hinaus dürfen auch weitere Daten über die BI verfügbar gemacht werden, die z. B. für qualifizierte Analysen und Data Scientists nützlich sein können. Die besonders vertrauenswürdige Zone ist jedoch für alle Entscheider diejenige, über die sich alle Entscheider unternehmensweit synchronisieren können.

2.      Flexible Nutzung durch unterschiedliche Stakeholder

Auch wenn alle Mitarbeiter unternehmensweit auf zentrale, vertrauenswürdige Daten zugreifen können sollen, schließt das bei einer cleveren Architektur nicht aus, dass sowohl jede Abteilung ihre eigenen Sichten auf diese Daten erhält, als auch, dass sogar jeder einzelne, hierfür qualifizierte Mitarbeiter seine eigene Sicht auf Daten erhalten und sich diese sogar selbst erstellen kann.

Viele BI-Systeme scheitern an der unternehmensweiten Akzeptanz, da bestimmte Abteilungen oder fachlich-definierte Mitarbeitergruppen aus der BI weitgehend ausgeschlossen werden.

Moderne BI-Systeme ermöglichen Sichten und die dafür notwendige Datenintegration für alle Stakeholder im Unternehmen, die auf Informationen angewiesen sind und profitieren gleichermaßen von dem SPOT-Ansatz.

3.      Effiziente Möglichkeiten zur Erweiterung (Time to Market)

Bei den Kernbenutzern eines BI-Systems stellt sich die Unzufriedenheit vor allem dann ein, wenn der Ausbau oder auch die teilweise Neugestaltung des Informationssystems einen langen Atem voraussetzt. Historisch gewachsene, falsch ausgelegte und nicht besonders wandlungsfähige BI-Systeme beschäftigen nicht selten eine ganze Mannschaft an IT-Mitarbeitern und Tickets mit Anfragen zu Änderungswünschen.

Gute BI versteht sich als Service für die Stakeholder mit kurzer Time to Market. Die richtige Ausgestaltung, Auswahl von Software und der Implementierung von Datenflüssen/-modellen sorgt für wesentlich kürzere Entwicklungs- und Implementierungszeiten für Verbesserungen und neue Features.

Des Weiteren ist nicht nur die Technik, sondern auch die Wahl der Organisationsform entscheidend, inklusive der Ausgestaltung der Rollen und Verantwortlichkeiten – von der technischen Systemanbindung über die Datenbereitstellung und -aufbereitung bis zur Analyse und dem Support für die Endbenutzer.

4.      Integrierte Fähigkeiten für Data Science und AI

Business Intelligence und Data Science werden oftmals als getrennt voneinander betrachtet und geführt. Zum einen, weil Data Scientists vielfach nur ungern mit – aus ihrer Sicht – langweiligen Datenmodellen und vorbereiteten Daten arbeiten möchten. Und zum anderen, weil die BI in der Regel bereits als traditionelles System im Unternehmen etabliert ist, trotz der vielen Kinderkrankheiten, die BI noch heute hat.

Data Science, häufig auch als Advanced Analytics bezeichnet, befasst sich mit dem tiefen Eintauchen in Daten über explorative Statistik und Methoden des Data Mining (unüberwachtes maschinelles Lernen) sowie mit Predictive Analytics (überwachtes maschinelles Lernen). Deep Learning ist ein Teilbereich des maschinellen Lernens (Machine Learning) und wird ebenfalls für Data Mining oder Predictvie Analytics angewendet. Bei Machine Learning handelt es sich um einen Teilbereich der Artificial Intelligence (AI).

In der Zukunft werden BI und Data Science bzw. AI weiter zusammenwachsen, denn spätestens nach der Inbetriebnahme fließen die Prädiktionsergebnisse und auch deren Modelle wieder in die Business Intelligence zurück. Vermutlich wird sich die BI zur ABI (Artificial Business Intelligence) weiterentwickeln. Jedoch schon heute setzen viele Unternehmen Data Mining und Predictive Analytics im Unternehmen ein und setzen dabei auf einheitliche oder unterschiedliche Plattformen mit oder ohne Integration zur BI.

Moderne BI-Systeme bieten dabei auch Data Scientists eine Plattform, um auf qualitativ hochwertige sowie auf granularere Rohdaten zugreifen zu können.

5.      Ausreichend hohe Performance

Vermutlich werden die meisten Leser dieser sechs Punkte schon einmal Erfahrung mit langsamer BI gemacht haben. So dauert das Laden eines täglich zu nutzenden Reports in vielen klassischen BI-Systemen mehrere Minuten. Wenn sich das Laden eines Dashboards mit einer kleinen Kaffee-Pause kombinieren lässt, mag das hin und wieder für bestimmte Berichte noch hinnehmbar sein. Spätestens jedoch bei der häufigen Nutzung sind lange Ladezeiten und unzuverlässige Reports nicht mehr hinnehmbar.

Ein Grund für mangelhafte Performance ist die Hardware, die sich unter Einsatz von Cloud-Systemen bereits beinahe linear skalierbar an höhere Datenmengen und mehr Analysekomplexität anpassen lässt. Der Einsatz von Cloud ermöglicht auch die modulartige Trennung von Speicher und Rechenleistung von den Daten und Applikationen und ist damit grundsätzlich zu empfehlen, jedoch nicht für alle Unternehmen unbedingt die richtige Wahl und muss zur Unternehmensphilosophie passen.

Tatsächlich ist die Performance nicht nur von der Hardware abhängig, auch die richtige Auswahl an Software und die richtige Wahl der Gestaltung von Datenmodellen und Datenflüssen spielt eine noch viel entscheidender Rolle. Denn während sich Hardware relativ einfach wechseln oder aufrüsten lässt, ist ein Wechsel der Architektur mit sehr viel mehr Aufwand und BI-Kompetenz verbunden. Dabei zwingen unpassende Datenmodelle oder Datenflüsse ganz sicher auch die neueste Hardware in maximaler Konfiguration in die Knie.

6.      Kosteneffizienter Einsatz und Fazit

Professionelle Cloud-Systeme, die für BI-Systeme eingesetzt werden können, bieten Gesamtkostenrechner an, beispielsweise Microsoft Azure, Amazon Web Services und Google Cloud. Mit diesen Rechnern – unter Einweisung eines erfahrenen BI-Experten – können nicht nur Kosten für die Nutzung von Hardware abgeschätzt, sondern auch Ideen zur Kostenoptimierung kalkuliert werden. Dennoch ist die Cloud immer noch nicht für jedes Unternehmen die richtige Lösung und klassische Kalkulationen für On-Premise-Lösungen sind notwendig und zudem besser planbar als Kosten für die Cloud.

Kosteneffizienz lässt sich übrigens auch mit einer guten Auswahl der passenden Software steigern. Denn proprietäre Lösungen sind an unterschiedliche Lizenzmodelle gebunden und können nur über Anwendungsszenarien miteinander verglichen werden. Davon abgesehen gibt es jedoch auch gute Open Source Lösungen, die weitgehend kostenfrei genutzt werden dürfen und für viele Anwendungsfälle ohne Abstriche einsetzbar sind.

Die Total Cost of Ownership (TCO) gehören zum BI-Management mit dazu und sollten stets im Fokus sein. Falsch wäre es jedoch, die Kosten einer BI nur nach der Kosten für Hardware und Software zu bewerten. Ein wesentlicher Teil der Kosteneffizienz ist komplementär mit den Aspekten für die Performance des BI-Systems, denn suboptimale Architekturen arbeiten verschwenderisch und benötigen mehr und teurere Hardware als sauber abgestimmte Architekturen. Die Herstellung der zentralen Datenbereitstellung in adäquater Qualität kann viele unnötige Prozesse der Datenaufbereitung ersparen und viele flexible Analysemöglichkeiten auch redundante Systeme direkt unnötig machen und somit zu Einsparungen führen.

In jedem Fall ist ein BI für Unternehmen mit vielen operativen Prozessen grundsätzlich immer günstiger als kein BI zu haben. Heutzutage könnte für ein Unternehmen nichts teurer sein, als nur nach Bauchgefühl gesteuert zu werden, denn der Markt tut es nicht und bietet sehr viel Transparenz.

Dennoch sind bestehende BI-Architekturen hin und wieder zu hinterfragen. Bei genauerem Hinsehen mit BI-Expertise ist die Kosteneffizienz und Datentransparenz häufig möglich.

Data Analytics and Mining for Dummies

Data Analytics and Mining is often perceived as an extremely tricky task cut out for Data Analysts and Data Scientists having a thorough knowledge encompassing several different domains such as mathematics, statistics, computer algorithms and programming. However, there are several tools available today that make it possible for novice programmers or people with no absolutely no algorithmic or programming expertise to carry out Data Analytics and Mining. One such tool which is very powerful and provides a graphical user interface and an assembly of nodes for ETL: Extraction, Transformation, Loading, for modeling, data analysis and visualization without, or with only slight programming is the KNIME Analytics Platform.

KNIME, or the Konstanz Information Miner, was developed by the University of Konstanz and is now popular with a large international community of developers. Initially KNIME was originally made for commercial use but now it is available as an open source software and has been used extensively in pharmaceutical research since 2006 and also a powerful data mining tool for the financial data sector. It is also frequently used in the Business Intelligence (BI) sector.

KNIME as a Data Mining Tool

KNIME is also one of the most well-organized tools which enables various methods of machine learning and data mining to be integrated. It is very effective when we are pre-processing data i.e. extracting, transforming, and loading data.

KNIME has a number of good features like quick deployment and scaling efficiency. It employs an assembly of nodes to pre-process data for analytics and visualization. It is also used for discovering patterns among large volumes of data and transforming data into more polished/actionable information.

Some Features of KNIME:

  • Free and open source
  • Graphical and logically designed
  • Very rich in analytics capabilities
  • No limitations on data size, memory usage, or functionalities
  • Compatible with Windows ,OS and Linux
  • Written in Java and edited with Eclipse.

A node is the smallest design unit in KNIME and each node serves a dedicated task. KNIME contains graphical, drag-drop nodes that require no coding. Nodes are connected with one’s output being another’s input, as a workflow. Therefore end-to-end pipelines can be built requiring no coding effort. This makes KNIME stand out, makes it user-friendly and make it accessible for dummies not from a computer science background.

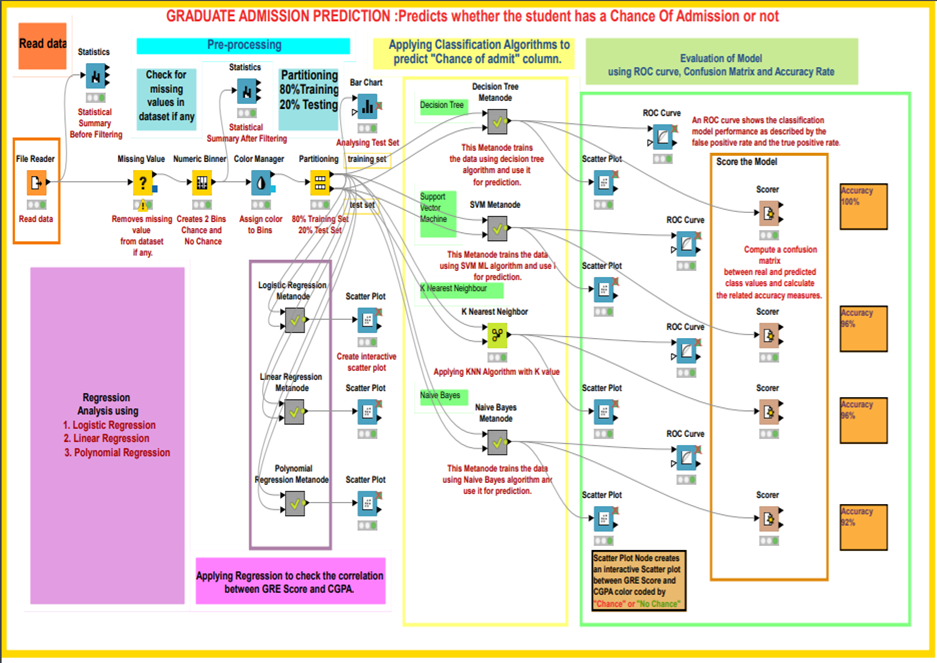
KNIME workflow designed for graduate admission prediction

KNIME workflow designed for graduate admission prediction

KNIME has nodes to carry out Univariate Statistics, Multivariate Statistics, Data Mining, Time Series Analysis, Image Processing, Web Analytics, Text Mining, Network Analysis and Social Media Analysis. The KNIME node repository has a node for every functionality you can possibly think of and need while building a data mining model. One can execute different algorithms such as clustering and classification on a dataset and visualize the results inside the framework itself. It is a framework capable of giving insights on data and the phenomenon that the data represent.

Some commonly used KNIME node groups include:

  • Input-Output or I/O:  Nodes in this group retrieve data from or to write data to external files or data bases.
  • Data Manipulation: Used for data pre-processing tasks. Contains nodes to filter, group, pivot, bin, normalize, aggregate, join, sample, partition, etc.
  • Views: This set of nodes permit users to inspect data and analysis results using multiple views. This gives a means for truly interactive exploration of a data set.
  • Data Mining: In this group, there are nodes that implement certain algorithms (like K-means clustering, Decision Trees, etc.)

Comparison with other tools 

The first version of the KNIME Analytics Platform was released in 2006 whereas Weka and R studio were released in 1997 and 1993 respectively. KNIME is a proper data mining tool whereas Weka and R studio are Machine Learning tools which can also do data mining. KNIME integrates with Weka to add machine learning algorithms to the system. The R project adds statistical functionalities as well. Furthermore, KNIME’s range of functions is impressive, with more than 1,000 modules and ready-made application packages. The modules can be further expanded by additional commercial features.

Interview: Operationalisierung von Data Science

Interview mit Herrn Dr. Frank Block von Roche Diagnostics über Operationalisierung von Data Science

Herr Dr. Frank Block ist Head of IT Data Science bei Roche Diagnostics mit Sitz in der Schweiz. Zuvor war er Chief Data Scientist bei der Ricardo AG nachdem er für andere Unternehmen die Datenanalytik verantwortet hatte und auch 20 Jahre mit mehreren eigenen Data Science Consulting Startups am Markt war. Heute tragen ca. 50 Mitarbeiter bei Roche Diagnostics zu Data Science Projekten bei, die in sein Aktivitätsportfolio fallen: 

Data Science Blog: Herr Dr. Block, Sie sind Leiter der IT Data Science bei Roche Diagnostics? Warum das „IT“ im Namen dieser Abteilung?

Roche ist ein großes Unternehmen mit einer großen Anzahl von Data Scientists in ganz verschiedenen Bereichen mit jeweils sehr verschiedenen Zielsetzungen und Themen, die sie bearbeiten. Ich selber befinde mich mit meinem Team im Bereich „Diagnostics“, d.h. der Teil von Roche, in dem Produkte auf den Markt gebracht werden, die die korrekte Diagnose von Krankheiten und Krankheitsrisiken ermöglichen. Innerhalb von Roche Diagnostics gibt es wiederum verschiedene Bereiche, die Data Science für ihre Zwecke nutzen. Mit meinem Team sind wir in der globalen IT-Organisation angesiedelt und kümmern uns dort insbesondere um Anwendungen von Data Science für die Optimierung der internen Wertschöpfungskette.

Data Science Blog: Sie sind längst über die ersten Data Science Experimente hinaus. Die Operationalisierung von Analysen bzw. analytischen Applikationen ist für Sie besonders wichtig. Welche Rolle spielt das Datenmanagement dabei? Und wo liegen die Knackpunkte?

Ja, richtig. Die Zeiten, in denen sich Data Science erlauben konnte „auf Vorrat“ an interessanten Themen zu arbeiten, weil sie eben super interessant sind, aber ohne jemals konkrete Wertschöpfung zu liefern, sind definitiv und ganz allgemein vorbei. Wir sind seit einigen Jahren dabei, den Übergang von Data Science Experimenten (wir nennen es auch gerne „proof-of-value“) in die Produktion voranzutreiben und zu optimieren. Ein ganz essentielles Element dabei stellen die Daten dar; diese werden oft auch als der „Treibstoff“ für Data Science basierte Prozesse bezeichnet. Der große Unterschied kommt jedoch daher, dass oft statt „Benzin“ nur „Rohöl“ zur Verfügung steht, das zunächst einmal aufwändig behandelt und vorprozessiert werden muss, bevor es derart veredelt ist, dass es für Data Science Anwendungen geeignet ist. In diesem Veredelungsprozess wird heute noch sehr viel Zeit aufgewendet. Je besser die Datenplattformen des Unternehmens, umso größer die Produktivität von Data Science (und vielen anderen Abnehmern dieser Daten im Unternehmen). Ein anderes zentrales Thema stellt der Übergang von Data Science Experiment zu Operationalisierung dar. Hier muss dafür gesorgt werden, dass eine reibungslose Übergabe von Data Science an das IT-Entwicklungsteam erfolgt. Die Teamzusammensetzung verändert sich an dieser Stelle und bei uns tritt der Data Scientist von einer anfänglich führenden Rolle in eine Beraterrolle ein, wenn das System in die produktive Entwicklung geht. Auch die Unterstützung der Operationalisierung durch eine durchgehende Data Science Plattform kann an dieser Stelle helfen.

Data Science Blog: Es heißt häufig, dass Data Scientists kaum zu finden sind. Ist Recruiting für Sie tatsächlich noch ein Thema?

Generell schon, obwohl mir scheint, dass dies nicht unser größtes Problem ist. Glücklicherweise übt Roche eine große Anziehung auf Talente aus, weil im Zentrum unseres Denkens und Handelns der Patient steht und wir somit durch unsere Arbeit einen sehr erstrebenswerten Zweck verfolgen. Ein zweiter Aspekt beim Aufbau eines Data Science Teams ist übrigens das Halten der Talente im Team oder Unternehmen. Data Scientists suchen vor allem spannenden und abwechselnden Herausforderungen. Und hier sind wir gut bedient, da die Palette an Data Science Anwendungen derart breit ist, dass es den Kollegen im Team niemals langweilig wird.

Data Science Blog: Sie haben bereits einige Analysen erfolgreich produktiv gebracht. Welche Herausforderungen mussten dabei überwunden werden? Und welche haben Sie heute noch vor sich?

Wir konnten bereits eine wachsende Zahl an Data Science Experimenten in die Produktion überführen und sind sehr stolz darauf, da dies der beste Weg ist, nachhaltig Geschäftsmehrwert zu generieren. Die gleichzeitige Einbettung von Data Science in IT und Business ist uns bislang gut gelungen, wir werden aber noch weiter daran arbeiten, denn je näher wir mit unseren Kollegen in den Geschäftsabteilungen arbeiten, umso besser wird sichergestellt, das Data Science sich auf die wirklich relevanten Themen fokussiert. Wir sehen auch guten Fortschritt aus der Datenperspektive, wo zunehmend Daten über „Silos“ hinweg integriert werden und so einfacher nutzbar sind.

Data Science Blog: Data Driven Thinking wird heute sowohl von Mitarbeitern in den Fachbereichen als auch vom Management verlangt. Sind wir schon so weit? Wie könnten wir diese Denkweise im Unternehmen fördern?

Ich glaube wir stecken mitten im Wandel, Data-Driven Decisions sind im Kommen, aber das braucht auch seine Zeit. Indem wir zeigen, welches Potenzial ganz konkrete Daten und Advanced Analytics basierte Entscheidungsprozesse innehaben, helfen wir, diesen Wandel voranzutreiben. Spezifische Weiterbildungsangebote stellen eine andere Komponente dar, die diesen Transformationszrozess unterstützt. Ich bin überzeugt, dass wenn wir in 10-20 Jahren zurückblicken, wir uns fragen, wie wir überhaupt ohne Data-Driven Thinking leben konnten…

Six properties of modern Business Intelligence

Regardless of the industry in which you operate, you need information systems that evaluate your business data in order to provide you with a basis for decision-making. These systems are commonly referred to as so-called business intelligence (BI). In fact, most BI systems suffer from deficiencies that can be eliminated. In addition, modern BI can partially automate decisions and enable comprehensive analyzes with a high degree of flexibility in use.


Read this article in German:
“Sechs Eigenschaften einer modernen Business Intelligence“


Let us discuss the six characteristics that distinguish modern business intelligence, which mean taking technical tricks into account in detail, but always in the context of a great vision for your own company BI:

1. Uniform database of high quality

Every managing director certainly knows the situation that his managers do not agree on how many costs and revenues actually arise in detail and what the margins per category look like. And if they do, this information is often only available months too late.

Every company has to make hundreds or even thousands of decisions at the operational level every day, which can be made much more well-founded if there is good information and thus increase sales and save costs. However, there are many source systems from the company’s internal IT system landscape as well as other external data sources. The gathering and consolidation of information often takes up entire groups of employees and offers plenty of room for human error.

A system that provides at least the most relevant data for business management at the right time and in good quality in a trusted data zone as a single source of truth (SPOT). SPOT is the core of modern business intelligence.

In addition, other data on BI may also be made available which can be useful for qualified analysts and data scientists. For all decision-makers, the particularly trustworthy zone is the one through which all decision-makers across the company can synchronize.

2. Flexible use by different stakeholders

Even if all employees across the company should be able to access central, trustworthy data, with a clever architecture this does not exclude that each department receives its own views of this data. Many BI systems fail due to company-wide inacceptance because certain departments or technically defined employee groups are largely excluded from BI.

Modern BI systems enable views and the necessary data integration for all stakeholders in the company who rely on information and benefit equally from the SPOT approach.

3. Efficient ways to expand (time to market)

The core users of a BI system are particularly dissatisfied when the expansion or partial redesign of the information system requires too much of patience. Historically grown, incorrectly designed and not particularly adaptable BI systems often employ a whole team of IT staff and tickets with requests for change requests.

Good BI is a service for stakeholders with a short time to market. The correct design, selection of software and the implementation of data flows / models ensures significantly shorter development and implementation times for improvements and new features.

Furthermore, it is not only the technology that is decisive, but also the choice of organizational form, including the design of roles and responsibilities – from the technical system connection to data preparation, pre-analysis and support for the end users.

4. Integrated skills for Data Science and AI

Business intelligence and data science are often viewed and managed separately from each other. Firstly, because data scientists are often unmotivated to work with – from their point of view – boring data models and prepared data. On the other hand, because BI is usually already established as a traditional system in the company, despite the many problems that BI still has today.

Data science, often referred to as advanced analytics, deals with deep immersion in data using exploratory statistics and methods of data mining (unsupervised machine learning) as well as predictive analytics (supervised machine learning). Deep learning is a sub-area of ​​machine learning and is used for data mining or predictive analytics. Machine learning is a sub-area of ​​artificial intelligence (AI).

In the future, BI and data science or AI will continue to grow together, because at the latest after going live, the prediction models flow back into business intelligence. BI will probably develop into ABI (Artificial Business Intelligence). However, many companies are already using data mining and predictive analytics in the company, using uniform or different platforms with or without BI integration.

Modern BI systems also offer data scientists a platform to access high-quality and more granular raw data.

5. Sufficiently high performance

Most readers of these six points will probably have had experience with slow BI before. It takes several minutes to load a daily report to be used in many classic BI systems. If loading a dashboard can be combined with a little coffee break, it may still be acceptable for certain reports from time to time. At the latest, however, with frequent use, long loading times and unreliable reports are no longer acceptable.

One reason for poor performance is the hardware, which can be almost linearly scaled to higher data volumes and more analysis complexity using cloud systems. The use of cloud also enables the modular separation of storage and computing power from data and applications and is therefore generally recommended, but not necessarily the right choice for all companies.

In fact, performance is not only dependent on the hardware, the right choice of software and the right choice of design for data models and data flows also play a crucial role. Because while hardware can be changed or upgraded relatively easily, changing the architecture is associated with much more effort and BI competence. Unsuitable data models or data flows will certainly bring the latest hardware to its knees in its maximum configuration.

6. Cost-effective use and conclusion

Professional cloud systems that can be used for BI systems offer total cost calculators, such as Microsoft Azure, Amazon Web Services and Google Cloud. With these computers – with instruction from an experienced BI expert – not only can costs for the use of hardware be estimated, but ideas for cost optimization can also be calculated. Nevertheless, the cloud is still not the right solution for every company and classic calculations for on-premise solutions are necessary.

Incidentally, cost efficiency can also be increased with a good selection of the right software. Because proprietary solutions are tied to different license models and can only be compared using application scenarios. Apart from that, there are also good open source solutions that can be used largely free of charge and can be used for many applications without compromises.

However, it is wrong to assess the cost of a BI only according to its hardware and software costs. A significant part of cost efficiency is complementary to the aspects for the performance of the BI system, because suboptimal architectures work wastefully and require more expensive hardware than neatly coordinated architectures. The production of the central data supply in adequate quality can save many unnecessary processes of data preparation and many flexible analysis options also make redundant systems unnecessary and lead to indirect savings.

In any case, a BI for companies with many operational processes is always cheaper than no BI. However, if you take a closer look with BI expertise, cost efficiency is often possible.

Interview – IT-Netzwerk Werke überwachen und optimieren mit Data Analytics

Interview mit Gregory Blepp von NetDescribe über Data Analytics zur Überwachung und Optimierung von IT-Netzwerken

Gregory Blepp ist Managing Director der NetDescribe GmbH mit Sitz in Oberhaching im Süden von München. Er befasst sich mit seinem Team aus Consultants, Data Scientists und IT-Netzwerk-Experten mit der technischen Analyse von IT-Netzwerken und der Automatisierung der Analyse über Applikationen.

Data Science Blog: Herr Blepp, der Name Ihres Unternehmens NetDescribe beschreibt tatsächlich selbstsprechend wofür Sie stehen: die Analyse von technischen Netzwerken. Wo entsteht hier der Bedarf für diesen Service und welche Lösung haben Sie dafür parat?

Unsere Kunden müssen nahezu in Echtzeit eine Visibilität über die Leistungsfähigkeit ihrer Unternehmens-IT haben. Dazu gehört der aktuelle Status der Netzwerke genauso wie andere Bereiche, also Server, Applikationen, Storage und natürlich die Web-Infrastruktur sowie Security.

Im Bankenumfeld sind zum Beispiel die uneingeschränkten WAN Verbindungen für den Handel zwischen den internationalen Börsenplätzen absolut kritisch. Hierfür bieten wir mit StableNetⓇ von InfosimⓇ eine Netzwerk Management Plattform, die in Echtzeit den Zustand der Verbindungen überwacht. Für die unterlagerte Netzwerkplattform (Router, Switch, etc.) konsolidieren wir mit GigamonⓇ das Monitoring.

Für Handelsunternehmen ist die Performance der Plattformen für den Online Shop essentiell. Dazu kommen die hohen Anforderungen an die Sicherheit bei der Übertragung von persönlichen Informationen sowie Kreditkarten. Hierfür nutzen wir SplunkⓇ. Diese Lösung kombiniert in idealer Form die generelle Performance Überwachung mit einem hohen Automatisierungsgrad und bietet dabei wesentliche Unterstützung für die Sicherheitsabteilungen.

Data Science Blog: Geht es den Unternehmen dabei eher um die Sicherheitsaspekte eines Firmennetzwerkes oder um die Performance-Analyse zum Zwecke der Optimierung?

Das hängt von den aktuellen Ansprüchen des Unternehmens ab.
Für viele unserer Kunden standen und stehen zunächst Sicherheitsaspekte im Vordergrund. Im Laufe der Kooperation können wir durch die Etablierung einer konsequenten Performance Analyse aufzeigen, wie eng die Verzahnung der einzelnen Abteilungen ist. Die höhere Visibilität erleichtert Performance Analysen und sie liefert den Sicherheitsabteilung gleichzeitig wichtige Informationen über aktuelle Zustände der Infrastruktur.

Data Science Blog: Haben Sie es dabei mit Big Data – im wörtlichen Sinne – zu tun?

Wir unterscheiden bei Big Data zwischen

  • dem organischen Wachstum von Unternehmensdaten aufgrund etablierter Prozesse, inklusive dem Angebot von neuen Services und
  • wirklichem Big Data, z. B. die Anbindung von Produktionsprozessen an die Unternehmens IT, also durch die Digitalisierung initiierte zusätzliche Prozesse in den Unternehmen.

Beide Themen sind für die Kunden eine große Herausforderung. Auf der einen Seite muss die Leistungsfähigkeit der Systeme erweitert und ausgebaut werden, um die zusätzlichen Datenmengen zu verkraften. Auf der anderen Seite haben diese neuen Daten nur dann einen wirklichen Wert, wenn sie richtig interpretiert werden und die Ergebnisse konsequent in die Planung und Steuerung der Unternehmen einfließen.

Wir bei NetDescribe kümmern uns mehrheitlich darum, das Wachstum und die damit notwendigen Anpassungen zu managen und – wenn Sie so wollen – Ordnung in das Datenchaos zu bringen. Konkret verfolgen wir das Ziel den Verantwortlichen der IT, aber auch der gesamten Organisation eine verlässliche Indikation zu geben, wie es der Infrastruktur als Ganzes geht. Dazu gehört es, über die einzelnen Bereiche hinweg, gerne auch Silos genannt, die Daten zu korrelieren und im Zusammenhang darzustellen.

Data Science Blog: Log-Datenanalyse gibt es seit es Log-Dateien gibt. Was hält ein BI-Team davon ab, einen Data Lake zu eröffnen und einfach loszulegen?

Das stimmt absolut, Log-Datenanalyse gibt es seit jeher. Es geht hier schlichtweg um die Relevanz. In der Vergangenheit wurde mit Wireshark bei Bedarf ein Datensatz analysiert um ein Problem zu erkennen und nachzuvollziehen. Heute werden riesige Datenmengen (Logs) im IoT Umfeld permanent aufgenommen um Analysen zu erstellen.

Nach meiner Überzeugung sind drei wesentliche Veränderungen der Treiber für den flächendeckenden Einsatz von modernen Analysewerkzeugen.

  • Die Inhalte und Korrelationen von Log Dateien aus fast allen Systemen der IT Infrastruktur sind durch die neuen Technologien nahezu in Echtzeit und für größte Datenmengen überhaupt erst möglich. Das hilft in Zeiten der Digitalisierung, wo aktuelle Informationen einen ganz neuen Stellenwert bekommen und damit zu einer hohen Gewichtung der IT führen.
  • Ein wichtiger Aspekt bei der Aufnahme und Speicherung von Logfiles ist heute, dass ich die Suchkriterien nicht mehr im Vorfeld formulieren muss, um dann die Antworten aus den Datensätzen zu bekommen. Die neuen Technologien erlauben eine völlig freie Abfrage von Informationen über alle Daten hinweg.
  • Logfiles waren in der Vergangenheit ein Hilfswerkzeug für Spezialisten. Die Information in technischer Form dargestellt, half bei einer Problemlösung – wenn man genau wusste was man sucht. Die aktuellen Lösungen sind darüber hinaus mit einer GUI ausgestattet, die nicht nur modern, sondern auch individuell anpassbar und für Nicht-Techniker verständlich ist. Somit erweitert sich der Anwenderkreis des “Logfile Managers” heute vom Spezialisten im Security und Infrastrukturbereich über Abteilungsverantwortliche und Mitarbeiter bis zur Geschäftsleitung.

Der Data Lake war und ist ein wesentlicher Bestandteil. Wenn wir heute Technologien wie Apache/KafkaⓇ und, als gemanagte Lösung, Confluent für Apache/KafkaⓇ betrachten, wird eine zentrale Datendrehscheibe etabliert, von der alle IT Abteilungen profitieren. Alle Analysten greifen mit Ihren Werkzeugen auf die gleiche Datenbasis zu. Somit werden die Rohdaten nur einmal erhoben und allen Tools gleichermaßen zur Verfügung gestellt.

Data Science Blog: Damit sind Sie ein Unternehmen das Datenanalyse, Visualisierung und Monitoring verbindet, dies jedoch auch mit der IT-Security. Was ist Unternehmen hierbei eigentlich besonders wichtig?

Sicherheit ist natürlich ganz oben auf die Liste zu setzen. Organisation sind naturgemäß sehr sensibel und aktuelle Medienberichte zu Themen wie Cyber Attacks, Hacking etc. zeigen große Wirkung und lösen Aktionen aus. Dazu kommen Compliance Vorgaben, die je nach Branche schneller und kompromissloser umgesetzt werden.

Die NetDescribe ist spezialisiert darauf den Bogen etwas weiter zu spannen.

Natürlich ist die sogenannte Nord-Süd-Bedrohung, also der Angriff von außen auf die Struktur erheblich und die IT-Security muss bestmöglich schützen. Dazu dienen die Firewalls, der klassische Virenschutz etc. und Technologien wie Extrahop, die durch konsequente Überwachung und Aktualisierung der Signaturen zum Schutz der Unternehmen beitragen.

Genauso wichtig ist aber die Einbindung der unterlagerten Strukturen wie das Netzwerk. Ein Angriff auf eine Organisation, egal von wo aus initiiert, wird immer über einen Router transportiert, der den Datensatz weiterleitet. Egal ob aus einer Cloud- oder traditionellen Umgebung und egal ob virtuell oder nicht. Hier setzen wir an, indem wir etablierte Technologien wie zum Beispiel ´flow` mit speziell von uns entwickelten Software Modulen – sogenannten NetDescibe Apps – nutzen, um diese Datensätze an SplunkⓇ, StableNetⓇ  weiterzuleiten. Dadurch entsteht eine wesentlich erweiterte Analysemöglichkeit von Bedrohungsszenarien, verbunden mit der Möglichkeit eine unternehmensweite Optimierung zu etablieren.

Data Science Blog: Sie analysieren nicht nur ad-hoc, sondern befassen sich mit der Formulierung von Lösungen als Applikation (App).

Das stimmt. Alle von uns eingesetzten Technologien haben ihre Schwerpunkte und sind nach unserer Auffassung führend in ihren Bereichen. InfosimⓇ im Netzwerk, speziell bei den Verbindungen, VIAVI in der Paketanalyse und bei flows, SplunkⓇ im Securitybereich und Confluent für Apache/KafkaⓇ als zentrale Datendrehscheibe. Also jede Lösung hat für sich alleine schon ihre Daseinsberechtigung in den Organisationen. Die NetDescribe hat es sich seit über einem Jahr zur Aufgabe gemacht, diese Technologien zu verbinden um einen “Stack” zu bilden.

Konkret: Gigaflow von VIAVI ist die wohl höchst skalierbare Softwarelösung um Netzwerkdaten in größten Mengen schnell und und verlustfrei zu speichern und zu analysieren. SplunkⓇ hat sich mittlerweile zu einem Standardwerkzeug entwickelt, um Datenanalyse zu betreiben und die Darstellung für ein großes Auditorium zu liefern.

NetDescribe hat jetzt eine App vorgestellt, welche die NetFlow-Daten in korrelierter Form aus Gigaflow, an SplunkⓇ liefert. Ebenso können aus SplunkⓇ Abfragen zu bestimmten Datensätzen direkt an die Gigaflow Lösung gestellt werden. Das Ergebnis ist eine wesentlich erweiterte SplunkⓇ-Plattform, nämlich um das komplette Netzwerk mit nur einem Knopfdruck (!!!).
Dazu schont diese Anbindung in erheblichem Umfang SplunkⓇ Ressourcen.

Dazu kommt jetzt eine NetDescribe StableNetⓇ App. Weitere Anbindungen sind in der Planung.

Das Ziel ist hier ganz pragmatisch – wenn sich SplunkⓇ als die Plattform für Sicherheitsanalysen und für das Data Framework allgemein in den Unternehmen etabliert, dann unterstützen wir das als NetDescribe dahingehend, dass wir die anderen unternehmenskritischen Lösungen der Abteilungen an diese Plattform anbinden, bzw. Datenintegration gewährleisten. Das erwarten auch unsere Kunden.

Data Science Blog: Auf welche Technologien setzen Sie dabei softwareseitig?

Wie gerade erwähnt, ist SplunkⓇ eine Plattform, die sich in den meisten Unternehmen etabliert hat. Wir machen SplunkⓇ jetzt seit über 10 Jahren und etablieren die Lösung bei unseren Kunden.

SplunkⓇ hat den großen Vorteil dass unsere Kunden mit einem dedizierten und überschaubaren Anwendung beginnen können, die Technologie selbst aber nahezu unbegrenzt skaliert. Das gilt für Security genauso wie Infrastruktur, Applikationsmonitoring und Entwicklungsumgebungen. Aus den ständig wachsenden Anforderungen unserer Kunden ergeben sich dann sehr schnell weiterführende Gespräche, um zusätzliche Einsatzszenarien zu entwickeln.

Neben SplunkⓇ setzen wir für das Netzwerkmanagement auf StableNetⓇ von InfosimⓇ, ebenfalls seit über 10 Jahren schon. Auch hier, die Erfahrungen des Herstellers im Provider Umfeld erlauben uns bei unseren Kunden eine hochskalierbare Lösung zu etablieren.

Confluent für Apache/KafkaⓇ ist eine vergleichbar jüngere Lösung, die aber in den Unternehmen gerade eine extrem große Aufmerksamkeit bekommt. Die Etablierung einer zentralen Datendrehscheibe für Analyse, Auswertungen, usw., auf der alle Daten zur Performance zentral zur Verfügung gestellt werden, wird es den Administratoren, aber auch Planern und Analysten künftig erleichtern, aussagekräftige Daten zu liefern. Die Verbindung aus OpenSource und gemanagter Lösung trifft hier genau die Zielvorstellung der Kunden und scheinbar auch den Zahn der Zeit. Vergleichbar mit den Linux Derivaten von Red Hat Linux und SUSE.

VIAVI Gigaflow hatte ich für Netzwerkanalyse schon erwähnt. Hier wird in den kommenden Wochen mit der neuen Version der VIAVI Apex Software ein Scoring für Netzwerke etabliert. Stellen sie sich den MOS score von VoIP für Unternehmensnetze vor. Das trifft es sehr gut. Damit erhalten auch wenig spezialisierte Administratoren die Möglichkeit mit nur 3 (!!!) Mausklicks konkrete Aussagen über den Zustand der Netzwerkinfrastruktur, bzw. auftretende Probleme zu machen. Ist es das Netz? Ist es die Applikation? Ist es der Server? – der das Problem verursacht. Das ist eine wesentliche Eindämmung des derzeitigen Ping-Pong zwischen den Abteilungen, von denen oft nur die Aussage kommt, “bei uns ist alles ok”.

Abgerundet wird unser Software Portfolio durch die Lösung SentinelOne für Endpoint Protection.

Data Science Blog: Inwieweit spielt Künstliche Intelligenz (KI) bzw. Machine Learning eine Rolle?

Machine Learning spielt heute schon ein ganz wesentliche Rolle. Durch konsequentes Einspeisen der Rohdaten und durch gezielte Algorithmen können mit der Zeit bessere Analysen der Historie und komplexe Zusammenhänge aufbereitet werden. Hinzu kommt, dass so auch die Genauigkeit der Prognosen für die Zukunft immens verbessert werden können.

Als konkretes Beispiel bietet sich die eben erwähnte Endpoint Protection von SentinelOne an. Durch die Verwendung von KI zur Überwachung und Steuerung des Zugriffs auf jedes IoT-Gerät, befähigt  SentinelOne Maschinen, Probleme zu lösen, die bisher nicht in größerem Maßstab gelöst werden konnten.

Hier kommt auch unser ganzheitlicher Ansatz zum Tragen, nicht nur einzelne Bereiche der IT, sondern die unternehmensweite IT ins Visier zu nehmen.

Data Science Blog: Mit was für Menschen arbeiten Sie in Ihrem Team? Sind das eher die introvertierten Nerds und Hacker oder extrovertierte Consultants? Was zeichnet Sie als Team fachlich aus?

Nerds und Hacker würde ich unsere Mitarbeiter im technischen Consulting definitiv nicht nennen.

Unser Consulting Team besteht derzeit aus neun Leuten. Jeder ist ausgewiesener Experte für bestimmte Produkte. Natürlich ist es auch bei uns so, dass wir introvertierte Kollegen haben, die zunächst lieber in Abgeschiedenheit oder Ruhe ein Problem analysieren, um dann eine Lösung zu generieren. Mehrheitlich sind unsere technischen Kollegen aber stets in enger Abstimmung mit dem Kunden.

Für den Einsatz beim Kunden ist es sehr wichtig, dass man nicht nur fachlich die Nase vorn hat, sondern dass man auch  kommunikationsstark und extrem teamfähig ist. Eine schnelle Anpassung an die verschiedenen Arbeitsumgebungen und “Kollegen” bei den Kunden zeichnet unsere Leute aus.

Als ständig verfügbares Kommunikationstool nutzen wir einen internen Chat der allen jederzeit zur Verfügung steht, so dass unser Consulting Team auch beim Kunden immer Kontakt zu den Kollegen hat. Das hat den großen Vorteil, dass das gesamte Know-how sozusagen “im Pool” verfügbar ist.

Neben den Consultants gibt es unser Sales Team mit derzeit vier Mitarbeitern*innen. Diese Kollegen*innen sind natürlich immer unter Strom, so wie sich das für den Vertrieb gehört.
Dedizierte PreSales Consultants sind bei uns die technische Speerspitze für die Aufnahme und das Verständnis der Anforderungen. Eine enge Zusammenarbeit mit dem eigentlichen Consulting Team ist dann die  Voraussetzung für die vorausschauende Planung aller Projekte.

Wir suchen übrigens laufend qualifizierte Kollegen*innen. Details zu unseren Stellenangeboten finden Ihre Leser*innen auf unserer Website unter dem Menüpunkt “Karriere”.  Wir freuen uns über jede/n Interessenten*in.

Über NetDescribe:

NetDescribe steht mit dem Claim Trusted Performance für ausfallsichere Geschäftsprozesse und Cloud-Anwendungen. Die Stärke von NetDescribe sind maßgeschneiderte Technologie Stacks bestehend aus Lösungen mehrerer Hersteller. Diese werden durch selbst entwickelte Apps ergänzt und verschmolzen.

Das ganzheitliche Portfolio bietet Datenanalyse und -visualisierung, Lösungskonzepte, Entwicklung, Implementierung und Support. Als Trusted Advisor für Großunternehmen und öffentliche Institutionen realisiert NetDescribe hochskalierbare Lösungen mit State-of-the-Art-Technologien für dynamisches und transparentes Monitoring in Echtzeit. Damit erhalten Kunden jederzeit Einblicke in die Bereiche Security, Cloud, IoT und Industrie 4.0. Sie können agile Entscheidungen treffen, interne und externe Compliance sichern und effizientes Risikomanagement betreiben. Das ist Trusted Performance by NetDescribe.

Einführung in die Welt der Autoencoder

An wen ist der Artikel gerichtet?

In diesem Artikel wollen wir uns näher mit dem neuronalen Netz namens Autoencoder beschäftigen und wollen einen Einblick in die Grundprinzipien bekommen, die wir dann mit einem vereinfachten Programmierbeispiel festigen. Kenntnisse in Python, Tensorflow und neuronalen Netzen sind dabei sehr hilfreich.

Funktionsweise des Autoencoders

Ein Autoencoder ist ein neuronales Netz, welches versucht die Eingangsinformationen zu komprimieren und mit den reduzierten Informationen im Ausgang wieder korrekt nachzubilden.

Die Komprimierung und die Rekonstruktion der Eingangsinformationen laufen im Autoencoder nacheinander ab, weshalb wir das neuronale Netz auch in zwei Abschnitten betrachten können.


Der Encoder

Der Encoder oder auch Kodierer hat die Aufgabe, die Dimensionen der Eingangsinformationen zu reduzieren, man spricht auch von Dimensionsreduktion. Durch diese Reduktion werden die Informationen komprimiert und es werden nur die wichtigsten bzw. der Durchschnitt der Informationen weitergeleitet. Diese Methode hat wie viele andere Arten der Komprimierung auch einen Verlust.

In einem neuronalen Netz wird dies durch versteckte Schichten realisiert. Durch die Reduzierung von Knotenpunkten in den kommenden versteckten Schichten werden die Kodierung bewerkstelligt.

Der Decoder

Nachdem das Eingangssignal kodiert ist, kommt der Decoder bzw. Dekodierer zum Einsatz. Er hat die Aufgabe mit den komprimierten Informationen die ursprünglichen Daten zu rekonstruieren. Durch Fehlerrückführung werden die Gewichte des Netzes angepasst.

Ein bisschen Mathematik

Das Hauptziel des Autoencoders ist, dass das Ausgangssignal dem Eingangssignal gleicht, was bedeutet, dass wir eine Loss Funktion haben, die L(x , y) entspricht.

L(x, \hat{x})

Unser Eingang soll mit x gekennzeichnet werden. Unsere versteckte Schicht soll h sein. Damit hat unser Encoder folgenden Zusammenhang h = f(x).

Die Rekonstruktion im Decoder kann mit r = g(h) beschrieben werden. Bei unserem einfachen Autoencoder handelt es sich um ein Feed-Forward Netz ohne rückkoppelten Anteil und wird durch Backpropagation oder zu deutsch Fehlerrückführung optimiert.

Formelzeichen Bedeutung
\mathbf{x}, \hat{\mathbf{x}} Eingangs-, Ausgangssignal
\mathbf{W}, \hat{\mathbf{W}} Gewichte für En- und Decoder
\mathbf{B}, \hat{\mathbf{B}} Bias für En- und Decoder
\sigma, \hat{\sigma} Aktivierungsfunktion für En- und Decoder
L Verlustfunktion

Unsere versteckte Schicht soll mit \latex h gekennzeichnet werden. Damit besteht der Zusammenhang:

(1)   \begin{align*} \mathbf{h} &= f(\mathbf{x}) = \sigma(\mathbf{W}\mathbf{x} + \mathbf{B}) \\ \hat{\mathbf{x}} &= g(\mathbf{h}) = \hat{\sigma}(\hat{\mathbf{W}} \mathbf{h} + \hat{\mathbf{B}}) \\ \hat{\mathbf{x}} &= \hat{\sigma} \{ \hat{\mathbf{W}} \left[\sigma ( \mathbf{W}\mathbf{x} + \mathbf{B} )\right]  + \hat{\mathbf{B}} \}\\ \end{align*}

Für eine Optimierung mit der mittleren quadratischen Abweichung (MSE) könnte die Verlustfunktion wie folgt aussehen:

(2)   \begin{align*} L(\mathbf{x}, \hat{\mathbf{x}}) &= \mathbf{MSE}(\mathbf{x}, \hat{\mathbf{x}}) = \|  \mathbf{x} - \hat{\mathbf{x}} \| ^2 &=  \| \mathbf{x} - \hat{\sigma} \{ \hat{\mathbf{W}} \left[\sigma ( \mathbf{W}\mathbf{x} + \mathbf{B} )\right]  + \hat{\mathbf{B}} \} \| ^2 \end{align*}


Wir haben die Theorie und Mathematik eines Autoencoder in seiner Ursprungsform kennengelernt und wollen jetzt diese in einem (sehr) einfachen Beispiel anwenden, um zu schauen, ob der Autoencoder so funktioniert wie die Theorie es besagt.

Dazu nehmen wir einen One Hot (1 aus n) kodierten Datensatz, welcher die Zahlen von 0 bis 3 entspricht.

    \begin{align*} [1, 0, 0, 0] \ \widehat{=}  \ 0 \\ [0, 1, 0, 0] \ \widehat{=}  \ 1 \\ [0, 0, 1, 0] \ \widehat{=}  \ 2 \\ [0, 0, 0, 1] \ \widehat{=} \  3\\ \end{align*}

Diesen Datensatz könnte wie folgt kodiert werden:

    \begin{align*} [1, 0, 0, 0] \ \widehat{=}  \ 0 \ \widehat{=}  \ [0, 0] \\ [0, 1, 0, 0] \ \widehat{=}  \ 1 \ \widehat{=}  \  [0, 1] \\ [0, 0, 1, 0] \ \widehat{=}  \ 2 \ \widehat{=}  \ [1, 0] \\ [0, 0, 0, 1] \ \widehat{=} \  3 \ \widehat{=}  \ [1, 1] \\ \end{align*}

Damit hätten wir eine Dimensionsreduktion von vier auf zwei Merkmalen vorgenommen und genau diesen Vorgang wollen wir bei unserem Beispiel erreichen.

Programmierung eines einfachen Autoencoders


Typische Einsatzgebiete des Autoencoders sind neben der Dimensionsreduktion auch Bildaufarbeitung (z.B. Komprimierung, Entrauschen), Anomalie-Erkennung, Sequenz-to-Sequenz Analysen, etc.

Ausblick

Wir haben mit einem einfachen Beispiel die Funktionsweise des Autoencoders festigen können. Im nächsten Schritt wollen wir anhand realer Datensätze tiefer in gehen. Auch soll in kommenden Artikeln Variationen vom Autoencoder in verschiedenen Einsatzgebieten gezeigt werden.

How Important is Customer Lifetime Value?

This is the third article of article series Getting started with the top eCommerce use cases.

Customer Lifetime Value

Many researches have shown that cost for acquiring a new customer is higher than the cost of retention of an existing customer which makes Customer Lifetime Value (CLV or LTV) one of the most important KPI’s. Marketing is about building a relationship with your customer and quality service matters a lot when it comes to customer retention. CLV is a metric which determines the total amount of money a customer is expected to spend in your business.

CLV allows marketing department of the company to understand how much money a customer is going  to spend over their  life cycle which helps them to determine on how much the company should spend to acquire each customer. Using CLV a company can better understand their customer and come up with different strategies either to retain their existing customers by sending them personalized email, discount voucher, provide them with better customer service etc. This will help a company to narrow their focus on acquiring similar customers by applying customer segmentation or look alike modeling.

One of the main focus of every company is Growth in this competitive eCommerce market today and price is not the only factor when a customer makes a decision. CLV is a metric which revolves around a customer and helps to retain valuable customers, increase revenue from less valuable customers and improve overall customer experience. Don’t look at CLV as just one metric but the journey to calculate this metric involves answering some really important questions which can be crucial for the business. Metrics and questions like:

  1. Number of sales
  2. Average number of times a customer buys
  3. Full Customer journey
  4. How many marketing channels were involved in one purchase?
  5. When the purchase was made?
  6. Customer retention rate
  7. Marketing cost
  8. Cost of acquiring a new customer

and so on are somehow associated with the calculation of CLV and exploring these questions can be quite insightful. Lately, a lot of companies have started to use this metric and shift their focuses in order to make more profit. Amazon is the perfect example for this, in 2013, a study by Consumers Intelligence Research Partners found out that prime members spends more than a non-prime member. So Amazon started focusing on Prime members to increase their profit over the past few years. The whole article can be found here.

How to calculate CLV?

There are several methods to calculate CLV and few of them are listed below.

Method 1: By calculating average revenue per customer


Figure 1: Using average revenue per customer


Let’s suppose three customers brought 745€ as profit to a company over a period of 2 months then:

CLV (2 months) = Total Profit over a period of time / Number of Customers over a period of time

CLV (2 months) = 745 / 3 = 248 €

Now the company can use this to calculate CLV for an year however, this is a naive approach and works only if the preferences of the customer are same for the same period of time. So let’s explore other approaches.

Method 2

This method requires to first calculate KPI’s like retention rate and discount rate.


CLV = Gross margin per lifespan ( Retention rate per month / 1 + Discount rate – Retention rate per month)

Where

Retention rate = Customer at the end of the month – Customer during the month / Customer at the beginning of the month ) * 100

Method 3

This method will allow us to look at other metrics also and can be calculated in following steps:

  1. Calculate average number of transactions per month (T)
  2. Calculate average order value (OV)
  3. Calculate average gross margin (GM)
  4. Calculate customer lifespan in months (ALS)

After calculating these metrics CLV can be calculated as:


CLV = T*OV*GM*ALS / No. of Clients for the period

where

Transactions (T) = Total transactions / Period

Average order value (OV) = Total revenue / Total orders

Gross margin (GM) = (Total revenue – Cost of sales/ Total revenue) * 100 [but how you calculate cost of sales is debatable]

Customer lifespan in months (ALS) = 1 / Churn Rate %


CLV can be calculated using any of the above mentioned methods depending upon how robust your company wants the analysis to be. Some companies are also using Machine learning models to predict CLV, maybe not directly but they use ML models to predict customer churn rate, retention rate and other marketing KPI’s. Some companies take advantage of all the methods by taking an average at the end.

Integrate Unstructured Data into Your Enterprise to Drive Actionable Insights

In an ideal world, all enterprise data is structured – classified neatly into columns, rows, and tables, easily integrated and shared across the organization.

The reality is far from it! Datamation estimates that unstructured data accounts for more than 80% of enterprise data, and it is growing at a rate of 55 – 65 percent annually. This includes information stored in images, emails, spreadsheets, etc., that cannot fit into databases.

Therefore, it becomes imperative for a data-driven organization to leverage their non-traditional information assets to derive business value. We have outlined a simple 3-step process that can help organizations integrate unstructured sources into their data eco-system:

1. Determine the Challenge

The primary step is narrowing down the challenges you want to solve through the unstructured data flowing in and out of your organization. Financial organizations, for instance, use call reports, sales notes, or other text documents to get real-time insights from the data and make decisions based on the trends. Marketers make use of social media data to evaluate their customers’ needs and shape their marketing strategy.

Figuring out which process your organization is trying to optimize through unstructured data can help you reach your goal faster.

2. Map Out the Unstructured Data Sources Within the Enterprise

An actionable plan starts with identifying the range of data sources that are essential to creating a truly integrated environment. This enables organizations to align the sources with business objectives and streamline their data initiatives.

Deciding which data should be extracted, analyzed, and stored should be a primary concern in this regard. Even if you can ingest data from any source, it doesn’t mean that you should.

Collecting a large volume of unstructured data is not enough to generate insights. It needs to be properly organized and validated for quality before integration. Full, incremental, online, and offline extraction methods are generally used to mine valuable information from unstructured data sources.

3. Transform Unstructured Assets into Decision-Ready Insights

Now that you have all the puzzle pieces, the next step is to create a complete picture. This may require making changes in your organization’s infrastructure to derive meaning from your unstructured assets and get a 360-degree business view.

IDC recommends creating a company culture that promotes the collection, use, and sharing of both unstructured and structured business assets. Therefore, finding an enterprise-grade integration solution that offers enhanced connectivity to a range of data sources, ideally structured, unstructured, and semi-structured, can help organizations generate the most value out of their data assets.

Automation is another feature that can help speed up integration processes, minimize error probability, and generate time-and-cost savings. Features like job scheduling, auto-mapping, and workflow automation can optimize the process of extracting information from XML, JSON, Excel or audio files, and storing it into a relational database or generating insights.

The push to become a data-forward organization has enterprises re-evaluating the way to leverage unstructured data assets for decision-making. With an actionable plan in place to integrate these sources with the rest of the data, organizations can take advantage of the opportunities offered by analytics and stand out from the competition.