Modelling Data – Case Study: Importance of domain knowledge
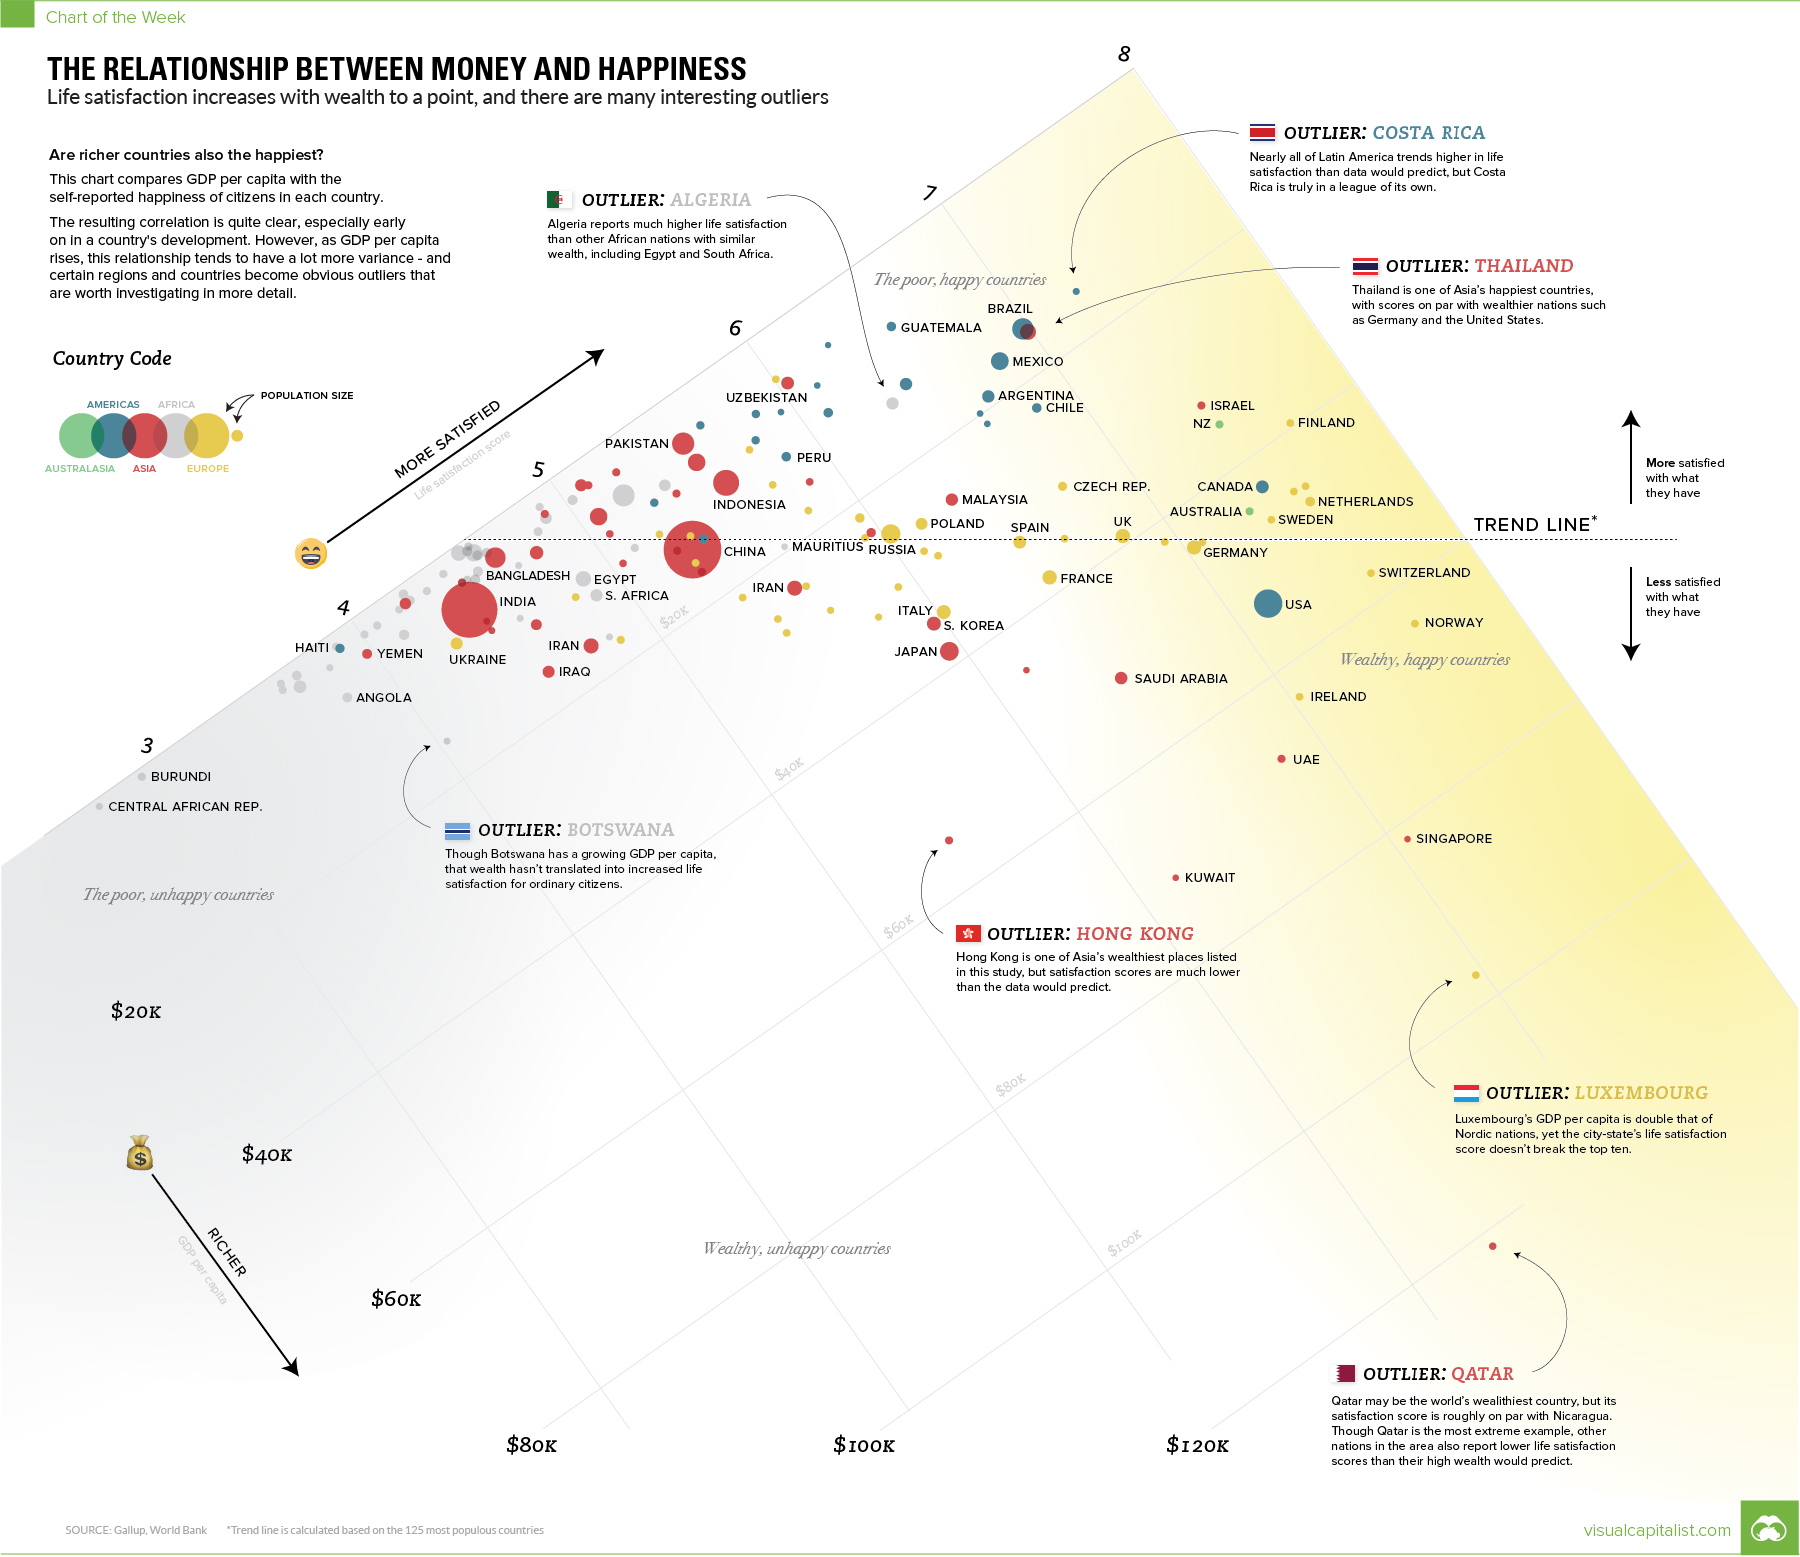
What´s the relation between earnings and happiness? I saw this chart and was strongly irritated – why is there a linear regression, it´s clearly a logarithmic relationship.
So I got angry and wanted to know, which model is the better fit. I started to work immediatly, because it´s a huge difference for man kind. Think about it: you give a poor person money and he gets as happy as a rich person with the same amount added – that´s against common sense and propaganda to get rich. Like an cultural desease.
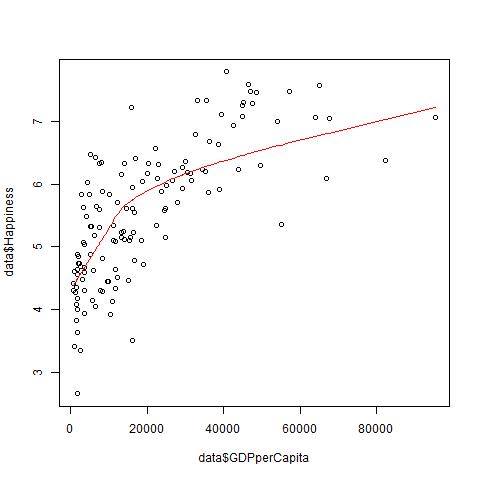
So I gathered the data and did a first comparation, and this logarithmic model was the better fit:
I was right and seriously willing to clear the mess up – so posted the “correct” model on facebook, to explain things to my friends.
Once I came down…
I asked myself: “What´s the model that fits the data best – that would be more correct?”
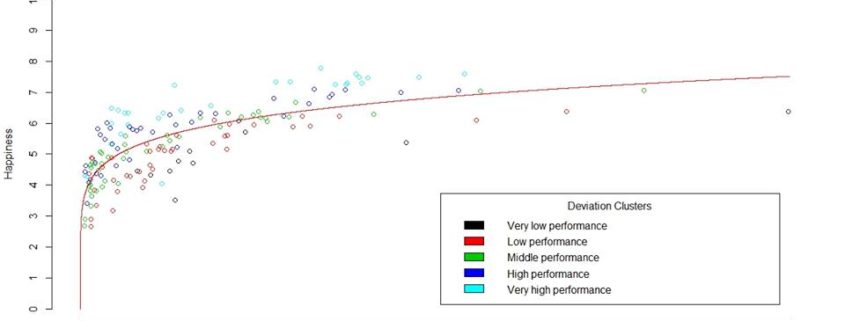
So I started to write an algorithm to check polynominal regression levels for fit using a random train and test data split. Finally, I got to this result and was amazed:
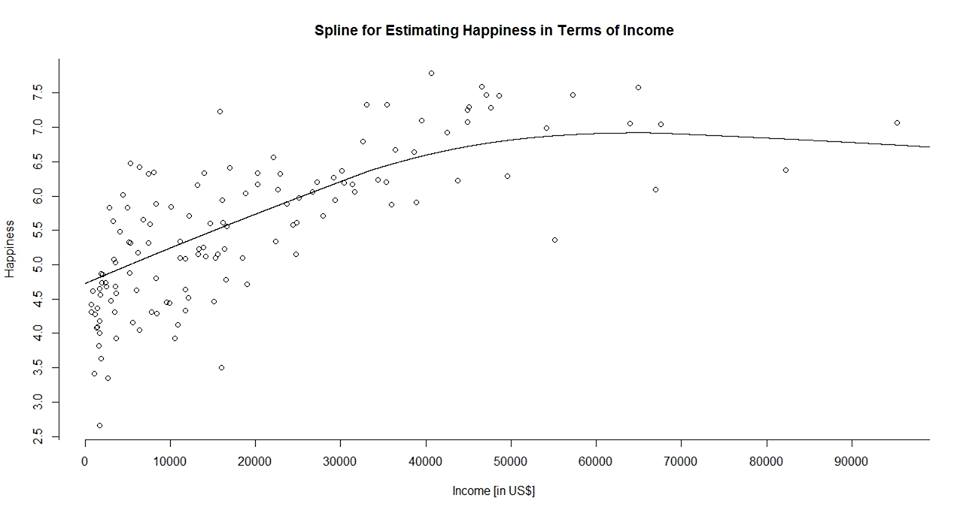
This seriously hit me: “What the f***! There seems to be maximum happiness reachable with a certain amount of income / GDP.” Can you understand, what this result would mean for our world and economy? Think about all economies growing continiously, but well happiest was there or will come there. What would you do? Send income to less developed countries, because you don´t need it? Stop invention and progress, because it´s of no use? Seriously, I felt like a socialist: Stop progress at this point and share.
So I thought a while and concluded: “F***ing statistics, we need a profound econometric model.”
I started modelling: Well, the first amount of money in a market based on money leverages a huge amount of happiness, because you can participate and feed yourself. We can approximate that by infinit marginal utility. Then the more you have, the less utility should be provided by the additional same amount added. Finally, more income is more options, so more should be always better. I concluded, that this is catched by a Cobb Douglas production function. Here´s the graph:
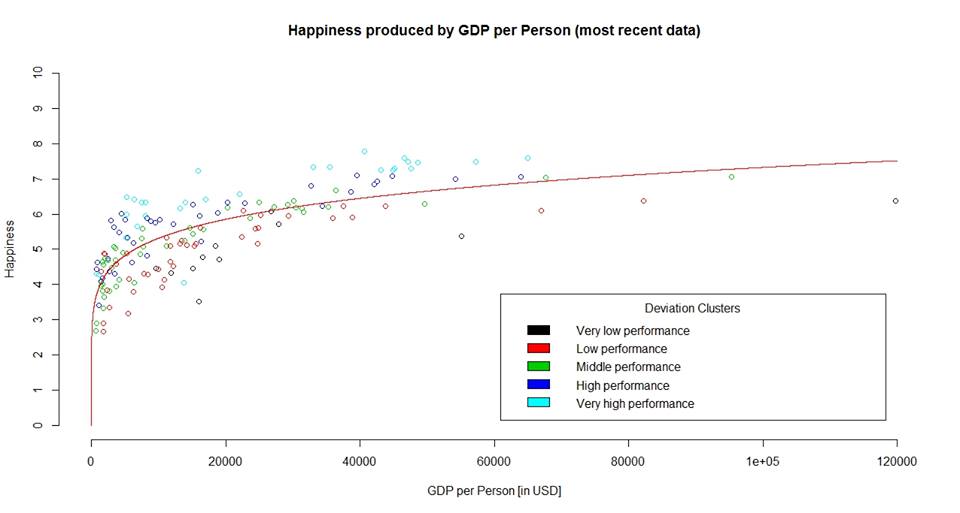
That´s it, that´s the final model. Here I feel home, this looks like a normal world – for an economist.
The Relevance of Domain Knowledge
As this short case study shows, we get completly wrong information and conclusions, if we don´t do it right. If you were the most important decision making algorithm in global economic politics, imagine what desasterous outcomes it would have produced to automatically find an optimum of income.
This is a serious border of AI. If you want to analyse Big Data with algorithms, you may produce seriously wrong information and conclusions. Statistical analysis is allways about using the right model. And modelling is about the assumptions of the model. As long as you can not create the right assumtions for the statistical model automatically, Big Data analysis is near to crazy. So out of this point of view, Big Data analysis is either about very simplistic tendencies (like linear trends) or it´s bound to Data Scientists with domain knowledge checking each model – that´s slow.
Discussion
I´m quite new to the field of Data Science, but this case study shows very though limitations, clearly. It´s not about flexible fitting of data, it´s about right models. And right models don´t scale into the Big Data domain. What do you think is the solution for this issue?
Countries of Happiness – the Full Article
If you are interested in my final article on my personal blog, explaining the final results: Please feel welcome to read the article here. There is a translation widget in the menu, to read in your favorite language. The original article is german.