Simple RNN

Understanding LSTM forward propagation in two ways

*This article is only for the sake of understanding the equations in the second page of the paper named “LSTM: A Search Space Odyssey”. If you have no trouble understanding the equations of LSTM forward propagation, I recommend you to skip this article and go the the next article.

1. Preface

I  heard that in Western culture, smart people write textbooks so that other normal people can understand difficult stuff, and that is why textbooks in Western countries tend to be bulky, but also they are not so difficult as they look. On the other hand in Asian culture, smart people write puzzling texts on esoteric topics, and normal people have to struggle to understand what noble people wanted to say. Publishers also require the authors to keep the texts as short as possible, so even though the textbooks are thin, usually students have to repeat reading the textbooks several times because usually they are too abstract.

Both styles have cons and pros, and usually I prefer Japanese textbooks because they are concise, and sometimes it is annoying to read Western style long texts with concrete straightforward examples to reach one conclusion. But a problem is that when it comes to explaining LSTM, almost all the text books are like Asian style ones. Every study material seems to skip the proper steps necessary for “normal people” to understand its algorithms. But after actually making concrete slides on mathematics on LSTM, I understood why: if you write down all the equations on LSTM forward/back propagation, that is going to be massive, and actually I had to make 100-page PowerPoint animated slides to make it understandable to people like me.

I already had a feeling that “Does it help to understand only LSTM with this precision? I should do more practical codings.” For example François Chollet, the developer of Keras, in his book, said as below.


For me that sounds like “We have already implemented RNNs for you, so just shut up and use Tensorflow/Keras.” Indeed, I have never cared about the architecture of my Mac Book Air, but I just use it every day, so I think he is to the point. To make matters worse, for me, a promising algorithm called Transformer seems to be replacing the position of LSTM in natural language processing. But in this article series and in my PowerPoint slides, I tried to explain as much as possible, contrary to his advice.

But I think, or rather hope,  it is still meaningful to understand this 23-year-old algorithm, which is as old as me. I think LSTM did build a generation of algorithms for sequence data, and actually Sepp Hochreiter, the inventor of LSTM, has received Neural Network Pioneer Award 2021 for his work.

I hope those who study sequence data processing in the future would come to this article series, and study basics of RNN just as I also study classical machine learning algorithms.

 *In this article “Densely Connected Layers” is written as “DCL,” and “Convolutional Neural Network” as “CNN.”

2. Why LSTM?

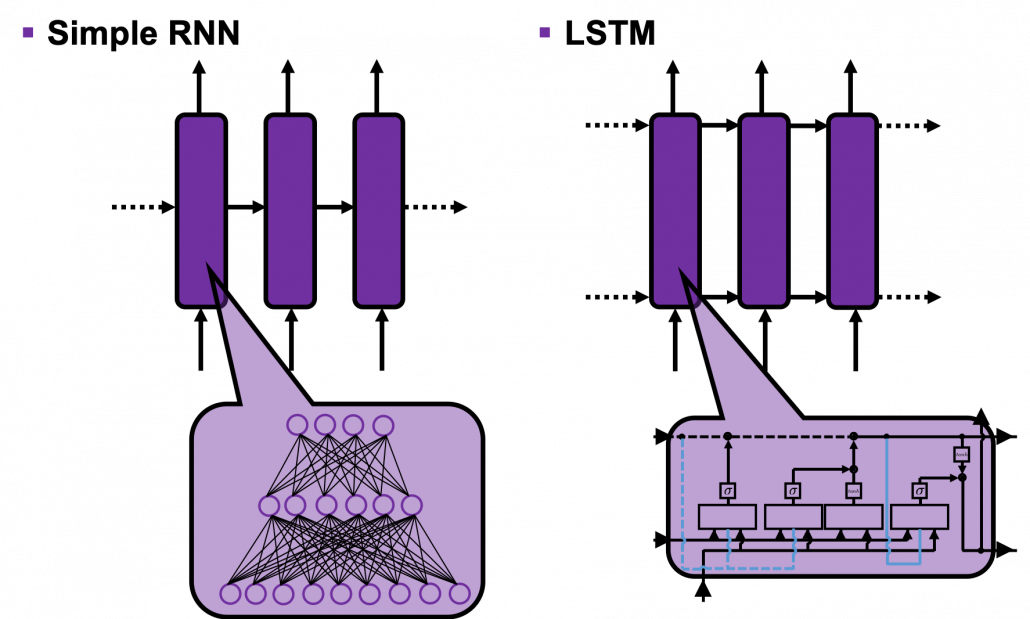
First of all, let’s take a brief look at what I said about the structures of RNNs,  in the first and the second article. A simple RNN is basically densely connected network with a few layers. But the RNN gets an input every time step, and it gives out an output at the time step. Part of information in the middle layer are succeeded to the next time step, and in the next time step, the RNN also gets an input and gives out an output. Therefore, virtually a simple RNN behaves almost the same way as densely connected layers with many layers during forward/back propagation if you focus on its recurrent connections.
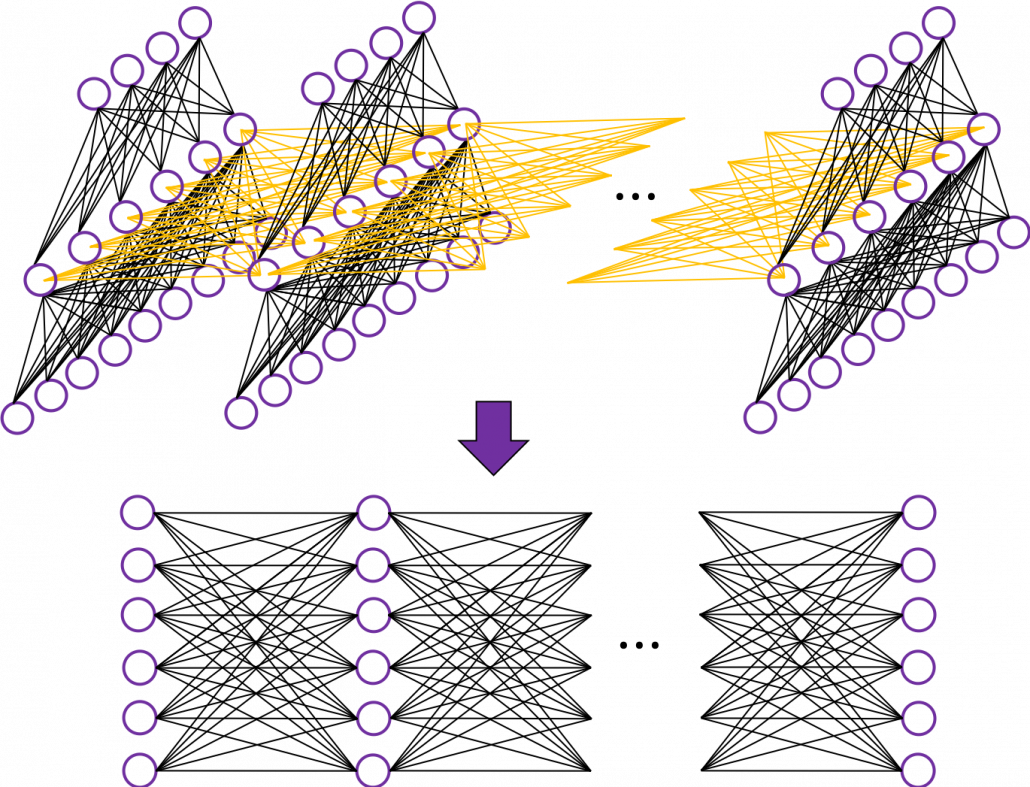
That is why simple RNNs suffer from vanishing/exploding gradient problems, where the information exponentially vanishes or explodes when its gradients are multiplied many times through many layers during back propagation. To be exact, I think you need to consider this problem precisely like you can see in this paper. But for now, please at least keep it in mind that when you calculate a gradient of an error function with respect to parameters of simple neural networks, you have to multiply parameters many times like below, and this type of calculation usually leads to vanishing/exploding gradient problem.

LSTM was invented as a way to tackle such problems as I mentioned in the last article.

3. How to display LSTM

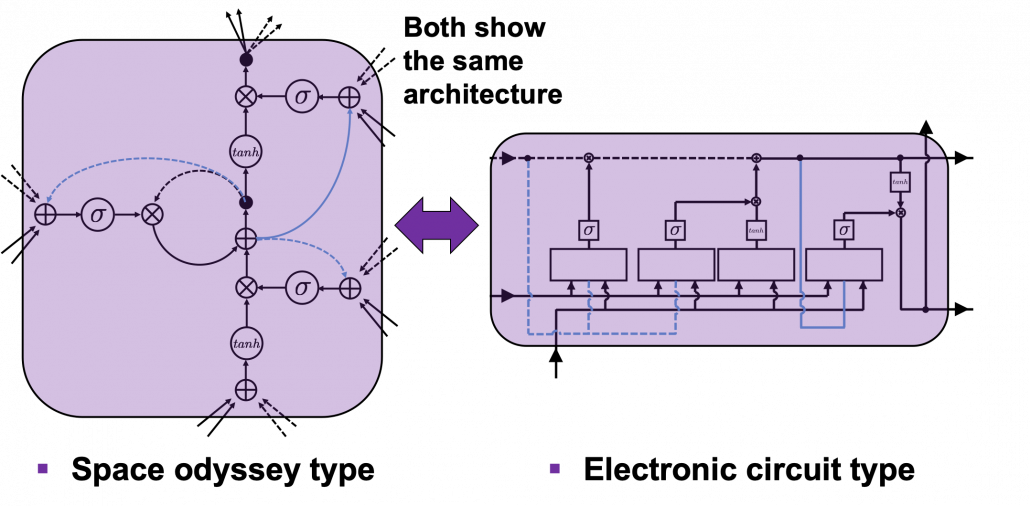
I would like you to just go to image search on Google, Bing, or Yahoo!, and type in “LSTM.” I think you will find many figures, but basically LSTM charts are roughly classified into two types: in this article I call them “Space Odyssey type” and “electronic circuit type”, and in conclusion, I highly recommend you to understand LSTM as the “electronic circuit type.”

*I just randomly came up with the terms “Space Odyssey type” and “electronic circuit type” because the former one is used in the paper I mentioned, and the latter one looks like an electronic circuit to me. You do not have to take how I call them seriously.

However, not that all the well-made explanations on LSTM use the “electronic circuit type,” and I am sure you sometimes have to understand LSTM as the “space odyssey type.” And the paper “LSTM: A Search Space Odyssey,” which I learned a lot about LSTM from,  also adopts the “Space Odyssey type.”

LSTM architectur visualization

The main reason why I recommend the “electronic circuit type” is that its behaviors look closer to that of simple RNNs, which you would have seen if you read my former articles.

*Behaviors of both of them look different, but of course they are doing the same things.

If you have some understanding on DCL, I think it was not so hard to understand how simple RNNs work because simple RNNs  are mainly composed of linear connections of neurons and weights, whose structures are the same almost everywhere. And basically they had only straightforward linear connections as you can see below.

But from now on, I would like you to give up the ideas that LSTM is composed of connections of neurons like the head image of this article series. If you do that, I think that would be chaotic and I do not want to make a figure of it on Power Point. In short, sooner or later you have to understand equations of LSTM.

4. Forward propagation of LSTM in “electronic circuit type”

*For further understanding of mathematics of LSTM forward/back propagation, I recommend you to download my slides.

The behaviors of an LSTM block is quite similar to that of a simple RNN block: an RNN block gets an input every time step and gets information from the RNN block of the last time step, via recurrent connections. And the block succeeds information to the next block.

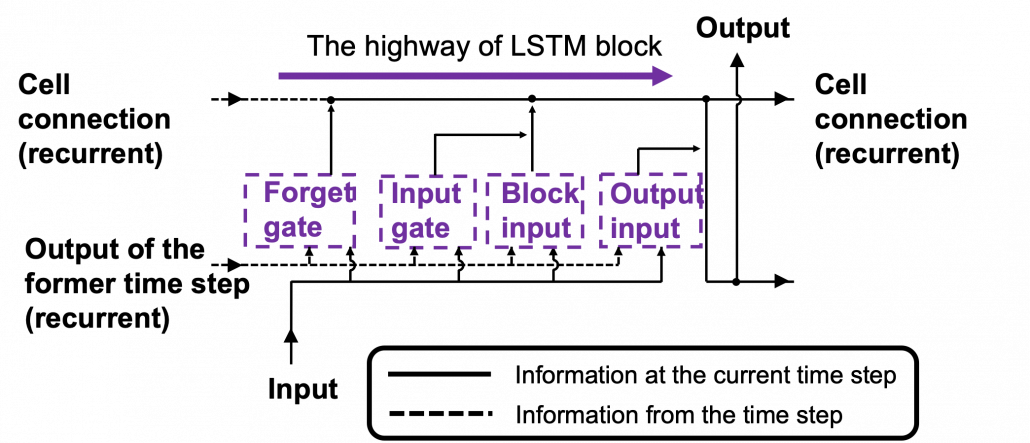
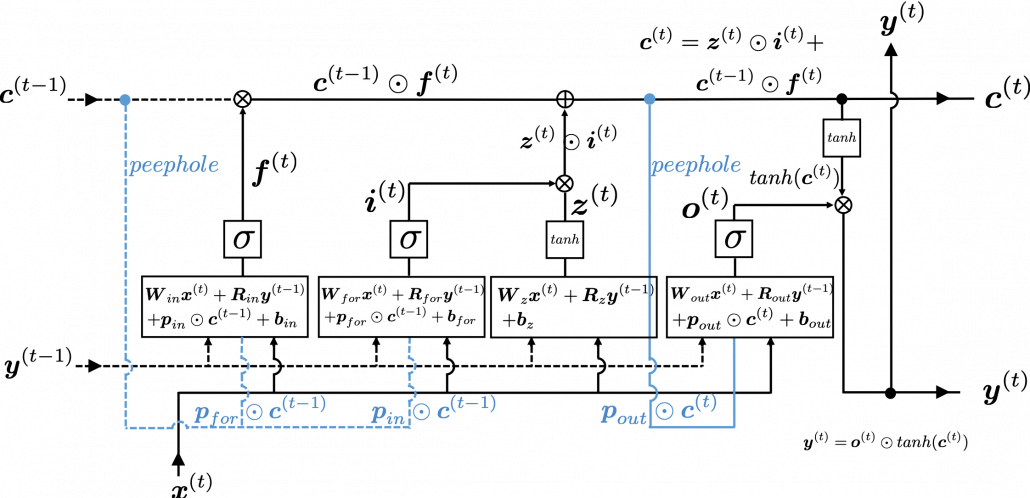
Let’s look at the simplified architecture of  an LSTM block. First of all, you should keep it in mind that LSTM have two streams of information: the one going through all the gates, and the one going through cell connections, the “highway” of LSTM block. For simplicity, we will see the architecture of an LSTM block without peephole connections, the lines in blue. The flow of information through cell connections is relatively uninterrupted. This helps LSTMs to retain information for a long time.

In a LSTM block, the input and the output of the former time step separately go through sections named “gates”: input gate, forget gate, output gate, and block input. The outputs of the forget gate, the input gate, and the block input join the highway of cell connections to renew the value of the cell.

*The small two dots on the cell connections are the “on-ramp” of cell conection highway.

*You would see the terms “input gate,” “forget gate,” “output gate” almost everywhere, but how to call the “block gate” depends on textbooks.

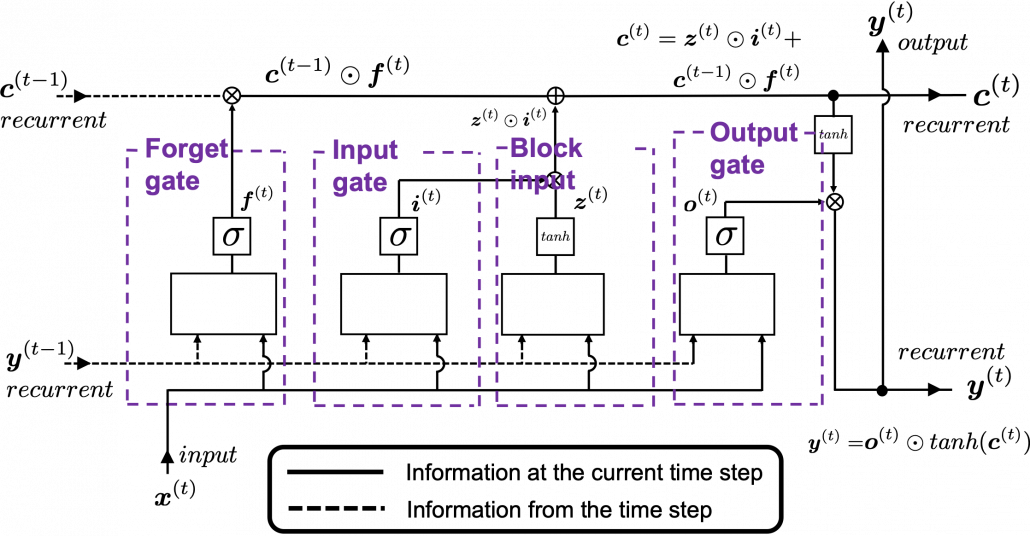
Let’s look at the structure of an LSTM block a bit more concretely. An LSTM block at the time step (t) gets \boldsymbol{y}^{(t-1)}, the output at the last time step,  and \boldsymbol{c}^{(t-1)}, the information of the cell at the time step (t-1), via recurrent connections. The block at time step (t) gets the input \boldsymbol{x}^{(t)}, and it separately goes through each gate, together with \boldsymbol{y}^{(t-1)}. After some calculations and activation, each gate gives out an output. The outputs of the forget gate, the input gate, the block input, and the output gate are respectively \boldsymbol{f}^{(t)}, \boldsymbol{i}^{(t)}, \boldsymbol{z}^{(t)}, \boldsymbol{o}^{(t)}. The outputs of the gates are mixed with \boldsymbol{c}^{(t-1)} and the LSTM block gives out an output \boldsymbol{y}^{(t)}, and gives \boldsymbol{y}^{(t)} and \boldsymbol{c}^{(t)} to the next LSTM block via recurrent connections.

You calculate \boldsymbol{f}^{(t)}, \boldsymbol{i}^{(t)}, \boldsymbol{z}^{(t)}, \boldsymbol{o}^{(t)} as below.

  • \boldsymbol{f}^{(t)}= \sigma(\boldsymbol{W}_{for} \boldsymbol{x}^{(t)} + \boldsymbol{R}_{for} \boldsymbol{y}^{(t-1)} +  \boldsymbol{b}_{for})
  • \boldsymbol{i}^{(t)}=\sigma(\boldsymbol{W}_{in} \boldsymbol{x}^{(t)} + \boldsymbol{R}_{in} \boldsymbol{y}^{(t-1)} + \boldsymbol{b}_{in})
  • \boldsymbol{z}^{(t)}=tanh(\boldsymbol{W}_z \boldsymbol{x}^{(t)} + \boldsymbol{R}_z \boldsymbol{y}^{(t-1)} + \boldsymbol{b}_z)
  • \boldsymbol{o}^{(t)}=\sigma(\boldsymbol{W}_{out} \boldsymbol{x}^{(t)} + \boldsymbol{R}_{out} \boldsymbol{y}^{(t-1)} + \boldsymbol{b}_{out})

*You have to keep it in mind that the equations above do not include peephole connections, which I am going to show with blue lines in the end.

The equations above are quite straightforward if you understand forward propagation of simple neural networks. You add linear products of \boldsymbol{y}^{(t)} and \boldsymbol{c}^{(t)} with different weights in each gate. What makes LSTMs different from simple RNNs is how to mix the outputs of the gates with the cell connections. In order to explain that, I need to introduce a mathematical operator called Hadamard product, which you denote as \odot. This is a very simple operator. This operator produces an elementwise product of two vectors or matrices with identical shape.

With this Hadamar product operator, the renewed cell and the output are calculated as below.

  • \boldsymbol{c}^{(t)} = \boldsymbol{z}^{(t)}\odot \boldsymbol{i}^{(t)} + \boldsymbol{c}^{(t-1)} \odot \boldsymbol{f}^{(t)}
  • \boldsymbol{y}^{(t)} = \boldsymbol{o}^{(t)} \odot tanh(\boldsymbol{c}^{(t)})

The values of \boldsymbol{f}^{(t)}, \boldsymbol{i}^{(t)}, \boldsymbol{z}^{(t)}, \boldsymbol{o}^{(t)} are compressed into the range of [0, 1] or [-1, 1] with activation functions. You can see that the input gate and the block input give new information to the cell. The part \boldsymbol{c}^{(t-1)} \odot \boldsymbol{f}^{(t)} means that the output of the forget gate “forgets” the cell of the last time step by multiplying the values from 0 to 1 elementwise. And the cell \boldsymbol{c}^{(t)} is activated with tanh() and the output of the output gate “suppress” the activated value of \boldsymbol{c}^{(t)}. In other words, the output gatedecides how much information to give out as an output of the LSTM block. The output of every gate depends on the input \boldsymbol{x}^{(t)}, and the recurrent connection \boldsymbol{y}^{(t-1)}. That means an LSTM block learns to forget the cell of the last time step, to renew the cell, and to suppress the output. To describe in an extreme manner, if all the outputs of every gate are always (1, 1, …1)^T, LSTMs forget nothing, retain information of inputs at every time step, and gives out everything. And  if all the outputs of every gate are always (0, 0, …0)^T, LSTMs forget everything, receive no inputs, and give out nothing.

This model has one problem: the outputs of each gate do not directly depend on the information in the cell. To solve this problem, some LSTM models introduce some flows of information from the cell to each gate, which are shown as lines in blue in the figure below.

LSTM inner architecture

LSTM models, for example the one with or without peephole connection, depend on the library you use, and the model I have showed is one of standard LSTM structure. However no matter how complicated structure of an LSTM block looks, you usually cover it with a black box as below and show its behavior in a very simplified way.

5. Space Odyssey type

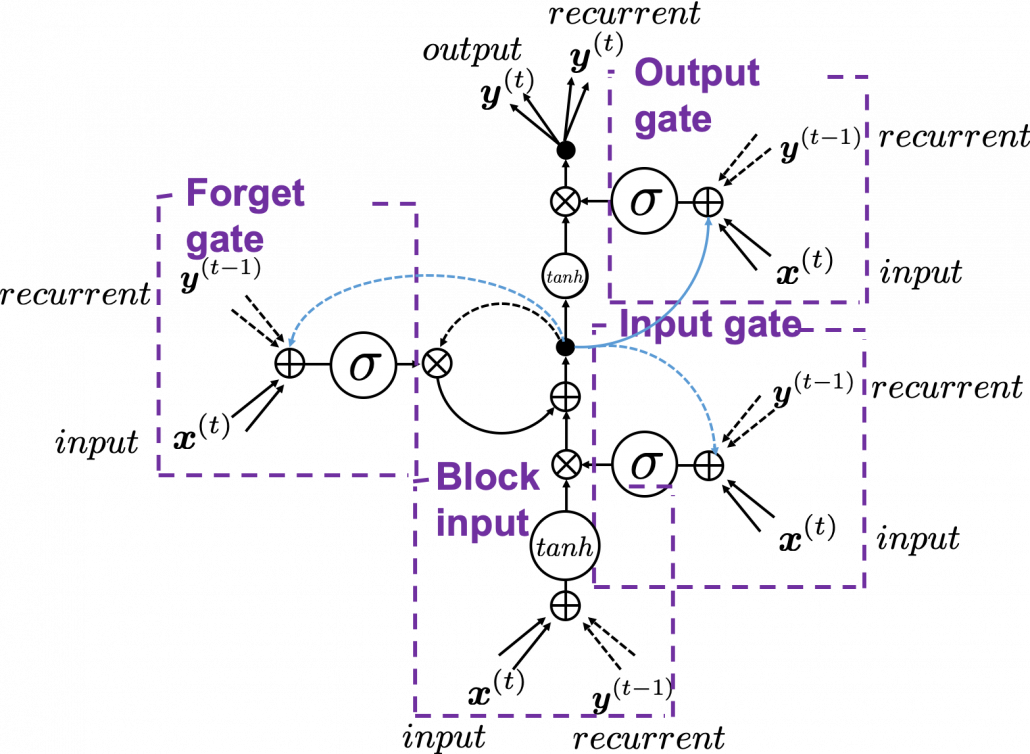
I personally think there is no advantages of understanding how LSTMs work with this Space Odyssey type chart, but in several cases you would have to use this type of chart. So I will briefly explain how to look at that type of chart, based on understandings of LSTMs you have gained through this article.

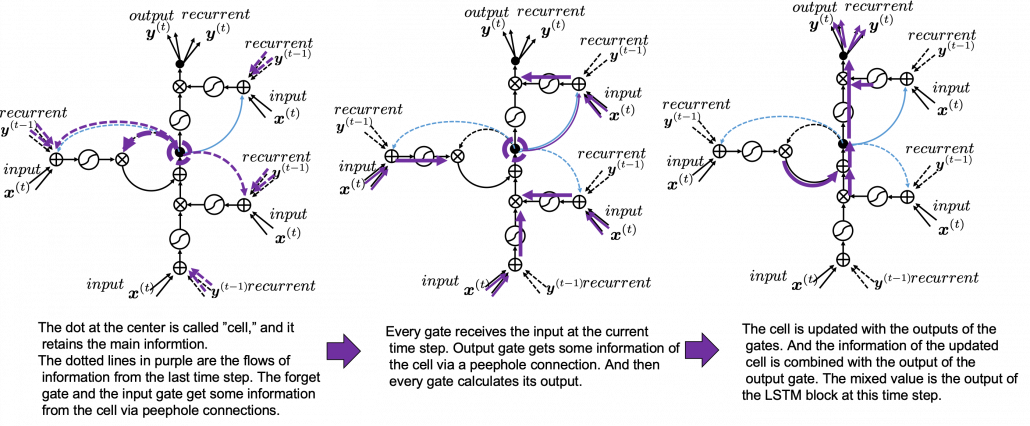
In Space Odyssey type of LSTM chart, at the center is a cell. Electronic circuit type of chart, which shows the flow of information of the cell as an uninterrupted “highway” in an LSTM block. On the other hand, in a Spacey Odyssey type of chart, the information of the cell rotate at the center. And each gate gets the information of the cell through peephole connections,  \boldsymbol{x}^{(t)}, the input at the time step (t) , sand \boldsymbol{y}^{(t-1)}, the output at the last time step (t-1), which came through recurrent connections. In Space Odyssey type of chart, you can more clearly see that the information of the cell go to each gate through the peephole connections in blue. Each gate calculates its output.

Just as the charts you have seen, the dotted line denote the information from the past. First, the information of the cell at the time step (t-1) goes to the forget gate and get mixed with the output of the forget cell In this process the cell is partly “forgotten.” Next, the input gate and the block input are mixed to generate part of new value of the the cell at time step  (t). And the partly “forgotten” \boldsymbol{c}^{(t-1)} goes back to the center of the block and it is mixed with the output of the input gate and the block input. That is how \boldsymbol{c}^{(t)} is renewed. And the value of new cell flow to the top of the chart, being mixed with the output of the output gate. Or you can also say the information of new cell is “suppressed” with the output gate.

I have finished the first four articles of this article series, and finally I am gong to write about back propagation of LSTM in the next article. I have to say what I have written so far is all for the next article, and my long long Power Point slides.


[References]

[1] Klaus Greff, Rupesh Kumar Srivastava, Jan Koutník, Bas R. Steunebrink, Jürgen Schmidhuber, “LSTM: A Search Space Odyssey,” (2017)

[2] Francois Chollet, Deep Learning with Python,(2018), Manning , pp. 202-204

[3] “Sepp Hochreiter receives IEEE CIS Neural Networks Pioneer Award 2021”, Institute of advanced research in artificial intelligence, (2020)
URL: https://www.iarai.ac.at/news/sepp-hochreiter-receives-ieee-cis-neural-networks-pioneer-award-2021/?fbclid=IwAR27cwT5MfCw4Tqzs3MX_W9eahYDcIFuoGymATDR1A-gbtVmDpb8ExfQ87A

[4] Oketani Takayuki, “Machine Learning Professional Series: Deep Learning,” (2015), pp. 120-125
岡谷貴之 著, 「機械学習プロフェッショナルシリーズ 深層学習」, (2015), pp. 120-125

[5] Harada Tatsuya, “Machine Learning Professional Series: Image Recognition,” (2017), pp. 252-257
原田達也 著, 「機械学習プロフェッショナルシリーズ 画像認識」, (2017), pp. 252-257

[6] “Understandable LSTM ~ With the Current Trends,” Qiita, (2015)
「わかるLSTM ~ 最近の動向と共に」, Qiita, (2015)
URL: https://qiita.com/t_Signull/items/21b82be280b46f467d1b

Hypothesis Test for real problems

Hypothesis tests are significant for evaluating answers to questions concerning samples of data.

A statistical hypothesis is a belief made about a population parameter. This belief may or might not be right. In other words, hypothesis testing is a proper technique utilized by scientist to support or reject statistical hypotheses. The foremost ideal approach to decide if a statistical hypothesis is correct is examine the whole population.

Since that’s frequently impractical, we normally take a random sample from the population and inspect the equivalent. Within the event sample data set isn’t steady with the statistical hypothesis, the hypothesis is refused.

Types of hypothesis:

There are two sort of hypothesis and both the Null Hypothesis (Ho) and Alternative Hypothesis (Ha) must be totally mutually exclusive events.

• Null hypothesis is usually the hypothesis that the event wont’t happen.

• Alternative hypothesis is a hypothesis that the event will happen.

Why we need Hypothesis Testing?

Suppose a specific cosmetic producing company needs to launch a new Shampoo in the market. For this situation they will follow Hypothesis Testing all together decide the success of new product in the market.

Where likelihood of product being ineffective in market is undertaken as Null Hypothesis and likelihood of product being profitable is undertaken as Alternative Hypothesis. By following the process of Hypothesis testing they will foresee the accomplishment.

How to Calculate Hypothesis Testing?

  • State the two theories with the goal that just one can be correct, to such an extent that the two occasions are totally unrelated.
  • Now figure a study plan, that will lay out how the data will be assessed.
  • Now complete the plan and genuinely investigate the sample dataset.
  • Finally examine the outcome and either accept or reject the null hypothesis.

Another example

Assume, Person have gone after a typing job and he has expressed in the resume that his composing speed is 70 words per minute. The recruiter might need to test his case. On the off chance that he sees his case as adequate, he will enlist him in any case reject him. Thus, he types an example letter and found that his speed is 63 words a minute. Presently, he can settle on whether to employ him or not.  In the event that he meets all other qualification measures. This procedure delineates Hypothesis Testing in layman’s terms.

In statistical terms Hypothesis his typing speed is 70 words per minute is a hypothesis to be tested so-called null hypothesis. Clearly, the alternating hypothesis his composing speed isn’t 70 words per minute.

So, normal composing speed is population parameter and sample composing speed is sample statistics.

The conditions of accepting or rejecting his case is to be chosen by the selection representative. For instance, he may conclude that an error of 6 words is alright to him so he would acknowledge his claim between 64 to 76 words per minute. All things considered, sample speed 63 words per minute will close to reject his case. Furthermore, the choice will be he was producing a fake claim.

In any case, if the selection representative stretches out his acceptance region to positive/negative 7 words that is 63 to 77 words, he would be tolerating his case.

In this way, to finish up, Hypothesis Testing is a procedure to test claims about the population dependent on sample. It is a fascinating reasonable subject with a quite statistical jargon. You have to dive more to get familiar with the details.

Significance Level and Rejection Region for Hypothesis

Type I error probability is normally indicated by α and generally set to 0.05.  The value of α is recognized as the significance level.

The rejection region is the set of sample data that prompts the rejection of the null hypothesis.  The significance level, α, decides the size of the rejection region.  Sample results in the rejection region are labelled statistically significant at level of α .

The impact of differing α is that If α is small, for example, 0.01, the likelihood of a type I error is little, and a ton of sample evidence for the alternative hypothesis is needed before the null hypothesis can be dismissed. Though, when α is bigger, for example, 0.10, the rejection region is bigger, and it is simpler to dismiss the null hypothesis.

Significance from p-values

A subsequent methodology is to evade the utilization of a significance level and rather just report how significant the sample evidence is. This methodology is as of now more widespread.  It is accomplished by method of a p value. P value is gauge of power of the evidence against null hypothesis. It is the likelihood of getting the observed value of test statistic, or value with significantly more prominent proof against null hypothesis (Ho), if the null hypothesis of an investigation question is true. The less significant the p value, the more proof there is supportive of the alternative hypothesis. Sample evidence is measurably noteworthy at the α level just if the p value is less than α. They have an association for two tail tests. When utilizing a confidence interval to playout a two-tailed hypothesis test, reject the null hypothesis if and just if the hypothesized value doesn’t lie inside a confidence interval for the parameter.

Hypothesis Tests and Confidence Intervals

Hypothesis tests and confidence intervals are cut out of the same cloth. An event whose 95% confidence interval reject the hypothesis is an event for which p<0.05 under the relating hypothesis test, and the other way around. A p value is letting you know the greatest confidence interval that despite everything prohibits the hypothesis. As such, if p<0.03 against the null hypothesis, that implies that a 97% confidence interval does exclude the null hypothesis.

Hypothesis Tests for a Population Mean

We do a t test on the ground that the population mean is unknown. The general purpose is to contrast sample mean with some hypothetical population mean, to assess whether the watched the truth is such a great amount of unique in relation to the hypothesis that we can say with assurance that the hypothetical population mean isn’t, indeed, the real population mean.

Hypothesis Tests for a Population Proportion

At the point when you have two unique populations Z test facilitates you to choose if the proportion of certain features is the equivalent or not in the two populations. For instance, if the male proportion is equivalent between two nations.

Hypothesis Test for Equal Population Variances

F Test depends on F distribution and is utilized to think about the variance of the two impartial samples. This is additionally utilized with regards to investigation of variance for making a decision about the significance of more than two sample.

T test and F test are totally two unique things. T test is utilized to evaluate the population parameter, for example, population mean, and is likewise utilized for hypothesis testing for population mean. However, it must be utilized when we don’t know about population standard deviation. On the off chance that we know the population standard deviation, we will utilize Z test. We can likewise utilize T statistic to approximate population mean. T statistic is likewise utilised for discovering the distinction in two population mean with the assistance of sample means.

Z statistic or T statistic is utilized to assess population parameters such as population mean and population proportion. It is likewise used for testing hypothesis for population mean and population proportion. In contrast to Z statistic or T statistic, where we manage mean and proportion, Chi Square or F test is utilized for seeing if there is any variance inside the samples. F test is the proportion of fluctuation of two samples.

Conclusion

Hypothesis encourages us to make coherent determinations, the connection among variables, and gives the course to additionally investigate. Hypothesis for the most part results from speculation concerning studied behaviour, natural phenomenon, or proven theory. An honest hypothesis ought to be clear, detailed, and reliable with the data. In the wake of building up the hypothesis, the following stage is validating or testing the hypothesis. Testing of hypothesis includes the process that empowers to concur or differ with the expressed hypothesis.

Must-have Skills to Master Data Science

The need to process a massive amount of data sets is making Data Science the most-demanded job across diverse industry verticals. In today’s times, organizations are actively looking for Data Scientists.

But What does a Data Scientist do?

Data Scientist design data models, create various algorithms to extract the data the organization needs, and then they analyze the gathered data and communicate the data insights with the business stakeholders.

If you are looking forward to pursuing a career in Data Science, then this blog is for you 🙂

Data Scientists often come from many different educational and work experience backgrounds but few skills are common and essential.

Let’s have a look at all the essential skills required to become a Data Scientist:

  1. Multivariable Calculus & Linear Algebra
  2. Probability & Statistics
  3. Programming Skills (Python & R)
  4. Machine Learning Algorithms
  5. Data Visualization
  6. Data Wrangling
  7. Data Intuition

Let’s dive deeper into all these skills one by one.

Multivariable Calculus & Linear Algebra:

Having a solid understanding of math concepts is very helpful for a Data Scientist.

Key Concepts:

  • Matrices
  • Linear Algebra Functions
  • Derivatives and Gradient
  • Relational Algebra

Probability & Statistics:

Probability and Statistics play a major role in Data Science for estimation and prediction purposes.

Key concepts required:

  • Probability Distributions
  • Conditional Probability
  • Bayesian Thinking
  • Descriptive Statistics
  • Random Variables
  • Hypothesis Testing and Regression
  • Maximum Likelihood Estimation

Programming Skills (Python & R):

Python :

Start with Python Fundamentals using a jupyter notebook, which comes pre-packaged with Python libraries.

Important Python Libraries used:

  • NumPy (For Data Exploration)
  • Pandas (For Data Exploration)
  • Matplotlib (For Data Visualization)

R:

It is a programming language and software environment used for statistical computing and graphics. 

Key Concepts required:

  • R Languages fundamentals and basic syntax
  • Vectors, Matrices, Factors
  • Data frames
  • Basic Graphics

Machine Learning Algorithms

Machine Learning is an innovative and essential field in the industry. There are quite a few algorithms out there, major ones are as follows –

  • Linear Regression
  • Logistic Regression
  • Decision Trees
  • Random Forest
  • Naïve Bayes
  • Support Vector Machines
  • Dimensionality Reduction
  • K-means
  • Artificial Neural Networks

Data Visualization:

Data visualization is very essential when it comes to analyzing a massive amount of information and data. 

To make data-driven decisions, data visualization tools, and technologies are essential in the world of Data Science.

Data Visualization tools:

  • Tableau
  • Microsoft Power Bi
  • E Charts
  • Datawrapper
  • HighCharts

Data Wrangling:

Data wrangling, this term refers to the process of cleaning and refining the messy and complex data available into a more usable format. 

It is considered one of the most crucial parts of working with data.

Important Steps to Data Wrangling:

  1. Discovering
  2. Structuring
  3. Cleaning
  4. Enriching
  5. Validating
  6. Documenting

Tools used:

  • Tabula
  • Google DataPrep
  • Data Wrangler
  • CSVkit

Data Wrangling can be done using Python and R.

Data Intuition:

Data Intuition in Data Science is an intuitive understanding of concepts. It’s one of the most significant skills required to become a Data Scientist.

It’s about recognizing patterns where none are observable on the surface.

This is something that you need to develop. It is a skill that will only come with experience.

A Data Scientist should know which Data Science methods to apply to the problem at hand.

Conclusion:

 As you can see, all these skills – from programming to algorithmic methods, work with one another to build on top of each other for gathering deeper data insights.

There are a wide number of courses available online for developing these skills and to help you become a true talent in this data industry.

Sure, this journey isn’t an easy one to follow but it’s not impossible. With sheer determination and consistency, you will be able to cross all the hurdles in your Data Science career path.

Process Mining mit Celonis – Artikelserie

Der erste Artikel dieser Artikelserie Process Mining Tools beschäftigt sich mit dem Anbieter Celonis. Das 2011 in Deutschland gegründete Unternehmen ist trotz wachsender Anzahl an Wettbewerbern zum Zeitpunkt der Veröffentlichung dieses Artikels der eindeutige Marktführer im Bereich Process Mining.

Celonis Process Mining – Teil 1 der Artikelserie

Celonis Process Mining ist 2011 als reine On-Premise-Lösung gestartet und seit 2018 auch als Cloud-Lösuung zu haben. Übersicht zu den vier verschiedenen Produktversionen der Celonis Process Mining Lösungen:

Celonis Snap Celonis Enterprise Celonis Academic Celonis Consulting
Lizenz:  Kostenfrei Kostenpflichtige Lösungspakete Kostenfrei Consulting Lizenz on Demand
Zielgruppe:  Für kleine Unternehmen und Einzelanwender Für mittel- und große Unternehmen Für akademische Einrichtungen und Studenten Für Berater
Datenquellen: ServiceNow, CSV/XLS -Datei Beliebig (On-Premise- und Cloud – Anbindungen) ServiceNow, CSV/XLS/XES –Datei oder Demosysteme Beliebig (On-Premise- und Cloud – Anbindungen)
Datenvolumen: Limitiert auf 500 MB Event-Log-Daten Unlimitierte Datenmengen (Größte Installation 50 TB) Unlimitierte Datenmengen Unlimitierte Datenmengen (Größte Installation 30 TB
Architektur: Cloud & On-Premise Cloud & On-Premise Cloud & On-Premise Cloud & On-Premise

Dieser Artikel bezieht sich im weiteren Verlauf auf die Celonis Enterprise Version, wenn nicht anders gekennzeichnet. Spezifische Unterschiede unter den einzelnen Produkten und weitere Informationen können auf der Website von Celonis entnommen werden.

Bedienbarkeit und Anpassungsfähigkeit der Analysen

In Sachen Bedienbarkeit punktet Celonis mit einem sehr übersichtlichen und einsteigerfreundlichem Userinterface. Jeder der mit BI-Tools wir z.B. „Power-BI“ oder „Tableau“ gearbeitet hat, wird sich wahrscheinlich schnell zurechtfinden.

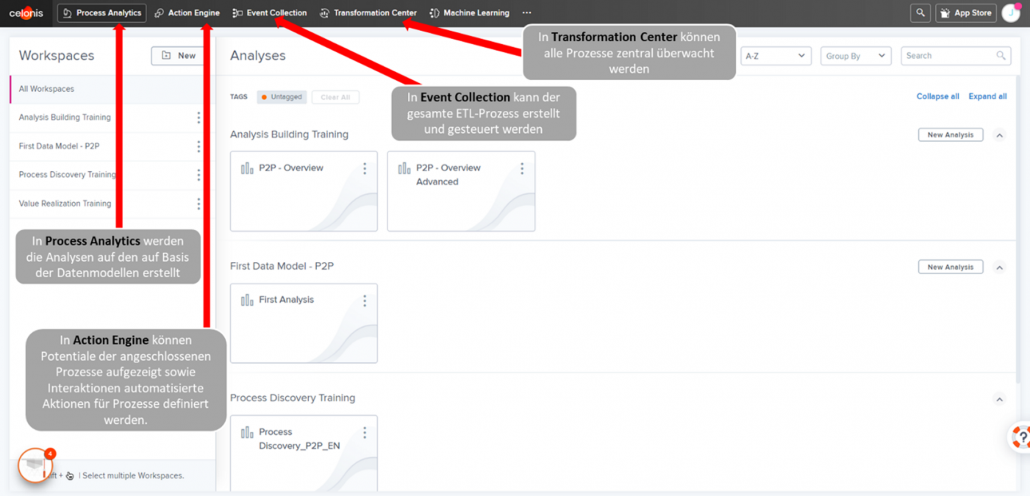
Userinterface Celonis

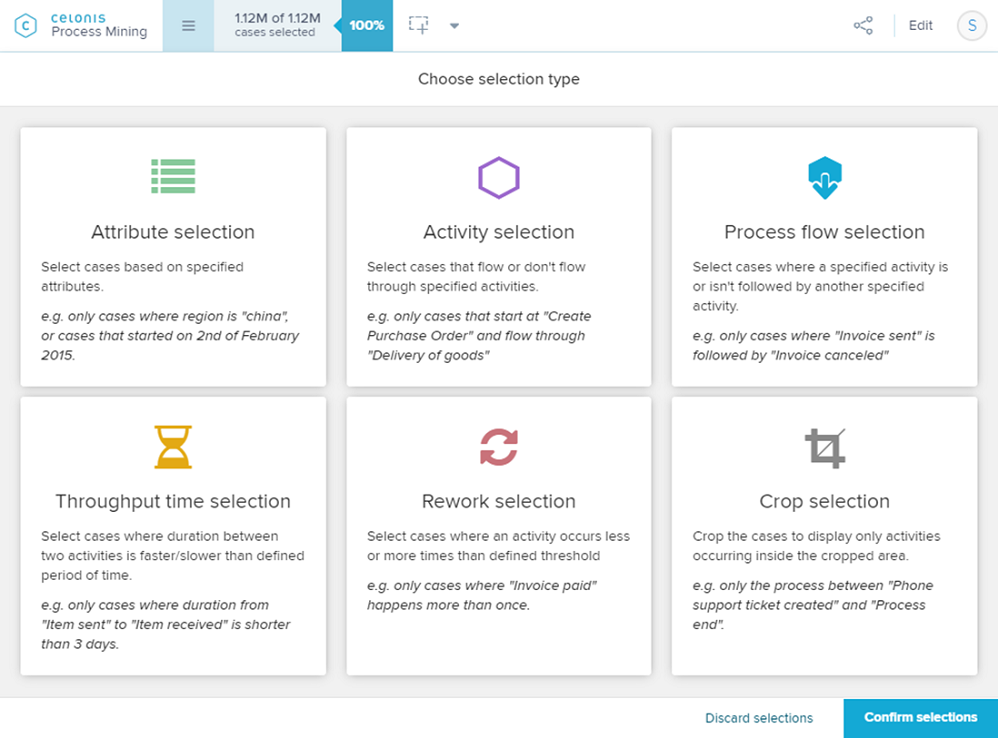
Abbildung 1: Userinterface von Celonis. Über die Reiter kann direkt von der Analyse (Process Analytics) zu den ETL-Prozessen (Event Collection) gewechselt werden.

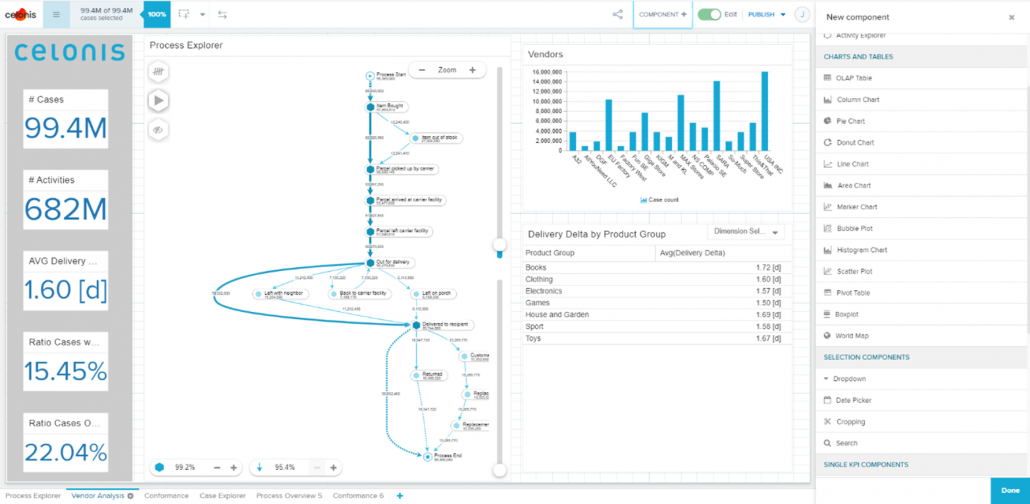
Das Erstellen von Analysen funktioniert intuitiv und schnell, auch weil die einzelnen Komponentenbausteine lediglich per drag & drop platziert und mit den gewünschten Dimensionen und KPI’s bestückt werden müssen.

Process Analytics im Process Explorer

Abbildung 2: Typische Analyse im Edit Modus. Neue Komponenten können aus dem Reiter (rechts im Bild) mittels drag & drop auf der Dashboard Bearbeitungsfläche platziert werden.

Darüber hinaus bietet Celonis mit seinem kostenlosen Programm „Celonis Acadamy“ einen umfangreichen und leicht verständlichen Pool an Trainingseinheiten für die verschiedenen User-Rollen: „Snap“, „Executive“, „Business User“, „Analyst“ und „Data Engineer“. Einsteiger finden sich nach der Absolvierung der Grundkurse etwa nach vier Stunden in dem Tool zurecht.

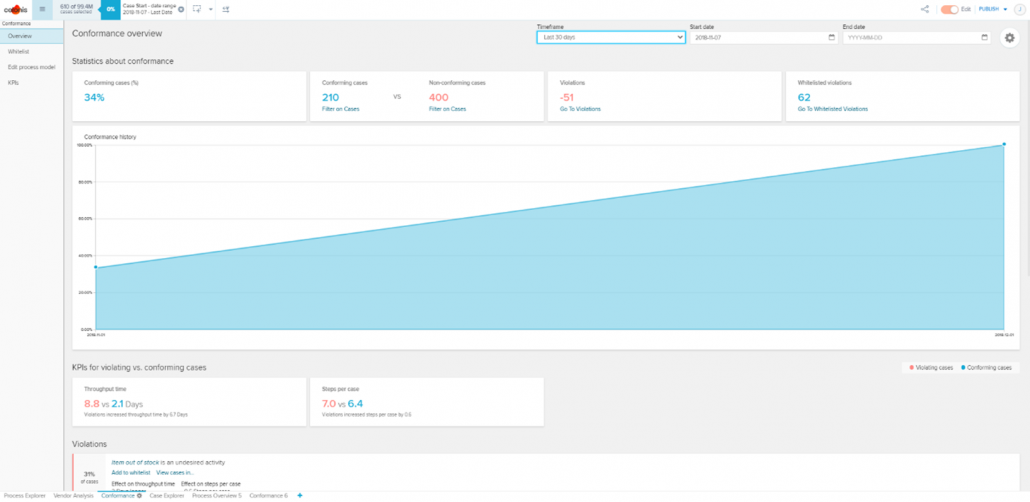
Conformance Analyse In Celonis

Abbildung 3: Conformance Analyse In Celonis. Es kann direkt analysiert werden, welche Art von Verstößen welche Auswirkungen haben und mit welcher Häufigkeit diese auftreten.

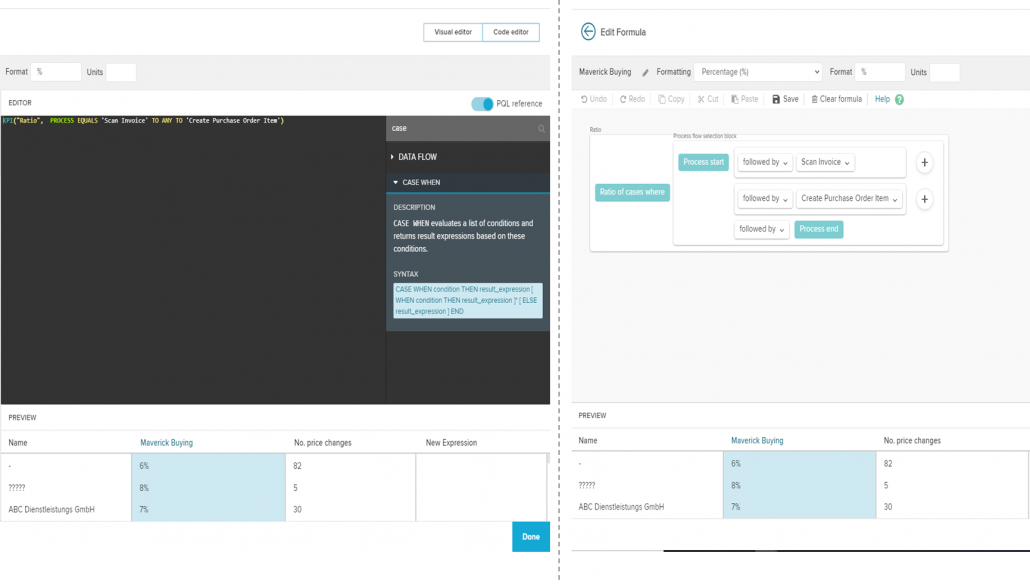
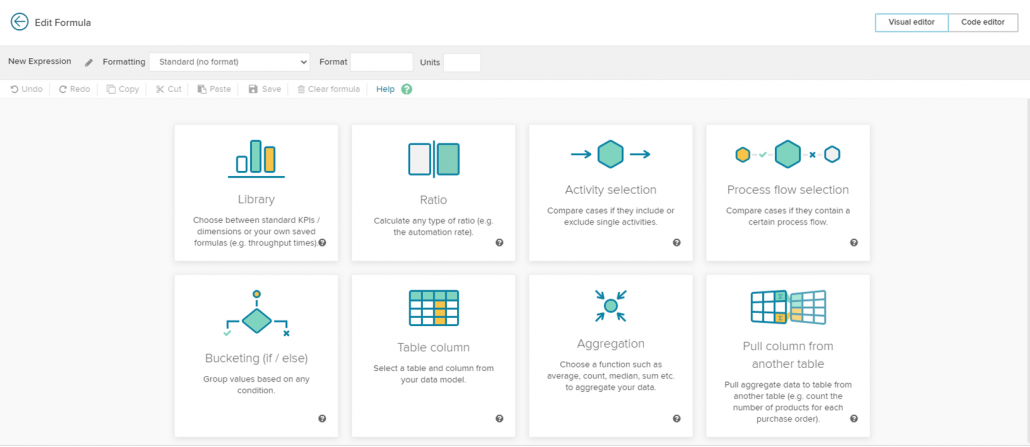
Die Definition von eigenen KPIs erfolgt mittels übersichtlichem Code Editor. Die verwendete proprietäre und patentierte Programmiersprache lautet PQL (Process Query Language) , dessen Syntax stark an SQL angelehnt ist und alle prozessrelevanten Berechnungen ermöglicht. Noch einsteigerfreundlicher ist der Visual Editor, in welchem KPIs alternativ mit zahlreicher visueller Unterstützung und über 130 mathematischen Operatoren erstellt werden können – ganz ohne Coding Erfahrung.
Mit Hilfe von über 30 Komponenten lassen sich alle üblichen Charts und Grafiken erstellen. Ich hatte das Gefühl, dass die Auswahl grundsätzlich ausreicht und dem Erkenntnisgewinn nicht im Weg steht. Dieses Gefühl rührt nicht zuletzt daher, dass die vorgefertigten Features, wie zum Beispiel „Conformance“ direkt und ohne Aufwand implementiert werden können und bemerkenswerte Erkenntnisse liefern. Kurzum: Ja es ist vieles vorgefertigt, aber hier wurde mit hohen Qualitätsansprüchen vorgefertigt!

Celonis Code Editor vs Visual Editor

Abbildung 4: Coder Editor (links) und Visual Editor (rechts). Während im Code Editor mit PQL geschrieben werden muss, können Einsteiger im Visual Editor visuelle Hilfestellungen nehmen, um KPIs zu definieren.

Diese Flexibilität erscheint groß und bedient mehrere Zielgruppen, beginnend bei den Einsteigern. Insbesondere da das Verständnis für den Code Editor und somit für PQL durch die Arbeit mit dem Visual Code Editor gefördert wird. Wer SQL-Kenntnisse mitbringt, wird sehr schnell ohne Probleme KPIs im Code Editor definieren können. Erfahrenen Data Engineers stünde es dennoch frei, die Entwicklungsarbeit auf die Datenbankebene zu verschieben.

Celonis Visual Editor

Abbildung 5: Mit Hilfe zahlreicher Möglichkeiten können Einsteiger im Visual Editor visuelle Hilfestellungen nehmen, um individuelle KPIs zu definieren.

Nachdem die ersten Analysen erstellt wurden, steht der Prozessanalyse nichts mehr im Wege. Während sich per Knopfdruck auf alle visualisierten Datenpunkte filtern lässt, unterstützt auch hier Celonis zusätzlich mit zahlreichen sogenannten ‘Auswahlansichten’, um die Entdeckung unerwünschter oder betrügerischer Prozesse so einfach wie das Googeln zu machen.

Predefined dashboard apps

Abbildung 6: Die anwenderfreundlichen Auswahlarten ermöglichen es dem Benutzer, einfach mit wenigen Klicks nach Unregelmäßigkeiten oder Mustern in Transaktionen zu suchen und diese eingehend zu analysieren.

Integrationsfähigkeit

Die Celonis Enterprise Version ist sowohl als Cloud- und On-Premise-Lösung verfügbar. Die Cloud-Lösung bietet die folgenden Vorteile: Zum einen zusätzliche Leistungen wieCloud Connectoren, einer sogenannten Action Engine die jeden einzelnen Mitarbeiter in einem Unternehmen mit datengetriebenen nächstbesten Handlungen unterstützt, intelligenter Process Automation, Machine Learning und AI, einen App Store sowie verschiedene Boards. Diese Erweiterungen zeigen deutlich den Anspruch des Münchner Process Mining Vendors auf, neben der reinen Prozessanalyse Unternehmen beim heben der identifizierten Potentiale tatkräftig zu unterstützen. Darüber hinaus kann die Cloud-Lösung punkten mit, einer schnellen Amortisierung, bedarfsgerechter Skalierbarkeit der Kapazitäten sowie einen noch stärkeren Fokus auf Security & Compliance. Darüber hinaus  erfolgen regelmäßig Updates.

Celonis Process Automation

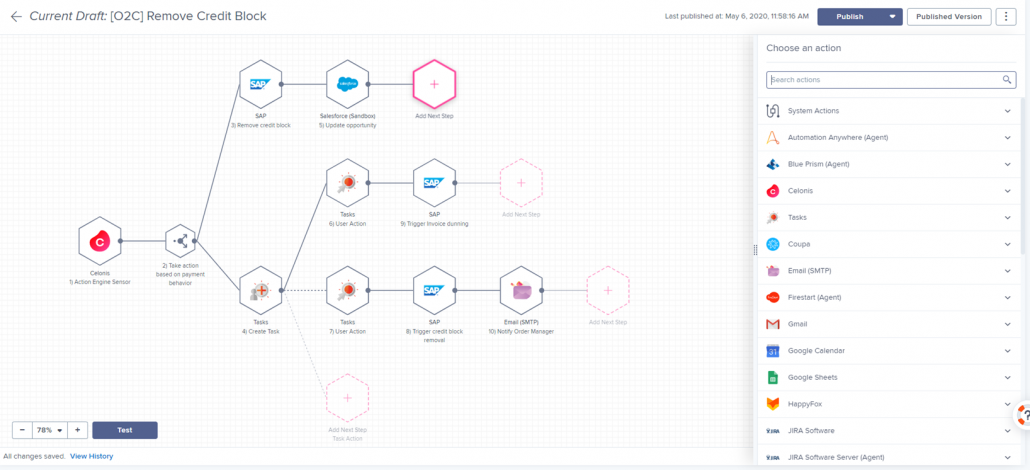
Abbildung 7: Celonis Process Automation ermöglicht Unternehmen ihre Prozesse auf intelligente Art und Weise so zu automatisieren, dass die Zielerreichung der jeweiligen Fachabteilung im Fokus stehen. Auch hier trumpft Celonis mit über 30+ vorgefertigten Möglichkeiten von der Automatisierung von Kommunikation, über Backend Automatisierung in Quellsystemen bis hin zu Einbindung von RPA Bots und vielem mehr.

Der Schwenk von Celonis scheint in Richtung Cloud zu sein und es bleibt abzuwarten, wie die On-Premise-Lösung zukünftig aussehen wird und ob sie noch angeboten wird. Je nach Ausgangssituation gilt es hier abzuwägen, welche der beiden Lösungen die meisten Vorteile bietet. In jedem Fall wird Celonis als browserbasierte Webanwendung für den Endanwender zur Verfügung gestellt. Die folgende Abbildung zeigt eine beispielhafte Celonis on-Premise-Architektur, bei welcher der User über den Webbrowser Zugang erhält.

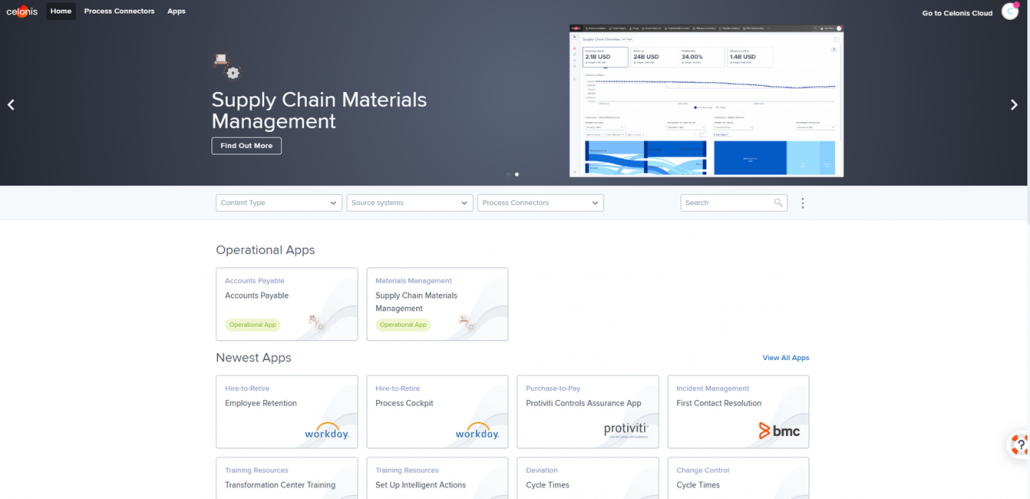
Celonis bringt eine ausreichende Anzahl an vordefinierten Datenschnittstellen mit, wodurch sowohl gängige on-Premise Datenbanken / ERP-Systeme als auch Cloud-Dienste, wie z. B. „ServiceNow“ oder „Salesforce“ verbunden werden können. Im „App Store“ können zusätzlich sogenannte „prebuild Process-Connectors“ kostenlos erworben werden. Diese erstellen die Verbindung und erzeugen das Datenmodell (Extract and Transform) für einen Standard Prozess automatisch, so dass mit der Analyse direkt begonnen werden kann. Über 500 vordefinierte Analysen für Standard Prozesse gibt es zusätzlich im App Store. Dadurch kann die Bearbeitungszeit für ein Process-Mining Projekt erheblich verkürzt werden, vorausgesetzt das benötigte Datenmodel weicht im Kern nicht zu sehr von dem vordefinierten Model ab. Sollten Schnittstellen mal nicht vorhanden sein, können Daten auch als CSV oder XLS Format importiert werden.

Celonis App Store

Abbildung 8: Der Celonis App Store beinhaltet über 100 Prozesskonnektoren, über 500 vorgefertigte Analysen und über 80 Action Engine Fähigkeiten die kostenlos mit der Cloud Lizenz zur Verfügung stehen

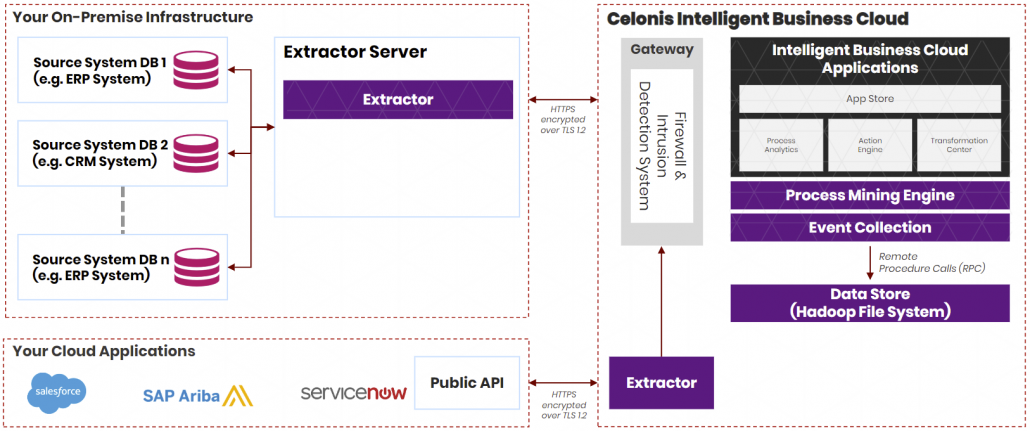
Auch wenn von einer 100%-Cloud gesprochen wird, muss für die Anbindung von unternehmensinternen on-premise Datenquellen (z. B. lokale Instanzen von SAP ERP, Oracle ERP, MS Dynamics ERP) ein sogenannter Extractor on-premise installiert werden.

Celonis Extractors

Abbildung 9: Celonis Extractor muss für die Anbindung von On-Premise Datenquellen ebenfalls On-Premise installiert werden. Dieser arbeitet wie ein Gateway zur Celonis Intelligent Business Cloud (IBC). Die IBC enthält zudem einen eigenen Extratctor für die Anbindung von Daten aus anderen Cloud-Systemen.

Celonis bietet in der Enterprise-Ausführung zudem ein umfassendes Benutzer-Berechtigungsmanagement, so dass beispielsweise für Analysen im Einkauf die Berechtigungen zwischen dem Einkaufsleiter, Einkäufern und Praktikanten im Einkauf unterschieden werden können. Auch dieser Punkt ist für viele Unternehmen eine Grundvoraussetzung für einen eventuellen unternehmensweiten Roll-Out.

Skalierbarkeit

In Punkto großen Datenmengen kann Celonis sich sehen lassen. Allein für „Uber“ verarbeitet die Cloud rund 50 Millionen Datensätze, wobei ein einzelner mehrere Terabyte (TB) groß sein kann. Der größte einzelne Datenblock, den Celonis analysiert, beträgt wohl etwas über 50 TB. Celonis bietet somit Process Mining, zeitgerecht im Bereich Big Data an und kann daher auch viele große renommierten Unternehmen zu seinen Kunden zählen, wie zum Beispiel Siemens, ABB oder BMW. Doch wie erweiterbar und flexibel sind die erstellten Datenmodelle? An diesem Punkt konnte ich keine Schwierigkeiten feststellen. Celonis bietet ein übersichtlich gestaltetes Userinterface, welches das Datenmodell mit seinen Tabellen und Beziehungen sauber darstellt. Modelliert wird mit SQL-Befehlen, wodurch eine zusätzliche Abfragesprache entfällt. Der von Celonis gewählte SQL-Dialekt ist Vertica. Dieser ist keineswegs begrenzt und bietet die ausreichende Tiefe, welche an dieser Stelle benötigt wird. Die Erweiterbarkeit sowie die Flexibilität der Datenmodelle wird somit ausschließlich von der Arbeit des Data Engineer bestimmt und in keiner Weise durch Celonis selbst eingeschränkt. Durch das Zurückgreifen auf die Abfragesprache SQL, kann bei der Modellierung auf eine sehr breite Community zurückgegriffen werden. Darüber hinaus können bestehende SQL-Skripte eingefügt und leicht angepasst werden. Und auch die Suche nach einem geeigneten Data Engineer gestaltet sich dadurch praktisch, da SQL eine der meistbeherrschten Abfragesprachen ist.

Zukunftsfähigkeit

Machine Learning umfasst Data Mining und Predictive Analytics und findet vermehrt den Einzug ins Process Mining. Auch ist es längst ein wesentlicher Bestandteil von Celonis. So basiert z. B. das Feature „Conformance“ auf Machine Learning Algorithmen, welche zu den identifizierten Prozessabweichungen den Einfluss auf das Geschäft berechnen. Aber auch Lösungen zu den Identifizierten Problemen werden von Verfahren des maschinellen Lernens dem Benutzer vorgeschlagen. Was zusätzlich in Sachen Machine Learning von Celonis noch bereitgestellt wird, ist die sogenannte Machine-Learning-Workbench, welche in die Intelligent Business Cloud integriert ist. Hier können eigene Anwendungen mit Machine Learning auf Basis der Event-Log Daten entwickelt und eingesetzt werden, um z. B. Vorhersagen zu Lieferzeiten treffen zu können.

Task Mining ist einer der nächsten Schritte im Bereich Process Mining, der den Detailgrad für Analysen von Prozessen bis hin zu einzelnen Aufgaben auf Mausklick-Ebene erhöht. Im Oktober 2019 hatte Celonis bereits angekündigt, dass die Intelligent Business Cloud um eben diese neue Technik der Datenerhebung und -analyse erweitert wird. Die beiden Methoden Prozess Analyse und Task Mining ergänzen sich ausgezeichnet. Stelle ich in der Prozess Analyse fest, dass sich eine bestimmte Aktivität besonders negativ auf meine gewünschte Performance auswirkt (z. B. Zeit), können mit Task Mining diese Aktivität genauer untersuchen und die möglichen Gründe sehr granular betrachten. So kann ich evtl. feststellen das Mitarbeiter bei einer bestimmten Art von Anfrage sehr viel Zeit in Salesforce verbringen, um Informationen zu sammeln. Hier liegt also viel Potential versteckt, um den gesamten Prozess zu verbessern. In dem z.B. die Informationsbeschaffung erleichtert wird oder evtl. der Anfragetyp optimiert wird, kann dieses Potential genutzt werden. Auch ist Task Mining die ideale Grundlage zur Formulierung von RPA-Lösungen.

Ebenfalls entscheidend für die Zukunftsfähigkeit von Process Mining ist die Möglichkeit, Verknüpfungen zwischen unterschiedlichen Geschäftsprozesse zu erkennen. Häufig sind diese untrennbar miteinander verbunden und der Output eines Prozesses bildet den Input für einen anderen. Mit prozessübergreifenden Multi-Event Logs bietet Celonis die Möglichkeit, genau diese Verbindungen aufzuzeigen. So entsteht ein einheitliches Prozessmodell für das gesamte Unternehmen. Und das unter bestimmten Voraussetzungen auch in nahezu Echtzeit.

Werden die ersten Entwicklungen im Bereich Machine Learning und Task Mining von Celonis weiter ausgebaut, ist Celonis weiterhin auf einem zukunftssicheren Weg. Unternehmen, die vor allem viel Wert auf Enterprise-Readiness und eine intensive Weiterentwicklung legen, dürften mit Celonis auf der sicheren Seite sein.

Preisgestaltung

Die Preisgestaltung der Enterprise Version wird von Celonis nicht transparent kommuniziert. Angeboten werden verschiedene kostenpflichtige Lösungspakete, welche sich aus den Anforderungen eines Projektes ergeben.  Generell stufe ich die Celonis Enterprise Version als Premium Produkt ein. Dies liegt auch daran, weil die Basisausführung der Celonis Enterprise Version bereits sehr umfänglich ist und neben der Software Subscription standardmäßig auch mit Wartung und Support kommt. Zusätzlich steckt mittlerweile sehr viel Entwicklungsarbeit in der Celonis Process Mining Plattform, welche weit über klassische Process Discovery Solutions hinausgeht.  Für kleinere Unternehmen mit begrenztem Budget gibt es daher zwischen der kostenfreien Snap Version und den Basis Paketen der Enterprise Version oft keine Interimslösung.

Fazit

Insgesamt stellt Celonis ein unabhängiges und leistungsstarkes Process Mining Tool bereit, wobei der Anwender die Wahl zwischen einer on-Premise-Lösung sowie einer Cloud-Lösung hat. Die „prebuild Process-Connectors“ und die vordefinierten Analysen können ein Process Mining Projekt signifikant beschleunigen und somit die Time-to-Value lukrativ verkürzen. Die Analyse Tools sind leicht bedienbar und schaffen dank integrierter Machine Learning Algorithmen Optimierungspotentiale.  Positiv ist auch zu bewerten, dass Celonis ohne speziellen Syntax auskommt und mittelmäßige SQL-Fähigkeiten somit völlig ausreichend sind, um das vollumfänglich zu nutzen. Diesen vielen positiven Aspekten steht eigentlich nur die hohe Preisgestaltung für die Enterprise Version gegenüber. Ob diese im Einzelfall gerechtfertigt ist, sollte situationsabhängig evaluiert werden. Sicherlich richtet sich Celonis Enterprise in erster Linie an größere Unternehmen, welche komplexe Prozesse mit hohen Datenvolumina analysieren möchte.  Mit Celonis-Snap können jedoch auch kleine Unternehmen und Start-ups einen begrenzten Einblick in dieses gut gelungene Process Mining Tool erhalten.

AI Voice Assistants are the Next Revolution: How Prepared are You?

By 2022, voice-based shopping is predicted to rise to USD 40 billion, based on the data from OC&C Strategy Consultants. We’re in an era of ‘voice’ where drastic transformation is seen between the way AI and voice recognition are changing the way we live.

According to the survey, the surge of voice assistants is said to be driven by the number of homes that used smart speakers, as such that the rise is seen to grow from 13% to 55%. Nonetheless, Amazon will be one of the leaders to dominate the new channel having the largest market share.

Perhaps this is the first time you’ve heard about the voice revolution. Well, why not, based on multiple researchers, it is estimated that the number of voice assistants will grow to USD 8 billion by 2023 from USD 2.5 billion in 2018.

But what is voice revolution or voice assistant or voice search?

It was only until recently that the consumers have started learning about voice assistants which further predicts to exist in the future.

You’ve heard of Alexa, Cortana, Siri, and Google Assistant, these technologies are some of the world’s greatest examples of voice assistants. They will further help to drive consumer behavior as well as prepare the companies and adjust based on the industry demands. Consumers can now transform the way they act, search, and advertise their brand through voice technology.

Voice search is a technology to help users or consumers perform a search on the website by simply asking a question on their smartphone, their computer, or their smart device.

The voice assistant awareness: Why now?

As surveyed by PwC, amongst the 90% respondents, about 72% have been recorded to use voice assistant while merely 10% said they were clueless about voice-enabled devices and products. It is noted, the adoption of voice-enabled was majorly driven by children, young consumers, and households earning an income of around >USD100k.

Let us have a glance to ensure the devices that are used mainly for voice assistance: –

  • Smartphone – 57%
  • Desktop – 29%
  • Tablet – 29%
  • Laptop – 29%
  • Speaker – 27%
  • TV remote – 21%
  • Car navigation – 20%
  • Wearable – 14%

According to the survey, most consumers that use voice-assistants were the younger generation, aged between 18-24.

While individuals between the ages 25-49 were said to use these technologies in a much more statistical manner, and are called the “heavy users.”

Significance of mobile voice assistants: What is the need?

Although mobile is accessible everywhere, you will merely find three out of four consumers using mobile voice assistants in their household i.e. 74%.

Mobile-based AI chatbots have taken our lives by storm, thus providing the best solution to both the customers and agents in varied areas – insurance, travel, and education, etc.

A certain group of individuals said they needed privacy while speaking to their device and that sending a voice command in public is weird.

Well, this simply explains why 18-24 aged group individuals prefer less use of voice assistants. However, this age group tends to spend more time out of their homes.

Situations where voice assistants can be used – standalone speakers Vs mobile

Cooking

  • Standalone speakers – 65%
  • Mobile – 37%

Multitasking

  • Standalone speakers – 62%
  • Mobile – 12%

Watching TV

  • Standalone speakers – 57%
  • Mobile – 43%

In bed

  • Standalone speakers – 38%
  • Mobile – 37%

Working

  • Standalone speakers – 29%
  • Mobile – 25%

Driving

  • Standalone speakers – 0%
  • Mobile – 40%

By the end of 2020, nearly half of all the searches made will be voice-based, as predicted by Comscore, a media analytics firm.

Don’t you think voice-based assistant is changing the way businesses function? Thanks to the advent of AI!

  • A 2018 study on AI chatbots and voice assistants by Spiceworks said, 24% of businesses that were spread largely, and 16% of smaller businesses have already started using AI technologies in their workplaces. While 25% of the business market is expected to adopt AI within the next 12 months.

Surprisingly, voice-based assistants such as Siri, Google Assistant, and Cortana are some of the most prominent technologies these businesses are using in their workstations.

Where will the next AI voice revolution take us?

Voice-authorized transactions

Paypal, an online payment gateway now leverages Siri and Alexa’s voice recognition capability, thus, allowing users to make payments, check their balance, and ask payments from people via voice command.

Voice remote control – AI-powered

Communications conglomerate Comcast, an American telecommunications and media conglomerate introduces their first-ever X1 voice remote control that provides both natural image processing and voice recognition.

With the help of deep learning, the X1 can easily come up with better search results with just a press of the button telling what your television needs to do next.

Voice AI-enabled memos and analytics

Salesforce recently unveiled Einstein Voice which is an AI assistant that helps in entering critical data the moment it hears, making use of the voice command. This AI assistant also initiates in interpreting voice memos. Besides this, the voice bots accompanying Einstein Voice also helps the company create their customized voice bots to answer customer queries.

Voice-activated ordering

It is astonishing to see how Domino’s is using voice-activated feature automate orders made over the phone by customers. Well, welcome to the era of voice revolution.

This app, developed by Nuance Communications already has a Siri like voice recognition feature that allows customers to place their orders just like how they would be doing it in front of the cash counter making your order to take place efficiently.

As more businesses look forward to breaking down the roadblocks between a consumer and a brand, voice search now projects to become an impactful technology of bridging the gap.

Test!

Test!

Data Science – A Beautiful Data Driven Journey

Data Science is a profession related to processing algorithms and extracting deep insights from raw data. It depicts the importance of data and how it can be used in business and to make IT strategies. For recognizing the new ventures available in the market, identifying the patterns and to make better business decisions, data science is of utmost significance.  It is the duty of data scientists to convert raw data into relevant business information. They hold a center stage in developing the data products by carrying out experiments, analyzing them by using scientific methods and using their skill set. Spotting the growing trends and capitalizing on it before the competition to gain advantage.

TRAITS REQUIRED FOR DATA SCIENCE:

Data Scientists are not born intellectuals; they continuously work to gain all the skills expected by the companies as the demand surpasses the supply of applicants. Here are a few skills of data scientists:

  • Curiosity and Intuition to identify the hidden meaning of data and able to visualize.
  • Need to have leadership skills and have a business savvy mind to identify risks and opportunities.
  • A bachelor’s degree in math, IT, statistics along with a letter of recommendation which will help in knowing your acquired range of knowledge.
  • Specialized skills in machine learning, clustering and segmentation, exploration of data, Statistical research which helps in finances and increasing the profits of companies including modeling.
  • Familiarity and strong hold with programming languages such as hadoop, python, perl, R, etc.

BENEFITS OF DATA SCIENCE:

There are many advantages depending on the aim and interest of the company. Sales and Marketing departments, for example collect information from a particular industry and determine which products interest the customer the most and recommend for their production, be it online shopping goods, some online series or which shipment companies are best. They also help in detection of bank fraud. Data Science currently is a raging industry with well paid professionals. The amount of knowledge acquired through this course makes it a bonus for a better and lucrative career.

APPLICATIONS OF DATA SCIENCE:

Data Science has become a significant field in almost all sectors ranging from healthcare, internet searches, e-commerce sites, cell phones by increasing the features. By making use of statistical measures they predict the future events and try to avoid them by giving optimal solutions. Speech recognition has made it easy to search information or do stuff without typing the best eg being google voice, siri. learn data science training in hyderabad

ROLES OF DATA SCIENTIST IN THE INDUSTRY:

This course is a boon for aspirants who wish to build a career in: Data Science, Machine Learning, Data Visualization, Business Intelligence, Big data, etc. This course is a combination of knowledge and money providing both these aspects in abundant measure. There are many boot camps and courses that provide certifications and provide you with the skills. A data scientist must have enough business domain expertise to analyze the risks, profits and achieve the department goals.

RESOURCE BOX:

Data Science is an amazing course enriching your education bank..If you are thinking how to learn data science then some of the best online data science courses are available to give a start to your incredible journey filled with incredible knowledge learning experience.

Click here for more about the data science course in Bangalore.

How Data Science Can Benefit Nonprofits

Image Source: https://pixabay.com/vectors/pixel-cells-pixel-creative-commons-3704068/

Data science is the poster child of the 21st century and for good reason. Data-based decisions have streamlined, automated, and made businesses more efficient than ever before, and there are practically no industries that haven’t recognized its immense potential. But when you think of data science application, sectors like marketing, finance, technology, SMEs, and even education are the first that come to mind. There’s one more sector that’s proving to be an untapped market for data—the social sector. At first, one might question why non-profit organizations even need complex data applications, but that’s just it—they don’t. What they really need is data tools that are simple and reliable, because if anything, accountability is the most important component of the way non-profits run.

Challenges for Non-profits and Data Science

If you’re wondering why many non-profits haven’t already hopped onto the data bandwagon, its because in most cases they lack one big thing—quality data.

One reason is that effective data application requires clean data, and heaps of it, something non-profits struggle with. Most don’t sell products or services, and their success is reliant on broad, long-term (sometimes decades) results and changes, which means their outcomes are highly unmeasurable. Metrics and data seem out of place when appealing to donors, who are persuaded more by emotional campaigns. Data collection is also rare, perhaps only being recorded when someone signs up to the program or leaves, and hardly any tracking in between. The result is data that’s too little and unreliable to make effective change.

Perhaps the most important phase, data collection relies heavily on accurate and organized processes. For non-profits that don’t have the resources for accurate and manual record-keeping, clean, and quality data collection is a huge pain point. However, that is an issue now easily avoidable. For instance, avoiding duplicate files, adopting record-keeping methods like off-site and cloud storage, digital retention, and of course back-up plans—are all processes that could save non-profits time, effort, and risk. On the other hand, poor record management has its consequences, namely on things like fund allocation, payroll, budgeting, and taxes. It could lead to financial risk, legal trouble, and data loss — all added worries for already under-resourced non-profit organizations.

But now, as non-governmental organizations (NGOs) and non-profits catch up and invest more in data collection processes, there’s room for data science to make its impact. A growing global movement, ‘Data For Good’ represents individuals, companies, and organizations volunteering to create or use data to help further social causes ad support non-profit organizations. This ‘Data For Good’ movement includes tools for data work that are donated or subsidized, as well as educational programs that serve marginalized communities. As the movement gains momentum, non-profits are seeing data seep into their structures and turn processes around.

How Can Data Do Social Good?

With data science set to take the non-profit sector by storm, let’s look at some of the ways data can do social good:

  1. Improving communication with donors: Knowing when to reach out to your donors is key. In between a meeting? You’re unlikely to see much enthusiasm. Once they’re at home with their families? You may see wonderful results, as pointed out in this Forbes article. The article opines that data can help non-profits understand and communicate with their donors better.
  2. Donor targetting: Cold calls are a hit and miss, and with data on their side, non-profits can discover and define their ideal donor and adapt their messaging to reach out to them for better results.
  3. Improving cost efficiency: Costs are a major priority for non-profits and every penny counts. Data can help decrease costs and streamline financial planning
  4. Increasing new member sign-ups and renewals: Through data, non-profits can reach out to the right people they want on-board, strengthen recruitment processes and keep track of volunteers reaching out to them for future events or recruitment drives.
  5. Modeling and forecasting performance: With predictive modeling tools, non-profits can make data-based decisions on where they should allocate time and money for the future, rather than go on gut instinct.
  6. Measuring return on investment: For a long time, the outcomes of social campaigns have been perceived as intangible and immeasurable—it’s hard to measure empowerment or change. With data, non-profits can measure everything from the amount a fundraiser raised against a goal, the cost of every lead in a lead generation campaign, etc
  7. Streamlining operations: Finally, non-profits can use data tools to streamline their business processes internally and invest their efforts into resources that need it.

It’s true, measuring good and having social change down to a science is a long way off — but data application is a leap forward into a more efficient future for the social sector. With mission-aligned processes, data-driven non-profits can realize their potential, redirect their focus from trivial tasks, and onto the bigger picture to drive true change.