How Data Science Can Benefit Nonprofits

Image Source: https://pixabay.com/vectors/pixel-cells-pixel-creative-commons-3704068/

Data science is the poster child of the 21st century and for good reason. Data-based decisions have streamlined, automated, and made businesses more efficient than ever before, and there are practically no industries that haven’t recognized its immense potential. But when you think of data science application, sectors like marketing, finance, technology, SMEs, and even education are the first that come to mind. There’s one more sector that’s proving to be an untapped market for data—the social sector. At first, one might question why non-profit organizations even need complex data applications, but that’s just it—they don’t. What they really need is data tools that are simple and reliable, because if anything, accountability is the most important component of the way non-profits run.

Challenges for Non-profits and Data Science

If you’re wondering why many non-profits haven’t already hopped onto the data bandwagon, its because in most cases they lack one big thing—quality data.

One reason is that effective data application requires clean data, and heaps of it, something non-profits struggle with. Most don’t sell products or services, and their success is reliant on broad, long-term (sometimes decades) results and changes, which means their outcomes are highly unmeasurable. Metrics and data seem out of place when appealing to donors, who are persuaded more by emotional campaigns. Data collection is also rare, perhaps only being recorded when someone signs up to the program or leaves, and hardly any tracking in between. The result is data that’s too little and unreliable to make effective change.

Perhaps the most important phase, data collection relies heavily on accurate and organized processes. For non-profits that don’t have the resources for accurate and manual record-keeping, clean, and quality data collection is a huge pain point. However, that is an issue now easily avoidable. For instance, avoiding duplicate files, adopting record-keeping methods like off-site and cloud storage, digital retention, and of course back-up plans—are all processes that could save non-profits time, effort, and risk. On the other hand, poor record management has its consequences, namely on things like fund allocation, payroll, budgeting, and taxes. It could lead to financial risk, legal trouble, and data loss — all added worries for already under-resourced non-profit organizations.

But now, as non-governmental organizations (NGOs) and non-profits catch up and invest more in data collection processes, there’s room for data science to make its impact. A growing global movement, ‘Data For Good’ represents individuals, companies, and organizations volunteering to create or use data to help further social causes ad support non-profit organizations. This ‘Data For Good’ movement includes tools for data work that are donated or subsidized, as well as educational programs that serve marginalized communities. As the movement gains momentum, non-profits are seeing data seep into their structures and turn processes around.

How Can Data Do Social Good?

With data science set to take the non-profit sector by storm, let’s look at some of the ways data can do social good:

  1. Improving communication with donors: Knowing when to reach out to your donors is key. In between a meeting? You’re unlikely to see much enthusiasm. Once they’re at home with their families? You may see wonderful results, as pointed out in this Forbes article. The article opines that data can help non-profits understand and communicate with their donors better.
  2. Donor targetting: Cold calls are a hit and miss, and with data on their side, non-profits can discover and define their ideal donor and adapt their messaging to reach out to them for better results.
  3. Improving cost efficiency: Costs are a major priority for non-profits and every penny counts. Data can help decrease costs and streamline financial planning
  4. Increasing new member sign-ups and renewals: Through data, non-profits can reach out to the right people they want on-board, strengthen recruitment processes and keep track of volunteers reaching out to them for future events or recruitment drives.
  5. Modeling and forecasting performance: With predictive modeling tools, non-profits can make data-based decisions on where they should allocate time and money for the future, rather than go on gut instinct.
  6. Measuring return on investment: For a long time, the outcomes of social campaigns have been perceived as intangible and immeasurable—it’s hard to measure empowerment or change. With data, non-profits can measure everything from the amount a fundraiser raised against a goal, the cost of every lead in a lead generation campaign, etc
  7. Streamlining operations: Finally, non-profits can use data tools to streamline their business processes internally and invest their efforts into resources that need it.

It’s true, measuring good and having social change down to a science is a long way off — but data application is a leap forward into a more efficient future for the social sector. With mission-aligned processes, data-driven non-profits can realize their potential, redirect their focus from trivial tasks, and onto the bigger picture to drive true change.

Introduction to Recommendation Engines

This is the second article of article series Getting started with the top eCommerce use cases. If you are interested in reading the first article you can find it here.

What are Recommendation Engines?

Recommendation engines are the automated systems which helps select out similar things whenever a user selects something online. Be it Netflix, Amazon, Spotify, Facebook or YouTube etc. All of these companies are now using some sort of recommendation engine to improve their user experience. A recommendation engine not only helps to predict if a user prefers an item or not but also helps to increase sales, ,helps to understand customer behavior, increase number of registered users and helps a user to do better time management. For instance Netflix will suggest what movie you would want to watch or Amazon will suggest what kind of other products you might want to buy. All the mentioned platforms operates using the same basic algorithm in the background and in this article we are going to discuss the idea behind it.

What are the techniques?

There are two fundamental algorithms that comes into play when there’s a need to generate recommendations. In next section these techniques are discussed in detail.

Content-Based Filtering

The idea behind content based filtering is to analyse a set of features which will provide a similarity between items themselves i.e. between two movies, two products or two songs etc. These set of features once compared gives a similarity score at the end which can be used as a reference for the recommendations.

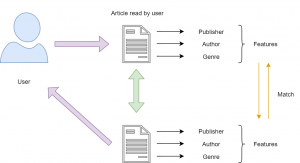
There are several steps involved to get to this similarity score and the first step is to construct a profile for each item by representing some of the important features of that item. In other terms, this steps requires to define a set of characteristics that are discovered easily. For instance, consider that there’s an article which a user has already read and once you know that this user likes this article you may want to show him recommendations of similar articles. Now, using content based filtering technique you could find the similar articles. The easiest way to do that is to set some features for this article like publisher, genre, author etc. Based on these features similar articles can be recommended to the user (as illustrated in Figure 1). There are three main similarity measures one could use to find the similar articles mentioned below.


Figure 1: Content-Based Filtering


Minkowski distance

Minkowski distance between two variables can be calculated as:

(x,y)= (\sum_{i=1}^{n}{|X_{i} - Y_{i}|^{p}})^{1/p}


Cosine Similarity

Cosine similarity between two variables can be calculated as :

  \mbox{Cosine Similarity} = \frac{\sum_{i=1}^{n}{x_{i} y_{i}}} {\sqrt{\sum_{i=1}^{n}{x_{i}^{2}}} \sqrt{\sum_{i=1}^{n}{y_{i}^{2}}}} \


Jaccard Similarity


  J(X,Y) = |X ∩ Y| / |X ∪ Y|


These measures can be used to create a matrix which will give you the similarity between each movie and then a function can be defined to return the top 10 similar articles.


Collaborative filtering

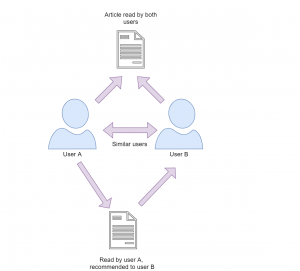
This filtering method focuses on finding how similar two users or two products are by analyzing user behavior or preferences rather than focusing on the content of the items. For instance consider that there are three users A,B and C.  We want to recommend some movies to user A, our first approach would be to find similar users and compare which movies user A has not yet watched and recommend those movies to user A.  This approach where we try to find similar users is called as User-User Collaborative Filtering.  

The other approach that could be used here is when you try to find similar movies based on the ratings given by others, this type is called as Item-Item Collaborative Filtering. The research shows that item-item collaborative filtering works better than user-user collaborative filtering as user behavior is really dynamic and changes over time. Also, there are a lot more users and increasing everyday but on the other side item characteristics remains the same. To calculate the similarities we can use Cosine distance.


Figure 2: Collaborative Filtering


Recently some companies have started to take advantage of both content based and collaborative filtering techniques to make a hybrid recommendation engine. The results from both models are combined into one hybrid model which provides more accurate recommendations. Five steps are involved to make a recommendation engine work which are collection of data, storing of data, analyzing the data, filtering the data and providing recommendations. There are a lot of attributes that are involved in order to collect user data including browsing history, page views, search logs, order history, marketing channel touch points etc. which requires a strong data architecture.  The collection of data is pretty straightforward but it can be overwhelming to analyze this amount of data. Storing this data could get tricky on the other hand as you need a scalable database for this kind of data. With the rise of graph databases this area is also improving for many use cases including recommendation engines. Graph databases like Neo4j can also help to analyze and find similar users and relationship among them. Analyzing the data can be carried in different ways, depending on how strong and scalable your architecture you can run real time, batch or near real time analysis. The fourth step involves the filtering of the data and here you can use any of the above mentioned approach to find similarities to finally provide the recommendations.

Having a good recommendation engine can be time consuming initially but it is definitely beneficial in the longer run. It not only helps to generate revenue but also helps to to improve your product catalog and customer service.

Multi-touch attribution: A data-driven approach

This is the first article of article series Getting started with the top eCommerce use cases.

What is Multi-touch attribution?

Customers shopping behavior has changed drastically when it comes to online shopping, as nowadays, customer likes to do a thorough market research about a product before making a purchase. This makes it really hard for marketers to correctly determine the contribution for each marketing channel to which a customer was exposed to. The path a customer takes from his first search to the purchase is known as a Customer Journey and this path consists of multiple marketing channels or touchpoints. Therefore, it is highly important to distribute the budget between these channels to maximize return. This problem is known as multi-touch attribution problem and the right attribution model helps to steer the marketing budget efficiently. Multi-touch attribution problem is well known among marketers. You might be thinking that if this is a well known problem then there must be an algorithm out there to deal with this. Well, there are some traditional models  but every model has its own limitation which will be discussed in the next section.

Traditional attribution models

Most of the eCommerce companies have a performance marketing department to make sure that the marketing budget is spent in an agile way. There are multiple heuristics attribution models pre-existing in google analytics however there are several issues with each one of them. These models are:

First touch attribution model

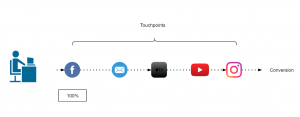
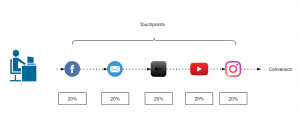
100% credit is given to the first channel as it is considered that the first marketing channel was responsible for the purchase.

Figure 1: First touch attribution model

Last touch attribution model

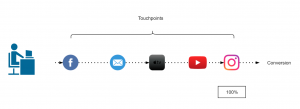
100% credit is given to the last channel as it is considered that the first marketing channel was responsible for the purchase.

Figure 2: Last touch attribution model

Linear-touch attribution model

In this attribution model, equal credit is given to all the marketing channels present in customer journey as it is considered that each channel is equally responsible for the purchase.

Figure 3: Linear attribution model

U-shaped or Bath tub attribution model

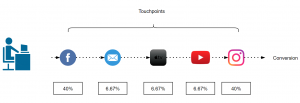
This is most common in eCommerce companies, this model assigns 40% to first and last touch and 20% is equally distributed among the rest.

Figure 4: Bathtub or U-shape attribution model

Data driven attribution models

Traditional attribution models follows somewhat a naive approach to assign credit to one or all the marketing channels involved. As it is not so easy for all the companies to take one of these models and implement it. There are a lot of challenges that comes with multi-touch attribution problem like customer journey duration, overestimation of branded channels, vouchers and cross-platform issue, etc.

Switching from traditional models to data-driven models gives us more flexibility and more insights as the major part here is defining some rules to prepare the data that fits your business. These rules can be defined by performing an ad hoc analysis of customer journeys. In the next section, I will discuss about Markov chain concept as an attribution model.

Markov chains

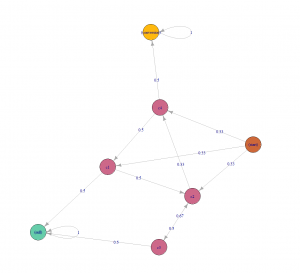
Markov chains concepts revolves around probability. For attribution problem, every customer journey can be seen as a chain(set of marketing channels) which will compute a markov graph as illustrated in figure 5. Every channel here is represented as a vertex and the edges represent the probability of hopping from one channel to another. There will be an another detailed article, explaining the concept behind different data-driven attribution models and how to apply them.

Figure 5: Markov chain example

Challenges during the Implementation

Transitioning from a traditional attribution models to a data-driven one, may sound exciting but the implementation is rather challenging as there are several issues which can not be resolved just by changing the type of model. Before its implementation, the marketers should perform a customer journey analysis to gain some insights about their customers and try to find out/perform:

  1. Length of customer journey.
  2. On an average how many branded and non branded channels (distinct and non-distinct) in a typical customer journey?
  3. Identify most upper funnel and lower funnel channels.
  4. Voucher analysis: within branded and non-branded channels.

When you are done with the analysis and able to answer all of the above questions, the next step would be to define some rules in order to handle the user data according to your business needs. Some of the issues during the implementation are discussed below along with their solution.

Customer journey duration

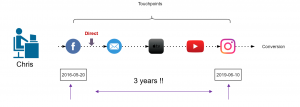
Assuming that you are a retailer, let’s try to understand this issue with an example. In May 2016, your company started a Fb advertising campaign for a particular product category which “attracted” a lot of customers including Chris. He saw your Fb ad while working in the office and clicked on it, which took him to your website. As soon as he registered on your website, his boss called him (probably because he was on Fb while working), he closed everything and went for the meeting. After coming back, he started working and completely forgot about your ad or products. After a few days, he received an email with some offers of your products which also he ignored until he saw an ad again on TV in Jan 2019 (after 3 years). At this moment, he started doing his research about your products and finally bought one of your products from some Instagram campaign. It took Chris almost 3 years to make his first purchase.

Figure 6: Chris journey

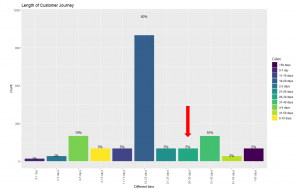
Now, take a minute and think, if you analyse the entire journey of customers like Chris, you would realize that you are still assigning some of the credit to the touchpoints that happened 3 years ago. This can be solved by using an attribution window. Figure 6 illustrates that 83% of the customers are making a purchase within 30 days which means the attribution window here could be 30 days. In simple words, it is safe to remove the touchpoints that happens after 30 days of purchase. This parameter can also be changed to 45 days or 60 days, depending on the use case.

Figure 7: Length of customer journey

Removal of direct marketing channel

A well known issue that every marketing analyst is aware of is, customers who are already aware of the brand usually comes to the website directly. This leads to overestimation of direct channel and branded channels start getting more credit. In this case, you can set a threshold (say 7 days) and remove these branded channels from customer journey.

Figure 8: Removal of branded channels

Cross platform problem

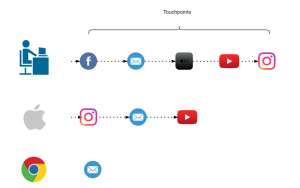
If some of your customers are using different devices to explore your products and you are not able to track them then it will make retargeting really difficult. In a perfect world these customers belong to same journey and if these can’t be combined then, except one, other paths would be considered as “non-converting path”. For attribution problem device could be thought of as a touchpoint to include in the path but to be able to track these customers across all devices would still be challenging. A brief introduction to deterministic and probabilistic ways of cross device tracking can be found here.

Figure 9: Cross platform clash

How to account for Vouchers?

To better account for vouchers, it can be added as a ‘dummy’ touchpoint of the type of voucher (CRM,Social media, Affiliate or Pricing etc.) used. In our case, we tried to add these vouchers as first touchpoint and also as a last touchpoint but no significant difference was found. Also, if the marketing channel of which the voucher was used was already in the path, the dummy touchpoint was not added.

Figure 10: Addition of Voucher as a touchpoint

Let me know in comments if you would like to add something or if you have a different perspective about this use case.

Getting started with the top eCommerce use cases

Nowadays, almost all the projects in eCommerce companies are data-dependent and everyone wants to leverage data science techniques to mine as much information as they can from that data. From tracking their customer’s shopping behavior to recommending them what to buy, from finding new leads for their market to calculating their lifetime value, from improving customer experience to increase their profitability. When we navigate through any website, we leave our traces and companies track these touchpoints to get insights about how we behave online. Companies sometimes have different landing pages based on the gender of the user.

This post will be focused on some of the use cases in marketing which are gaining attention over the past few years. I have been associated with different eCommerce companies as a data science consultant.

Upcoming months has a lot to offer as I will be writing blogs about the following use cases:

  1. Multi-touch attribution: A data-driven approach
  2. Introduction to Recommendation engines
  3. How Important is Customer Lifetime Value?
  4. Customer Segmentation
  5. Dynamic Pricing


If you are interested in reading the success story for the Multi-touch attribution project you can find it here.

Erstellen und benutzen einer Geodatenbank

In diesem Artikel soll es im Gegensatz zum vorherigen Artikel Alles über Geodaten weniger darum gehen, was man denn alles mit Geodaten machen kann, dafür aber mehr darum wie man dies anstellt. Es wird gezeigt, wie man aus dem öffentlich verfügbaren Datensatz des OpenStreetMap-Projekts eine Geodatenbank erstellt und einige Beispiele dafür gegeben, wie man diese abfragen und benutzen kann.

Wahl der Datenbank

Prinzipiell gibt es zwei große “geo-kompatible” OpenSource-Datenbanken bzw. “Datenbank-AddOn’s”: Spatialite, welches auf SQLite aufbaut, und PostGIS, das PostgreSQL verwendet.

PostGIS bietet zum Teil eine einfachere Syntax, welche manchmal weniger Tipparbeit verursacht. So kann man zum Beispiel um die Entfernung zwischen zwei Orten zu ermitteln einfach schreiben:

während dies in Spatialite “nur” mit einer normalen Funktion möglich ist:

Trotztdem wird in diesem Artikel Spatialite (also SQLite) verwendet, da dessen Einrichtung deutlich einfacher ist (schließlich sollen interessierte sich alle Ergebnisse des Artikels problemlos nachbauen können, ohne hierfür einen eigenen Datenbankserver aufsetzen zu müssen).

Der Hauptunterschied zwischen PostgreSQL und SQLite (eigentlich der Unterschied zwischen SQLite und den meissten anderen Datenbanken) ist, dass für PostgreSQL im Hintergrund ein Server laufen muss, an welchen die entsprechenden Queries gesendet werden, während SQLite ein “normales” Programm (also kein Client-Server-System) ist welches die Queries selber auswertet.

Hierdurch fällt beim Aufsetzen der Datenbank eine ganze Menge an Konfigurationsarbeit weg: Welche Benutzer gibt es bzw. akzeptiert der Server? Welcher Benutzer bekommt welche Rechte? Über welche Verbindung wird auf den Server zugegriffen? Wie wird die Sicherheit dieser Verbindung sichergestellt? …

Während all dies bei SQLite (und damit auch Spatialite) wegfällt und die Einrichtung der Datenbank eigentlich nur “installieren und fertig” ist, muss auf der anderen Seite aber auch gesagt werden dass SQLite nicht gut für Szenarien geeignet ist, in welchen viele Benutzer gleichzeitig (insbesondere schreibenden) Zugriff auf die Datenbank benötigen.

Benötigte Software und ein Beispieldatensatz

Was wird für diesen Artikel an Software benötigt?

SQLite3 als Datenbank

libspatialite als “Geoplugin” für SQLite

spatialite-tools zum erstellen der Datenbank aus dem OpenStreetMaps (*.osm.pbf) Format

python3, die beiden GeoModule spatialite, folium und cartopy, sowie die Module pandas und matplotlib (letztere gehören im Bereich der Datenauswertung mit Python sowieso zum Standart). Für pandas gibt es noch die Erweiterung geopandas sowie eine praktisch unüberschaubare Anzahl weiterer geographischer Module aber bereits mit den genannten lassen sich eine Menge interessanter Dinge herausfinden.

– und natürlich einen Geodatensatz: Zum Beispiel sind aus dem OpenStreetMap-Projekt extrahierte Datensätze hier zu finden.

Es ist ratsam, sich hier erst einmal einen kleinen Datensatz herunterzuladen (wie zum Beispiel einen der Stadtstaaten Bremen, Hamburg oder Berlin). Zum einen dauert die Konvertierung des .osm.pbf-Formats in eine Spatialite-Datenbank bei größeren Datensätzen unter Umständen sehr lange, zum anderen ist die fertige Datenbank um ein vielfaches größer als die stark gepackte Originaldatei (für “nur” Deutschland ist die fertige Datenbank bereits ca. 30 GB groß und man lässt die Konvertierung (zumindest am eigenen Laptop) am besten über Nacht laufen – willkommen im Bereich “BigData”).

Erstellen eine Geodatenbank aus OpenStreetMap-Daten

Nach dem Herunterladen eines Datensatzes der Wahl im *.osm.pbf-Format kann hieraus recht einfach mit folgendem Befehl aus dem Paket spatialite-tools die Datenbank erstellt werden:

Erkunden der erstellten Geodatenbank

Nach Ausführen des obigen Befehls sollte nun eine Datei mit dem gewählten Namen (im Beispiel bremen-latest.sqlite) im aktuellen Ordner vorhanden sein – dies ist bereits die fertige Datenbank. Zunächst sollte man mit dieser Datenbank erst einmal dasselbe machen, wie mit jeder anderen Datenbank auch: Sich erst einmal eine Weile hinsetzen und schauen was alles an Daten in der Datenbank vorhanden und vor allem wo diese Daten in der erstellten Tabellenstruktur zu finden sind. Auch wenn dieses Umschauen prinzipiell auch vollständig über die Shell oder in Python möglich ist, sind hier Programme mit graphischer Benutzeroberfläche (z. B. spatialite-gui oder QGIS) sehr hilfreich und sparen nicht nur eine Menge Zeit sondern vor allem auch Tipparbeit. Wer dies tut, wird feststellen, dass sich in der generierten Datenbank einige dutzend Tabellen mit Namen wie pt_addresses, ln_highway und pg_boundary befinden.

Die Benennung der Tabellen folgt dem Prinzip, dass pt_*-Tabellen Punkte im Geokoordinatensystem wie z. B. Adressen, Shops, Bäckereien und ähnliches enthalten. ln_*-Tabellen enthalten hingegen geographische Entitäten, welche sich als Linien darstellen lassen, wie beispielsweise Straßen, Hochspannungsleitungen, Schienen, ect. Zuletzt gibt es die pg_*-Tabellen welche Polygone – also Flächen einer bestimmten Form enthalten. Dazu zählen Landesgrenzen, Bundesländer, Inseln, Postleitzahlengebiete, Landnutzung, aber auch Gebäude, da auch diese jeweils eine Grundfläche besitzen. In dem genannten Datensatz sind die Grundflächen von Gebäuden – zumindest in Europa – nahezu vollständig. Aber auch der Rest der Welt ist für ein “Wikipedia der Kartographie” insbesondere in halbwegs besiedelten Gebieten bemerkenswert gut erfasst, auch wenn nicht unbedingt davon ausgegangen werden kann, dass abgelegenere Gegenden (z. B. irgendwo auf dem Land in Südamerika) jedes Gebäude eingezeichnet ist.

Verwenden der Erstellten Datenbank

Auf diese Datenbank kann nun entweder direkt aus der Shell über den Befehl

zugegriffen werden oder man nutzt das gleichnamige Python-Paket:

Nach Eingabe der obigen Befehle in eine Python-Konsole, ein Jupyter-Notebook oder ein anderes Programm, welches die Anbindung an den Python-Interpreter ermöglicht, können die von der Datenbank ausgegebenen Ergebnisse nun direkt in ein Pandas Data Frame hineingeladen und verwendet/ausgewertet/analysiert werden.

Im Grunde wird hierfür “normales SQL” verwendet, wie in anderen Datenbanken auch. Der folgende Beispiel gibt einfach die fünf ersten von der Datenbank gefundenen Adressen aus der Tabelle pt_addresses aus:

Link zur Ausgabe

Es wird dem Leser sicherlich aufgefallen sein, dass die Spalte “Geometry” (zumindest für das menschliche Auge) nicht besonders ansprechend sowie auch nicht informativ aussieht: Der Grund hierfür ist, dass diese Spalte die entsprechende Position im geographischen Koordinatensystem aus Gründen wie dem deutlich kleineren Speicherplatzbedarf sowie der damit einhergehenden Optimierung der Geschwindigkeit der Datenbank selber, in binärer Form gespeichert und ohne weitere Verarbeitung auch als solche ausgegeben wird.

Glücklicherweise stellt spatialite eine ganze Reihe von Funktionen zur Verarbeitung dieser geographischen Informationen bereit, von denen im folgenden einige beispielsweise vorgestellt werden:

Für einzelne Punkte im Koordinatensystem gibt es beispielsweise die Funktionen X(geometry) und Y(geometry), welche aus diesem “binären Wirrwarr” den Längen- bzw. Breitengrad des jeweiligen Punktes als lesbare Zahlen ausgibt.

Ändert man also das obige Query nun entsprechend ab, erhält man als Ausgabe folgendes Ergebnis in welchem die Geometry-Spalte der ausgegebenen Adressen in den zwei neuen Spalten Longitude und Latitude in lesbarer Form zu finden ist:

Link zur Tabelle

Eine weitere häufig verwendete Funktion von Spatialite ist die Distance-Funktion, welche die Distanz zwischen zwei Orten berechnet.

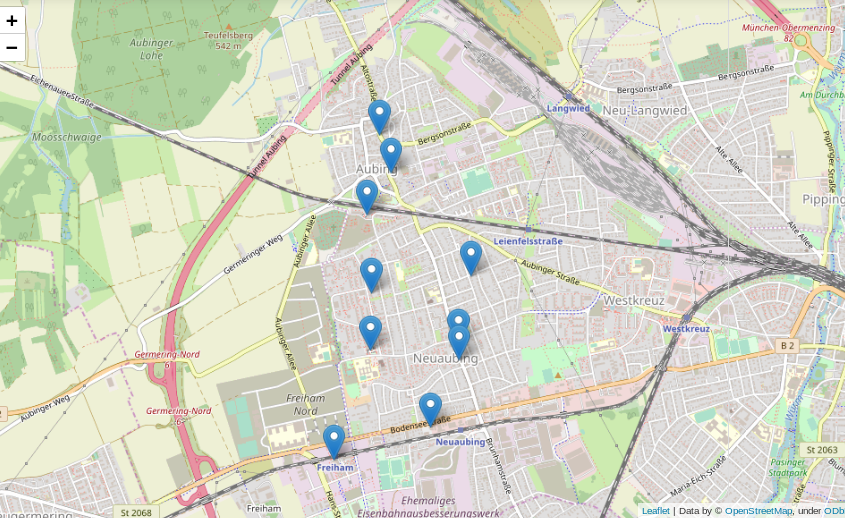
Das folgende Beispiel sucht in der Datenbank die 10 nächstgelegenen Bäckereien zu einer frei wählbaren Position aus der Datenbank und listet diese nach zunehmender Entfernung auf (Achtung – die frei wählbare Position im Beispiel liegt in München, wer die selbe Position z. B. mit dem Bremen-Datensatz verwendet, wird vermutlich etwas weiter laufen müssen…):

Link zur Ausgabe

Ein Anwendungsfall für eine solche Liste können zum Beispiel Programme/Apps wie maps.me oder Google-Maps sein, in denen User nach Bäckereien, Geldautomaten, Supermärkten oder Apotheken “in der Nähe” suchen können sollen.

Diese Liste enthält nun alle Informationen die grundsätzlich gebraucht werden, ist soweit auch informativ und wird in den meißten Fällen der Datenauswertung auch genau so gebraucht, jedoch ist diese für das Auge nicht besonders ansprechend.

Viel besser wäre es doch, die gefundenen Positionen auf einer interaktiven Karte einzuzeichnen:

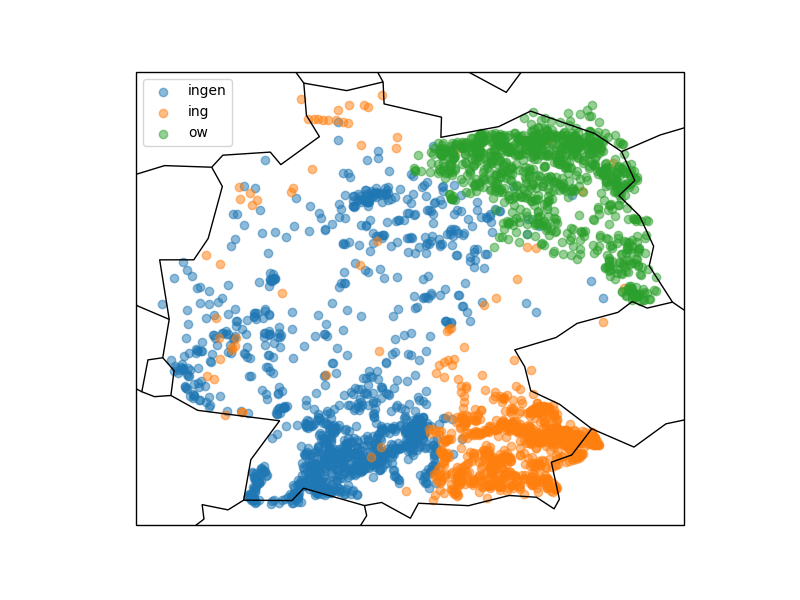
Was kann man sonst interessantes mit der erstellten Datenbank und etwas Python machen? Wer in Deutschland ein wenig herumgekommen ist, dem ist eventuell aufgefallen, dass sich die Endungen von Ortsnamen stark unterscheiden: Um München gibt es Stadteile und Dörfer namens Garching, Freising, Aubing, ect., rund um Stuttgart enden alle möglichen Namen auf “ingen” (Plieningen, Vaihningen, Echterdingen …) und in Berlin gibt es Orte wie Pankow, Virchow sowie eine bunte Auswahl weiterer *ow’s.

Das folgende Query spuckt gibt alle “village’s”, “town’s” und “city’s” aus der Tabelle pt_place, also Dörfer und Städte, aus:

Link zur Ausgabe

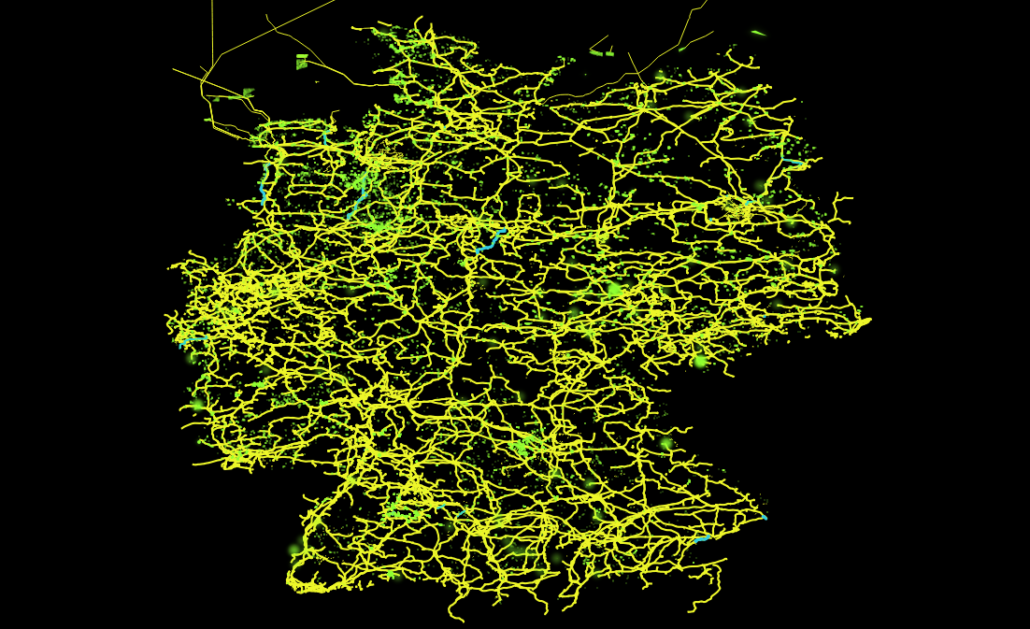
Graphisch mit matplotlib und cartopy in ein Koordinatensystem eingetragen sieht diese Verteilung folgendermassen aus:

Die Grafik zeigt, dass stark unterschiedliche Vorkommen der verschiedenen Ortsendungen in Deutschland (Clustering). Über das genaue Zustandekommen dieser Verteilung kann ich hier nur spekulieren, jedoch wird diese vermutlich ähnlichen Prozessen unterliegen wie beispielsweise die Entwicklung von Dialekten.

Wer sich die Karte etwas genauer anschaut wird merken, dass die eingezeichneten Landesgrenzen und Küstenlinien nicht besonders genau sind. Hieran wird ein interessanter Effekt von häufig verwendeten geographischen Entitäten, nämlich Linien und Polygonen deutlich. Im Beispiel werden durch die beiden Zeilen

die bereits im Modul cartopy hinterlegten Daten verwendet. Genaue Verläufe von Küstenlinien und Landesgrenzen benötigen mit wachsender Genauigkeit hingegen sehr viel Speicherplatz, da mehr und mehr zu speichernde Punkte benötigt werden (genaueres siehe hier).

Schlussfolgerung

Man kann also bereits mit einigen Grundmodulen und öffentlich verfügbaren Datensätzen eine ganze Menge im Bereich der Geodaten erkunden und entdecken. Gleichzeitig steht, insbesondere für spezielle Probleme, eine große Bandbreite weiterer Software zur Verfügung, für welche dieser Artikel zwar einen Grundsätzlichen Einstieg geben kann, die jedoch den Rahmen dieses Artikels sprengen würden.

Allgemeines über Geodaten

Dieser Artikel ist der Auftakt in einer Artikelserie zum Thema “Geodatenanalyse”.

Von den vielen Arten an Datensätzen, die öffentlich im Internet verfügbar sind, bin ich in letzter Zeit vermehrt über eine besonders interessante Gruppe gestolpert, die sich gleich für mehrere Zwecke nutzen lassen: Geodaten.

Gerade in wirtschaftlicher Hinsicht bieten sich eine ganze Reihe von Anwendungsfällen, bei denen Geodaten helfen können, Einblicke in Tatsachen zu erlangen, die ohne nicht möglich wären. Der wohl bekannteste Fall hierfür ist vermutlich die einfache Navigation zwischen zwei Punkten, die jeder kennt, der bereits ein Navigationssystem genutzt oder sich eine Route von Google Maps berechnen lassen hat.
Hiermit können nicht nur Fragen nach dem schnellsten oder Energie einsparensten (und damit gleichermaßen auch witschaftlichsten) Weg z. B. von Berlin nach Hamburg beantwortet werden, sondern auch die bestmögliche Lösung für Ausnahmesituationen wie Stau oder Vollsperrungen berechnet werden (ja, Stau ist, zumindest in der Theorie immer noch eine “Ausnahmesituation” ;-)).
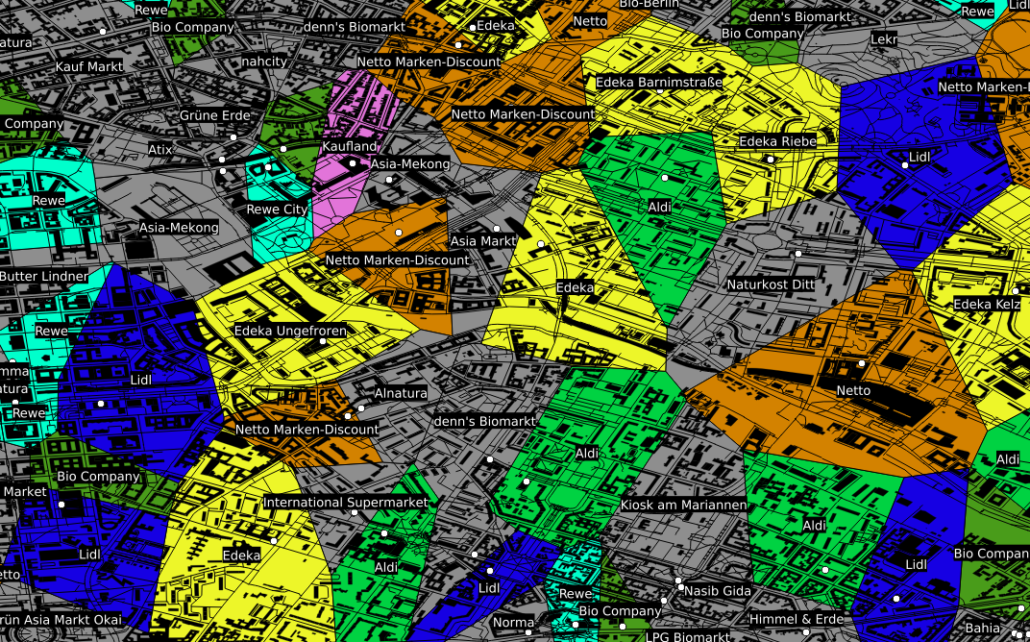
Neben dieser beliebten Art Geodaten zu nutzen, gibt es eine ganze Reihe weiterer Situationen in denen deren Nutzung hilfreich bis essentiell sein kann. Als Beispiel sei hier der Einzugsbereich von in Konkurrenz stehenden Einheiten, wie z. B. Supermärkten genannt. Ohne an dieser Stelle statistische Nachweise vorlegen zu können, kaufen (zumindest meiner persönlichen Beobachtung nach) die meisten Menschen fast immer bei dem Supermarkt ein, der am bequemsten zu erreichen ist und dies ist in der Regel der am nächsten gelegene. Besitzt man nun eine Datenbank mit der Information, wo welcher Supermarkt bzw. welche Supermarktkette liegt, kann man mit so genannten Voronidiagrammen recht einfach den jeweiligen Einzugsbereich der jeweiligen Supermärkte berechnen.
Entsprechende Karten können auch von beliebigen anderen Entitäten mit fester geographischer Position gezeichnet werden: Geldautomaten, Funkmasten, öffentlicher Nahverkehr, …

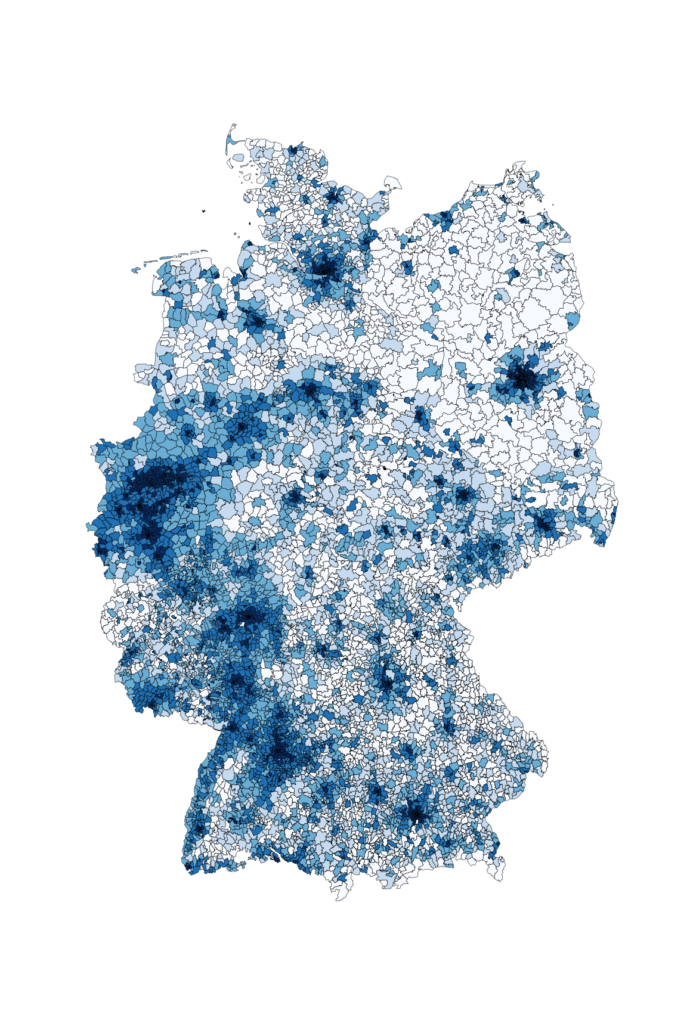
Ein anderes Beispiel, das für die Datenauswertung interessant ist, ist die kartographische Auswertung von Postleitzahlen. Diese sind in fast jedem Datensatz zu Kunden, Lieferanten, ect. vorhanden, bilden jedoch weder eine ordinale, noch eine sinnvolle kategorische Größe, da es viele tausend verschiedene gibt. Zudem ist auch eine einfache Gruppierung in gröbere Kategorien wie beispielsweise Postleitzahlen des Schemas 1xxxx oft kaum sinnvoll, da diese in aller Regel kein sinnvolles Mapping auf z. B. politische Gebiete – wie beispielsweise Bundesländer – zulassen. Ein Ausweg aus diesem Dilemma ist eine einfache kartographische Übersicht, welche die einzelnen Postleitzahlengebiete in einer Farbskala zeigt.

Im gezeigten Beispiel ist die Bevölkerungsdichte Deutschlands als Karte zu sehen. Hiermit wird schnell und übersichtlich deutlich, wo in Deutschland die Bevölkerung lokalisiert ist. Ähnliche Karten können beispielsweise erstellt werden, um Fragen wie “Wie ist meine Kundschaft verteilt?” oder “Wo hat die Werbekampange XYZ besonders gut funktioniert?” zu beantworten. Bezieht man weitere Daten wie die absolute Bevölkerung oder die Bevölkerungsdichte mit ein, können auch Antworten auf Fragen wie “Welchen Anteil der Bevölkerung habe ich bereits erreicht und wo ist noch nicht genutztes Potential?” oder “Ist mein Produkt eher in städtischen oder ländlichen Gebieten gefragt?” einfach und schnell gefunden werden.
Ohne die entsprechende geographische Zusatzinformation bleiben insbesondere Postleitzahlen leider oft als “nicht sinnvoll auswertbar” bei der Datenauswertung links liegen.
Eine ganz andere Art von Vorteil der Geodaten ist der educational point of view:
  • Wer erst anfängt, sich mit Datenbanken zu beschäftigen, findet mit Straßen, Postleitzahlen und Ländern einen deutlich einfacheren und vor allem besser verständlichen Zugang zu SQL als mit abstrakten Größen und Nummern wie ProductID, CustomerID und AdressID. Zudem lassen sich Geodaten nebenbei bemerkt mittels so genannter GeoInformationSystems (*gis-Programme), erstaunlich einfach und ansprechend plotten.
  • Wer sich mit SQL bereits ein wenig auskennt, kann mit den (beispielsweise von Spatialite oder PostGIS) bereitgestellten SQL-Funktionen eine ganze Menge über Datenbanken sowie deren Möglichkeiten – aber auch über deren Grenzen – erfahren.
  • Für wen relationale Datenbanken sowie deren Funktionen schon lange nichts Neues mehr darstellen, kann sich hier (selbst mit dem eigenen Notebook) erstaunlich einfach in das Thema “Bug Data” einarbeiten, da die Menge an öffentlich vorhandenen Geodaten z.B. des OpenStreetMaps-Projektes selbst in optimal gepackten Format vielen Dutzend GB entsprechen. Gerade die Möglichkeit, die viele *gis-Programme wie beispielsweise QGIS bieten, nämlich Straßen-, Schienen- und Stromnetze “on-the-fly” zu plotten, macht die Bedeutung von richtig oder falsch gesetzten Indices in verschiedenen Datenbanken allein anhand der Geschwindigkeit mit der sich die Plots aufbauen sehr eindrucksvoll deutlich.
Um an Datensätze zu kommen, reicht es in der Regel Google mit den entsprechenden Schlagworten zu versorgen.
Neben – um einen Vergleich zu nutzen – dem Brockhaus der Karten GoogleMaps gibt es beispielsweise mit dem OpenStreetMaps-Projekt einen freien Geodatensatz, welcher in diesem Kontext etwa als das Wikipedia der Karten zu verstehen ist.
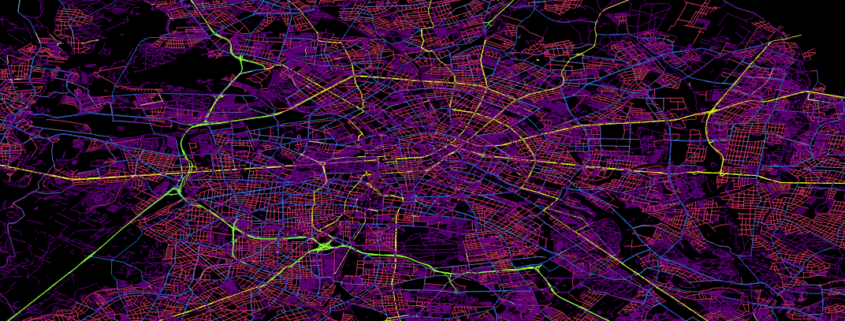
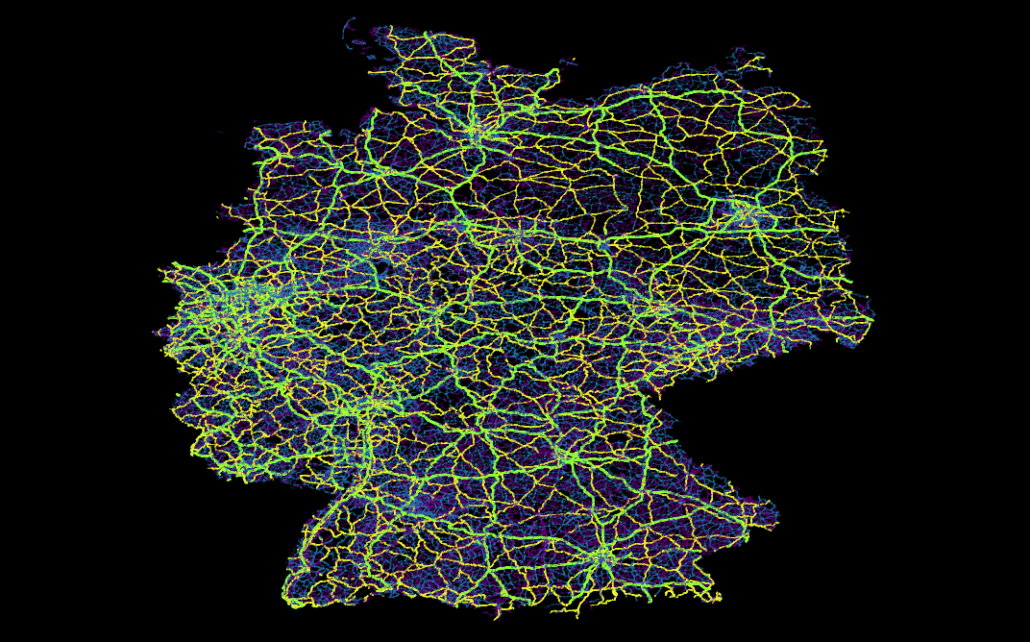
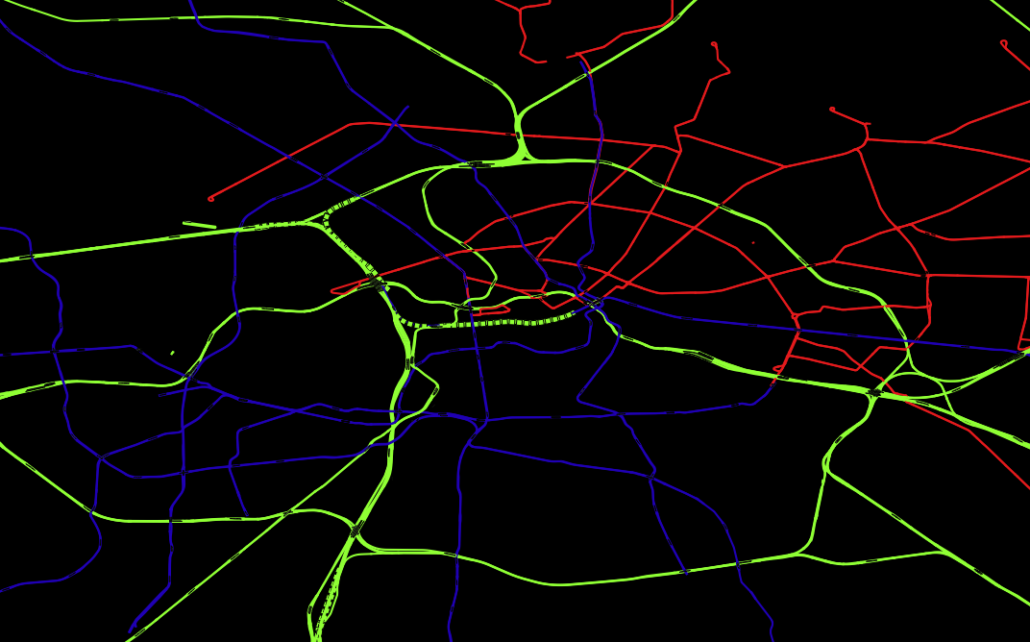
Hier findet man zum Beispiel Daten wie Straßen-, Schienen- oder dem Stromnetz, aber auch die im obigen Voronidiagramm eingezeichneten Gebäude und Supermärkte stammen aus diesem Datensatz. Hiermit lassen sich recht einfach just for fun interessante Dinge herausfinden, wie z. B., dass es in Deutschland ca. 28 Mio Gebäude gibt (ein SQL-Einzeiler), dass der Berliner Osten auch ca. 30 Jahre nach der Wende noch immer vorwiegend von der Tram versorgt wird, während im Westen hauptsächlich die U-Bahn fährt. Oder über welche Trassen der in der Nordsee von Windkraftanlagen erzeugte Strom auf das Festland kommt und von da aus weiter verteilt wird.
Eher grundlegende aber deswegen nicht weniger nützliche Datensätze lassen sich unter dem Stichwort “natural earth” finden. Hier sind Daten wie globale Küstenlinien, mittels Echolot ausgemessene Meerestiefen, aber auch von Menschen geschaffene Dinge wie Landesgrenzen und Städte sehr übersichtlich zu finden.
Im Grunde sind der Vorstellung aber keinerlei Grenzen gesetzt und fast alle denkbaren geographischen Fakten können, manchmal sogar live via Sattelit, mitverfolgt werden. So kann man sich beispielsweise neben aktueller Wolkenbedekung, Regenradar und globaler Oberflächentemperatur des Planeten auch das Abschmelzen der Polkappen seit 1970 ansehen (NSIDC) oder sich live die Blitzeinschläge auf dem gesamten Planeten anschauen – mit Vorhersage darüber, wann und wo der Donner zu hören ist (das funktioniert wirklich! Beispielsweise auf lightningmaps).
Kurzum Geodaten sind neben ihrer wirtschaftlichen Relevanz – vor allem für die Logistik – auch für angehende Data Scientists sehr aufschlussreich und ein wunderbares Spielzeug, mit dem man sich lange beschäftigen und eine Menge interessanter Dinge herausfinden kann.

Attribution Models in Marketing

Attribution Models

A Business and Statistical Case

INTRODUCTION

A desire to understand the causal effect of campaigns on KPIs

Advertising and marketing costs represent a huge and ever more growing part of the budget of companies. Studies have found out this share is as high as 10% and increases with the size of companies (CMO study by American Marketing Association and Duke University, 2017). Measuring precisely the impact of a specific marketing campaign on the sales of a company is a critical step towards an efficient allocation of this budget. Would the return be higher for an euro spent on a Facebook ad, or should we better spend it on a TV spot? How much should I spend on Twitter ads given the volume of sales this channel is responsible for?

Attribution Models have lately received great attention in Marketing departments to answer these issues. The transition from offline to online marketing methods has indeed permitted the collection of multiple individual data throughout the whole customer journey, and  allowed for the development of user-centric attribution models. In short, Attribution Models use the information provided by Tracking technologies such as Google Analytics or Webtrekk to understand customer journeys from the first click on a Facebook ad to the final purchase and adequately ponderate the different marketing campaigns encountered depending on their responsibility in the final conversion.

Issues on Causal Effects

A key question then becomes: how to declare a channel is responsible for a purchase? In other words, how can we isolate the causal effect or incremental value of a campaign ?

          1. A/B-Tests

One method to estimate the pure impact of a campaign is the design of randomized experiments, wherein a control and treated groups are compared.  A/B tests belong to this broad category of randomized methods. Provided the groups are a priori similar in every aspect except for the treatment received, all subsequent differences may be attributed solely to the treatment. This method is typically used in medical studies to assess the effect of a drug to cure a disease.

Main practical issues regarding Randomized Methods are:

  • Assuring that control and treated groups are really similar before treatment. Uually a random assignment (i.e assuring that on a relevant set of observable variables groups are similar) is realized;
  • Potential spillover-effects, i.e the possibility that the treatment has an impact on the non-treated group as well (Stable unit treatment Value Assumption, or SUTVA in Rubin’s framework);
  • The costs of conducting such an experiment, and especially the costs linked to the deliberate assignment of individuals to a group with potentially lower results;
  • The number of such experiments to design if multiple treatments have to be measured;
  • Difficulties taking into account the interaction effects between campaigns or the effect of spending levels. Indeed, usually A/B tests are led by cutting off temporarily one campaign entirely and measuring the subsequent impact on KPI’s compared to the situation where this campaign is maintained;
  • The dynamical reproduction of experiments if we assume that treatment effects may change over time.

In the marketing context, multiple campaigns must be tested in a dynamical way, and treatment effect is likely to be heterogeneous among customers, leading to practical issues in the lauching of A/B tests to approximate the incremental value of all campaigns. However, sites with a lot of traffic and conversions can highly benefit from A/B testing as it provides a scientific and straightforward way to approximate a causal impact. Leading companies such as Uber, Netflix or Airbnb rely on internal tools for A/B testing automation, which allow them to basically test any decision they are about to make.

References:

Books:

Experiment!: Website conversion rate optimization with A/B and multivariate testing, Colin McFarland, ©2013 | New Riders  

A/B testing: the most powerful way to turn clicks into customers. Dan Siroker, Pete Koomen; Wiley, 2013.

Blogs:

https://eng.uber.com/xp

https://medium.com/airbnb-engineering/growing-our-host-community-with-online-marketing-9b2302299324

Study:

https://cmosurvey.org/wp-content/uploads/sites/15/2018/08/The_CMO_Survey-Results_by_Firm_and_Industry_Characteristics-Aug-2018.pdf

        2. Attribution models

Attribution Models do not demand to create an experimental setting. They take into account existing data and derive insights from the variability of customer journeys. One key difficulty is then to differentiate correlation and causality in the links observed between the exposition to campaigns and purchases. Indeed, selection effects may bias results as exposure to campaigns is usually dependant on user-characteristics and thus may not be necessarily independant from the customer’s baseline conversion probabilities. For example, customers purchasing from a discount price comparison website may be intrinsically different from customers buying from FB ad and this a priori difference may alone explain post-exposure differences in purchasing bahaviours. This intrinsic weakness must be remembered when interpreting Attribution Models results.

                          2.1 General Issues

The main issues regarding the implementation of Attribution Models are linked to

  • Causality and fallacious reasonning, as most models do not take into account the aforementionned selection biases.
  • Their difficult evaluation. Indeed, in almost all attribution models (except for those based on classification, where the accuracy of the model can be computed), the additionnal value brought by the use of a given attribution models cannot be evaluated using existing historical data. This additionnal value can only be approximated by analysing how the implementation of the conclusions of the attribution model have impacted a given KPI.
  • Tracking issues, leading to an uncorrect reconstruction of customer journeys
    • Cross-device journeys: cross-device issue arises from the use of different devices throughout the customer journeys, making it difficult to link datapoints. For example, if a customer searches for a product on his computer but later orders it on his mobile, the AM would then mistakenly consider it an order without prior campaign exposure. Though difficult to measure perfectly, the proportion of cross-device orders can approximate 20-30%.
    • Cookies destruction makes it difficult to track the customer his the whole journey. Both regulations and consumers’ rising concerns about data privacy issues mitigate the reliability and use of cookies.1 – From 2002 on, the EU has enacted directives concerning privacy regulation and the extended use of cookies for commercial targeting purposes, which have highly impacted marketing strategies, such as the ‘Privacy and Electronic Communications Directive’ (2002/58/EC). A research was conducted and found out that the adoption of this ‘Privacy Directive’ had led to 64% decrease in advertising methods compared to the rest of the world (Goldfarb et Tucker (2011)). The effect was stronger for generalized sites (Yahoo) than for specialized sites.2 – Users have grown more and more conscious of data privacy issues and have adopted protective measures concerning data privacy, such as automatic destruction of cookies after a session is ended, or simply giving away less personnal information (Goldfarb et Tucker (2012) ) .Valuable user information may be lost, though tracking technologies evolution have permitted to maintain tracking by other means. This issue may be particularly important in countries highly concerned with data privacy issues such as Germany.
    • Offline/Online bridge: an Attribution Model should take into account all campaigns to draw valuable insights. However, the exposure to offline campaigns (TV, newspapers) are difficult to track at the user level. One idea to tackle this issue would be to estimate the proportion of conversions led by offline campaigns through AB testing and deduce this proportion from the credit assigned to the online campaigns accounted for in the Attribution Model.
    • Touch point information available: clicks are easy to follow but irrelevant to take into account the influence of purely visual campaigns such as display ads or video.

                          2.2 Today’s main practices

Two main families of Attribution Models exist:

  • Rule-Based Attribution Models, which have been used for in the last decade but from which companies are gradualy switching.

Attribution depends on the individual journeys that have led to a purchase and is solely based on the rank of the campaign in the journey. Some models focus on a single touch points (First Click, Last Click) while others account for multi-touch journeys (Bathtube, Linear). It can be calculated at the customer level and thus doesn’t require large amounts of data points. We can distinguish two sub-groups of rule-based Attribution Models:

  • One Touch Attribution Models attribute all credit to a single touch point. The First-Click model attributes all credit for a converion to the first touch point of the customer journey; last touch attributes all credit to the last campaign.
  • Multi-touch Rule-Based Attribution Models incorporate information on the whole customer journey are thus an improvement compared to one touch models. To this family belong Linear model where credit is split equally between all channels, Bathtube model where 40% of credit is given to first and last clicks and the remaining 20% is distributed equally between the middle channels, or time-decay models where credit assigned to a click diminishes as the time between the click and the order increases..

The main advantages of rule-based models is their simplicity and cost effectiveness. The main problems are:

– They are a priori known and can thus lead to optimization strategies from competitors
– They do not take into account aggregate intelligence on customer journeys and actual incremental values.
– They tend to bias (depending on the model chosen) channels that are over-represented at the beggining or end of the funnel, according to theoretical assumptions that have no observationnal back-ups.

  • Data-Driven Attribution Models

These models take into account the weaknesses of rule-based models and make a relevant use of available data. Being data-driven, following attribution models cannot be computed using single user level data. On the contrary values are calculated through data aggregation and thus require a certain volume of customer journey information.

References:

https://dspace.mit.edu/handle/1721.1/64920


        3. Data-Driven Attribution Models in practice

                          3.1 Issues

Several issues arise in the computation of campaigns individual impact on a given KPI within a data-driven model.

  • Selection biases: Exposure to certain types of advertisement is usually highly correlated to non-observable variables which are in turn correlated to consumption practices. Differences in the behaviour of users exposed to different campaigns may thus only be driven by core differences in conversion probabilities between groups whether than by the campaign effect.
  • Complementarity: it may be that campaigns A and B only have an effect when combined, so that measuring their individual impact would lead to misleading conclusions. The model could then try to assess the effect of combinations of campaigns on top of the effect of individual campaigns. As the number of possible non-ordered combinations of k campaigns is 2k, it becomes clear that inclusing all possible combinations would however be time-consuming.
  • Order-sensitivity: The effect of a campaign A may depend on the place where it appears in the customer journey, meaning the rank of a campaign and not merely its presence could be accounted for in the model.
  • Relative Order-sensitivity: it may be that campaigns A and B only have an effect when one is exposed to campaign A before campaign B. If so, it could be useful to assess the effect of given combinations of campaigns as well. And this for all campaigns, leading to tremendous numbers of possible combinations.
  • All previous phenomenon may be present, increasing even more the potential complexity of a comprehensive Attribution Model. The number of all possible ordered combination of k campaigns is indeed :


                          3.2 Main models

                                  A) Logistic Regression and Classification models

If non converting journeys are available, Attribition Model can be shaped as a simple classification issue. Campaign types or campaigns combination and volume of campaign types can be included in the model along with customer or time variables. As we are interested in inference (on campaigns effect) whether than prediction, a parametric model should be used, such as Logistic Regression. Non paramatric models such as Random Forests or Neural Networks can also be used though the interpretation of campaigns value would be more difficult to derive from the model results.

A common pitfall is the usual issue of spurious correlations on one hand and the correct interpretation of coefficients in business terms.

An advantage if the possibility to evaluate the relevance of the model using common model validation methods to evaluate its predictive power (validation set \ AUC \pseudo R squared).

                                  B) Shapley Value

Theory

The Shapley Value is based on a Game Theory framework and is named after its creator, the Nobel Price Laureate Lloyd Shapley. Initially meant to calculate the marginal contribution of players in cooperative games, the model has received much attention in research and industry and has lately been applied to marketing issues. This model is typically used by Google Adords and other ad bidding vendors. Campaigns or marketing channels are in this model seen as compementary players looking forward to increasing a given KPI.
Contrarily to Logistic Regressions, it is a non-parametric model. Contrarily to Markov Chains, all results are built using existing journeys, and not simulated ones.

Channels are considered to enter the game sequentially under a certain joining order. Shapley value try to The Shapley value of channel i is the weighted sum of the marginal values that channel i adds to all possible coalitions that don’t contain channel i.
In other words, the main logic is to analyse the difference of gains when a channel i is added after a coalition Ck of k channels, k<=n. We then sum all the marginal contributions over all possible ordered combination Ck of all campaigns excluding i, with k<=n-1.

Subsets framework

A first an most usual way to compute the Shapley Vaue is to consider that when a channel enters coalition, its additionnal value is the same irrelevant of the order in which previous channels have appeared. In other words, journeys (A>B>C) and (B>A>C) trigger the same gains.
Shapley value is computed as the gains associated to adding a channel i to a subset of channels, weighted by the number of (ordered) sequences that the (unordered) subset represents, summed up on all possible subsets of the total set of campaigns where the channel i is not present.
The Shapley value of the channel ???????? is then:

where |S| is the number of campaigns of a coalition S and the sum extends over all subsets S that do not not contain channel j. ????(????)  is the value of the coalition S and ????(???? ∪ {????????})  the value of the coalition formed by adding ???????? to coalition S. ????(???? ∪ {????????}) − ????(????) is thus the marginal contribution of channel ???????? to the coalition S.

The formula can be rewritten and understood as:

This method is convenient when data on the gains of on all possible permutations of all unordered k subsets of the n campaigns are available. It is also more convenient if the order of campaigns prior to the introduction of a campaign is thought to have no impact.

Ordered sequences

Let us define ????((A>B)) as the value of the sequence A then B. What is we let ????((A>B)) be different from ????((B>A)) ?
This time we would need to sum over all possible permutation of the S campaigns present before  ???????? and the N-(S+1) campaigns after ????????. Doing so we will sum over all possible orderings (i.e all permutations of the n campaigns of the grand coalition containing all campaigns) and we can remove the permutation coefficient s!(p-s+1)!.

This method is convenient when the order of channels prior to and after the introduction of another channel is assumed to have an impact. It is also necessary to possess data for all possible permutations of all k subsets of the n campaigns, and not only on all (unordered) k-subsets of the n campaigns, k<=n. In other words, one must know the gains of A, B, C, A>B, B>A, etc. to compute the Shapley Value.

Differences between the two approaches

We simulate an ordered case where the value for each ordered sequence k for k<=3 is known. We compare it to the usual Shapley value calculated based on known gains of unordered subsets of campaigns. So as to compare relevant values, we have built the gains matrix so that the gains of a subset A, B i.e  ????({B,A}) is the average of the gains of ordered sequences made up with A and B (assuming the number of journeys where A>B equals the number of journeys where B>A, we have ????({B,A})=0.5( ????((A>B)) + ????((B>A)) ). We let the value of the grand coalition be different depending on the order of campaigns-keeping the constraints that it averages to the value used for the unordered case.

Note: mvA refers to the marginal value of A in a given sequence.
With traditionnal unordered coalitions:

With ordered sequences used to compute the marginal values:
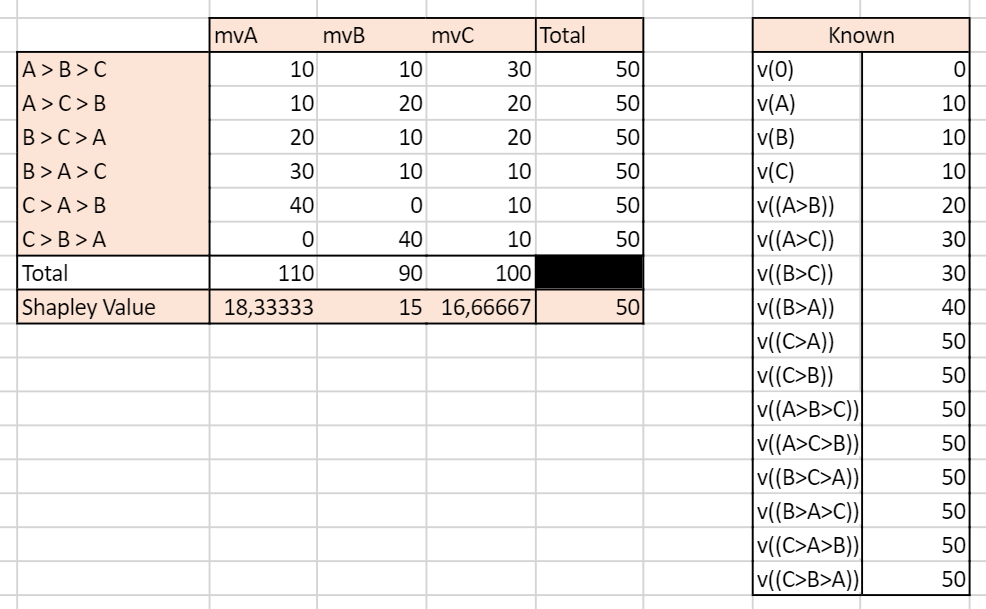
 

We can see that the two approaches yield very different results. In the unordered case, the Shapley Value campaign C is the highest, culminating at 20, while A and B have the same Shapley Value mvA=mvB=15. In the ordered case, campaign A has the highest Shapley Value and all campaigns have different Shapley Values.

This example illustrates the inherent differences between the set and sequences approach to Shapley values. Real life data is more likely to resemble the ordered case as conversion probabilities may for any given set of campaigns be influenced by the order through which the campaigns appear.

Advantages

Shapley value has become popular in allocation problems in cooperative games because it is the unique allocation which satisfies different axioms:

  • Efficiency: Shaple Values of all channels add up to the total gains (here, orders) observed.
  • Symmetry: if channels A and B bring the same contribution to any coalition of campaigns, then their Shapley Value i sthe same
  • Null player: if a channel brings no additionnal gains to all coalitions, then its Shapley Value is zero
  • Strong monotony: the Shapley Value of a player increases weakly if all its marginal contributions increase weakly

These properties make the Shapley Value close to what we intuitively define as a fair attribution.

Issues

  • The Shapley Value is based on combinatory mathematics, and the number of possible coalitions and ordered sequences becomes huge when the number of campaigns increases.
  • If unordered, the Shapley Value assumes the contribution of campaign A is the same if followed by campaign B or by C.
  • If ordered, the number of combinations for which data must be available and sufficient is huge.
  • Channels rarely present or present in long journeys will be played down.
  • Generally, gains are supposed to grow with the number of players in the game. However, it is plausible that in the marketing context a journey with a high number of channels will not necessarily bring more orders than a journey with less channels involved.

References:

R package: GameTheoryAllocation

Article:
Zhao & al, 2018 “Shapley Value Methods for Attribution Modeling in Online Advertising “
https://link.springer.com/content/pdf/10.1007/s13278-017-0480-z.pdf
Courses: https://www.lamsade.dauphine.fr/~airiau/Teaching/CoopGames/2011/coopgames-7%5b8up%5d.pdf
Blogs: https://towardsdatascience.com/one-feature-attribution-method-to-supposedly-rule-them-all-shapley-values-f3e04534983d

                                  B) Markov Chains

Markov Chains are used to model random processes, i.e events that occur in a sequential manner and in such a way that the probability to move to a certain state only depends on the past steps. The number of previous steps that are taken into account to model the transition probability is called the memory parameter of the sequence, and for the model to have a solution must be comprised between 0 and 4. A Markov Chain process is thus defined entirely by its Transition Matrix and its initial vector (i.e the starting point of the process).

Markov Chains are applied in many scientific fields. Typically, they are used in weather forecasting, with the sequence of Sunny and Rainy days following a Markov Process of memory parameter 0, so that for each given day the probability that the next day will be rainy or sunny only depends on the weather of the current day. Other applications can be found in sociology to understand the dynamics of social classes intergenerational reproduction. To get more both mathematical and applied illustration, I recommend the reading of this course.

In the marketing context, Markov Chains are an interesting way to model the conversion funnel. To go from the from the Markov Model to the Attribution logic, we calculate the Removal Effect of each channel, i.e the difference in conversions that happen if the channel is removed. Please read below for an introduction to the methodology.

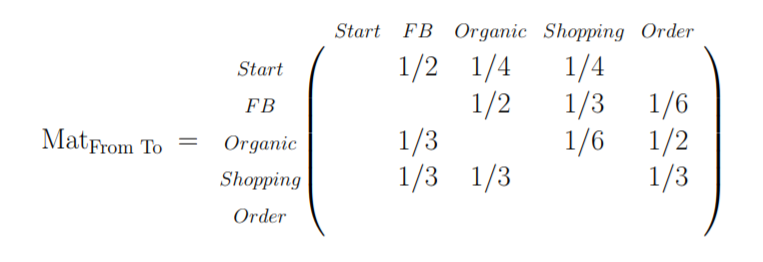
The first step in a Markov Chains Attribution Model is to build the transition matrix that captures the transition probabilities between the campaigns accross existing customer journeys. This Matrix is to be read as a “From state A to state B” table, from the left to the right. A first difficulty is finding the right memory parameter to use. A large memory parameter would allow to take more into account interraction effects within the conversion funnel but would lead to increased computationnal time, a non-readable transition matrix, and be more sensitive to noisy data. Please note that this transition matrix provides useful information on the conversion funnel and on the relationships between campaigns and can be used as such as an analytical tool. I suggest the clear and easily R code which can be found here or here.

Here is an illustration of a Markov Chain with memory Parameter of 0: the probability to go to a certain campaign B in the next step only depend on the campaign we are currently at:
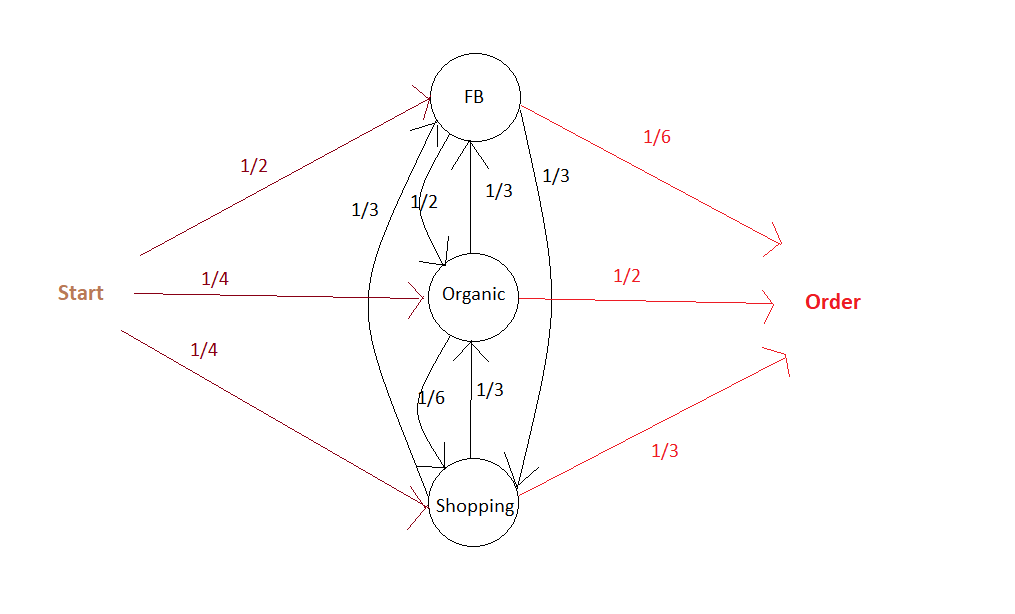
The associated Transition Matrix is then (with null probabilities left as Blank):
The second step is  to compute the actual responsibility of a channel in total conversions. As mentionned above, the main philosophy to do so is to calculate the Removal Effect of each channel, i.e the changes in the number of conversions when a channel is entirely removed. All customer journeys which went through this channel are settled out to be unsuccessful. This calculation is done by applying the transition matrix with and without the removed channels to an initial vector that contains the number of desired simulations.

Building on our current example, we can then settle an initial vector with the desired number of simulations, e.g 10 000:


It is possible at this stage to add a constraint on the maximum number of times the matrix is applied to the data, i.e on the maximal number of campaigns a simulated journey is allowed to have.

Advantages

  • The dynamic journey is taken into account, as well as the transition between two states. The funnel is not assumed to be linear.
  • It is possile to build a conversion graph that maps the customer journey provides valuable insights.
  • It is possible to evaluate partly the accuracy of the Attribution Model based on Markov Chains. It is for example possible to see how well the transition matrix help predict the future by analysing the number of correct predictions at any given step over all sequences.

Disadvantages

  • It can be somewhat difficult to set the memory parameter. Complementarity effects between channels are not well taken into account if the memory is low, but a parameter too high will lead to over-sensitivity to noise in the data and be difficult to implement if customer journeys tend to have a number of campaigns below this memory parameter.
  • Long journeys with different channels involved will be overweighted, as they will count many times in the Removal Effect.  For example, if there are n-1 channels in the customer journey, this journey will be considered as failure for the n-1 channel-RE. If the volume effects (i.e the impact of the overall number of channels in a journey, irrelevant from their type° are important then results may be biased.

References:

R package: ChannelAttribution

Git:

https://github.com/MatCyt/Markov-Chain/blob/master/README.md

Course:

https://www.ssc.wisc.edu/~jmontgom/markovchains.pdf

Article:

“Mapping the Customer Journey: A Graph-Based Framework for Online Attribution Modeling”; Anderl, Eva and Becker, Ingo and Wangenheim, Florian V. and Schumann, Jan Hendrik, 2014. Available at SSRN: https://ssrn.com/abstract=2343077 or http://dx.doi.org/10.2139/ssrn.2343077

“Media Exposure through the Funnel: A Model of Multi-Stage Attribution”, Abhishek & al, 2012

“Multichannel Marketing Attribution Using Markov Chains”, Kakalejčík, L., Bucko, J., Resende, P.A.A. and Ferencova, M. Journal of Applied Management and Investments, Vol. 7 No. 1, pp. 49-60.  2018

Blogs:

https://analyzecore.com/2016/08/03/attribution-model-r-part-1

https://analyzecore.com/2016/08/03/attribution-model-r-part-2

                          3.3 To go further: Tackling selection biases with Quasi-Experiments

Exposure to certain types of advertisement is usually highly correlated to non-observable variables. Differences in the behaviour of users exposed to different campaigns may thus only be driven by core differences in converison probabilities between groups whether than by the campaign effect. These potential selection effects may bias the results obtained using historical data.

Quasi-Experiments can help correct this selection effect while still using available observationnal data.  These methods recreate the settings on a randomized setting. The goal is to come as close as possible to the ideal of comparing two populations that are identical in all respects except for the advertising exposure. However, populations might still differ with respect to some unobserved characteristics.

Common quasi-experimental methods used for instance in Public Policy Evaluation are:

  • Discontinuity Regressions
  • Matching Methods, such as Exact Matching,  Propensity-score matching or k-nearest neighbourghs.

References:

Article:

“Towards a digital Attribution Model: Measuring the impact of display advertising on online consumer behaviour”, Anindya Ghose & al, MIS Quarterly Vol. 40 No. 4, pp. 1-XX, 2016

https://pdfs.semanticscholar.org/4fa6/1c53f281fa63a9f0617fbd794d54911a2f84.pdf

        4. First Steps towards a Practical Implementation

Identify key points of interests

  • Identify the nature of touchpoints available: is the data based on clicks? If so, is there a way to complement the data with A/B tests to measure the influence of ads without clicks (display, video) ? For example, what happens to sales when display campaign is removed? Analysing this multiplier effect would give the overall responsibility of display on sales, to be deduced from current attribution values given to click-based channels. More interestingly, what is the impact of the removal of display campaign on the occurences of click-based campaigns ? This would give us an idea of the impact of display ads on the exposure to each other campaigns, which would help correct the attribution values more precisely at the campaign level.
  • Define the KPI to track. From a pure Marketing perspective, looking at purchases may be sufficient, but from a financial perspective looking at profits, though a bit more difficult to compute, may drive more interesting results.
  • Define a customer journey. It may seem obvious, but the notion needs to be clarified at first. Would it be defined by a time limit? If so, which one? Does it end when a conversion is observed? For example, if a customer makes 2 purchases, would the campaigns he’s been exposed to before the first order still be accounted for in the second order? If so, with a time decay?
  • Define the research framework: are we interested only in customer journeys which have led to conversions or in all journeys? Keep in mind that successful customer journeys are a non-representative sample of customer journeys. Models built on the analysis of biased samples may be conservative. Take an extreme example: 80% of customers who see campaign A buy the product, VS 1% for campaign B. However, campaign B exposure is great and 100 Million people see it VS only 1M for campaign A. An Attribution Model based on successful journeys will give higher credit to campaign B which is an auguable conclusion. Taking into account costs per campaign (in the case where costs are calculated by clicks) may of course tackle this issue partly, as campaign A could then exhibit higher returns, but a serious fallacious reasonning is at stake here.

Analyse the typical customer journey    

  • Performing a duration analysis on the data may help you improve the definition of the customer journey to be used by your organization. After which days are converison probabilities null? Should we consider the effect of campaigns disappears after x days without orders? For example, if 99% of orders are placed in the 30 days following a first click, it might be interesting to define the customer journey as a 30 days time frame following the first oder.
  • Look at the distribution of the number of campaigns in a typical journey. If you choose to calculate the effect of campaigns interraction in your Attribution Model, it may indeed help you determine the maximum number of campaigns to be included in a combination. Indeed, you may not need to assess the impact of channel combinations with above than 4 different channels if 95% of orders are placed after less then 4 campaigns.
  • Transition matrixes: what if a campaign A systematically leads to a campaign B? What happens if we remove A or B? These insights would give clues to ask precise questions for a latter AB test, for example to find out if there is complementarity between channels A and B – (implying none should be removed) or mere substitution (implying one can be given up).
  • If conversion rates are available: it can be interesting to perform a survival analysis i.e to analyse the likelihood of conversion based on duration since first click. This could help us excluse potential outliers or individuals who have very low conversion probabilities.

Summary

Attribution is a complex topic which will probably never be definitively solved. Indeed, a main issue is the difficulty, or even impossibility, to evaluate precisely the accuracy of the attribution model that we’ve built. Attribution Models should be seen as a good yet always improvable approximation of the incremental values of campaigns, and be presented with their intrinsinc limits and biases.

Predictive maintenance in Semiconductor Industry: Part 1

The process in the semiconductor industry is highly complicated and is normally under consistent observation via the monitoring of the signals coming from several sensors. Thus, it is important for the organization to detect the fault in the sensor as quickly as possible. There are existing traditional statistical based techniques however modern semiconductor industries have the ability to produce more data which is beyond the capability of the traditional process.

For this article, we will be using SECOM dataset which is available here.  A lot of work has already done on this dataset by different authors and there are also some articles available online. In this article, we will focus on problem definition, data understanding, and data cleaning.

This article is only the first of three parts, in this article we will discuss the business problem in hand and clean the dataset. In second part we will do feature engineering and in the last article we will build some models and evaluate them.

Problem definition

This data which is collected by these sensors not only contains relevant information but also a lot of noise. The dataset contains readings from 590. Among the 1567 examples, there are only 104 fail cases which means that out target variable is imbalanced. We will look at the distribution of the dataset when we look at the python code.

NOTE: For a detailed description regarding this cases study I highly recommend to read the following research papers:

  •  Kerdprasop, K., & Kerdprasop, N. A Data Mining Approach to Automate Fault Detection Model Development in the Semiconductor Manufacturing Process.
  • Munirathinam, S., & Ramadoss, B. Predictive Models for Equipment Fault Detection in the Semiconductor Manufacturing Process.

Data Understanding and Preparation

Let’s start exploring the dataset now. The first step as always is to import the required libraries.

There are several ways to import the dataset, you can always download and then import from your working directory. However, I will directly import using the link. There are two datasets: one contains the readings from the sensors and the other one contains our target variable and a timestamp.

The first step before doing the analysis would be to merge the dataset and we will us pandas library to merge the datasets in just one line of code.

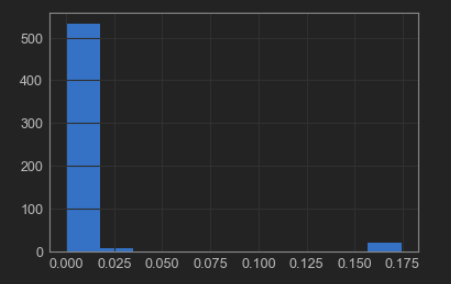
Now let’s check out the distribution of the target variable

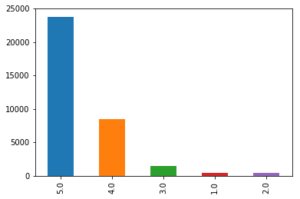
Figure 1: Distribution of Target Variable

From Figure 1 it can be observed that the target variable is imbalanced and it is highly recommended to deal with this problem before the model building phase to avoid bias model. Xgboost is one of the models which can deal with imbalance classes but one needs to spend a lot of time to tune the hyper-parameters to achieve the best from the model.

The dataset in hand contains a lot of null values and the next step would be to analyse these null values and remove the columns having null values more than a certain percentage. This percentage is calculated based on 95th quantile of null values.

Figure 2: Missing percentge in each column

Now we calculate the 95th percentile of the null values.

Figure 3: Missing percentage after removing columns with more then 45% Na

From figure 3 its visible that there are still missing values in the dataset and can be dealt by using many imputation methods. The most common method is to impute these values by mean, median or mode. There also exist few sophisticated techniques like K-nearest neighbour and interpolation.  We will be applying interpolation technique to our dataset. 

To prepare our dataset for analysis we should remove some more unwanted columns like columns with near zero variance. For this we can calulate number of unique values in each column and if there is only one unique value we can delete the column as it holds no information.

We have applied few data cleaning techniques and reduced the features from 590 to 444. However, In the next article we will apply some feature engineering techniques and adress problems like the curse of dimensionality and will also try to balance the target variable.

Bleiben Sie dran!!

Language Detecting with sklearn by determining Letter Frequencies

Of course, there are better and more efficient methods to detect the language of a given text than counting its lettes. On the other hand this is a interesting little example to show the impressing ability of todays machine learning algorithms to detect hidden patterns in a given set of data.

For example take the sentence:

“Ceci est une phrase française.”

It’s not to hard to figure out that this sentence is french. But the (lowercase) letters of the same sentence in a random order look like this:

“eeasrsçneticuaicfhenrpaes”

Still sure it’s french? Regarding the fact that this string contains the letter “ç” some people could have remembered long passed french lessons back in school and though might have guessed right. But beside the fact that the french letter “ç” is also present for example in portuguese, turkish, catalan and a few other languages, this is still a easy example just to explain the problem. Just try to guess which language might have generated this:

“ogldviisnntmeyoiiesettpetorotrcitglloeleiengehorntsnraviedeenltseaecithooheinsnstiofwtoienaoaeefiitaeeauobmeeetdmsflteightnttxipecnlgtetgteyhatncdisaceahrfomseehmsindrlttdthoaranthahdgasaebeaturoehtrnnanftxndaeeiposttmnhgttagtsheitistrrcudf”

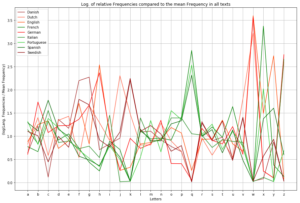
While this looks simply confusing to the human eye and it seems practically impossible to determine the language it was generated from, this string still contains as set of hidden but well defined patterns from which the language could be predictet with almost complete (ca. 98-99%) certainty.

First of all, we need a set of texts in the languages our model should be able to recognise. Luckily with the package NLTK there comes a big set of example texts which actually are protocolls of the european parliament and therefor are publicly availible in 11 differen languages:

  •  Danish
  •  Dutch
  •  English
  •  Finnish
  •  French
  •  German
  •  Greek
  •  Italian
  •  Portuguese
  •  Spanish
  •  Swedish

Because the greek version is not written with the latin alphabet, the detection of the language greek would just be too simple, so we stay with the other 10 languages availible. To give you a idea of the used texts, here is a little sample:

“Resumption of the session I declare resumed the session of the European Parliament adjourned on Friday 17 December 1999, and I would like once again to wish you a happy new year in the hope that you enjoyed a pleasant festive period.
Although, as you will have seen, the dreaded ‘millennium bug’ failed to materialise, still the people in a number of countries suffered a series of natural disasters that truly were dreadful.”

Train and Test

The following code imports the nessesary modules and reads the sample texts from a set of text files into a pandas.Dataframe object and prints some statistics about the read texts:

Above you see a sample set of random rows of the created Dataframe. After removing very short text snipplets (less than 200 chars) we are left with 56481 snipplets. The function clean_eutextdf() then creates a lower case representation of the texts in the coloum ‘ltext’ to facilitate counting the chars in the next step.
The following code snipplet now extracs the features – in this case the relative frequency of each letter in every text snipplet – that are used for prediction:

Now that we have calculated the features for every text snipplet in our dataset, we can split our data set in a train and test set:

After doing that, we can train a k-nearest-neigbours classifier and test it to get the percentage of correctly predicted languages in the test data set. Because we do not know what value for k may be the best choice, we just run the training and testing with different values for k in a for loop:

As you can see in the output the reliability of the language classifier is generally very high: It starts at about 97.5% for k = 1, increases for with increasing values of k until it reaches a maximum level of about 98.5% at k ≈ 10.

Using the Classifier to predict languages of texts

Now that we have trained and tested the classifier we want to use it to predict the language of example texts. To do that we need two more functions, shown in the following piece of code. The first one extracts the nessesary features from the sample text and predict_lang() predicts the language of a the texts:

With this classifier it is now also possible to predict the language of the randomized example snipplet from the introduction (which is acutally created from the first paragraph of this article):

The KNN classifier of sklearn also offers the possibility to predict the propability with which a given classification is made. While the probability distribution for a specific language is relativly clear for long sample texts it decreases noticeably the shorter the texts are.

Background and Insights

Why does a relative simple model like counting letters acutally work? Every language has a specific pattern of letter frequencies which can be used as a kind of fingerprint: While there are almost no y‘s in the german language this letter is quite common in english. In french the letter k is not very common because it is replaced with q in most cases.
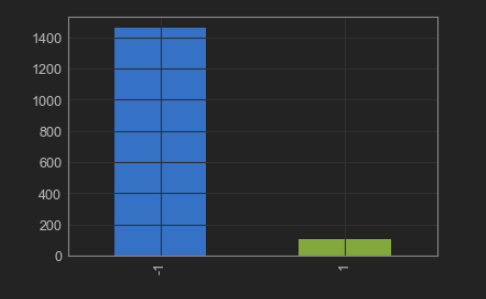
For a better understanding look at the output of the following code snipplet where only three letters already lead to a noticable form of clustering:


Even though every single letter frequency by itself is not a very reliable indicator, the set of frequencies of all present letters in a text is a quite good evidence because it will more or less represent the letter frequency fingerprint of the given language. Since it is quite hard to imagine or visualize the above plot in more than three dimensions, I used a little trick which shows that every language has its own typical fingerprint of letter frequencies:

What more?

Beside the fact, that letter frequencies alone, allow us to predict the language of every example text (at least in the 10 languages with latin alphabet we trained for) with almost complete certancy there is even more information hidden in the set of sample texts.

As you might know, most languages in europe belong to either the romanian or the indogermanic language family (which is actually because the romans conquered only half of europe). The border between them could be located in belgium, between france and germany and in swiss. West of this border the romanian languages, which originate from latin, are still spoken, like spanish, portouguese and french. In the middle and northern part of europe the indogermanic languages are very common like german, dutch, swedish ect. If we plot the analysed languages with a different colour sheme this border gets quite clear and allows us to take a look back in history that tells us where our languages originate from:

As you can see the more common letters, especially the vocals like a, e, i, o and u have almost the same frequency in all of this languages. Far more interesting are letters like q, k, c and w: While k is quite common in all of the indogermanic languages it is quite rare in romanic languages because the same sound is written with the letters q or c.
As a result it could be said, that even “boring” sets of data (just give it a try and read all the texts of the protocolls of the EU parliament…) could contain quite interesting patterns which – in this case – allows us to predict quite precisely which language a given text sample is written in, without the need of any translation program or to speak the languages. And as an interesting side effect, where certain things in history happend (or not happend): After two thousand years have passed, modern machine learning techniques could easily uncover this history because even though all these different languages developed, they still have a set of hidden but common patterns that since than stayed the same.

Sentiment Analysis using Python

One of the applications of text mining is sentiment analysis. Most of the data is getting generated in textual format and in the past few years, people are talking more about NLP. Improvement is a continuous process and many product based companies leverage these text mining techniques to examine the sentiments of the customers to find about what they can improve in the product. This information also helps them to understand the trend and demand of the end user which results in Customer satisfaction.

As text mining is a vast concept, the article is divided into two subchapters. The main focus of this article will be calculating two scores: sentiment polarity and subjectivity using python. The range of polarity is from -1 to 1(negative to positive) and will tell us if the text contains positive or negative feedback. Most companies prefer to stop their analysis here but in our second article, we will try to extend our analysis by creating some labels out of these scores. Finally, a multi-label multi-class classifier can be trained to predict future reviews.

Without any delay let’s deep dive into the code and mine some knowledge from textual data.

There are a few NLP libraries existing in Python such as Spacy, NLTK, gensim, TextBlob, etc. For this particular article, we will be using NLTK for pre-processing and TextBlob to calculate sentiment polarity and subjectivity.

The dataset is available here for download and we will be using pandas read_csv function to import the dataset. I would like to share an additional information here which I came to know about recently. Those who have already used python and pandas before they probably know that read_csv is by far one of the most used function. However, it can take a while to upload a big file. Some folks from  RISELab at UC Berkeley created Modin or Pandas on Ray which is a library that speeds up this process by changing a single line of code.

After importing the dataset it is recommended to understand it first and study the structure of the dataset. At this point we are interested to know how many columns are there and what are these columns so I am going to check the shape of the data frame and go through each column name to see if we need them or not.


There are so many columns which are not useful for our sentiment analysis and it’s better to remove these columns. There are many ways to do that: either just select the columns which you want to keep or select the columns you want to remove and then use the drop function to remove it from the data frame. I prefer the second option as it allows me to look at each column one more time so I don’t miss any important variable for the analysis.

Now let’s dive deep into the data and try to mine some knowledge from the remaining columns. The first step we would want to follow here is just to look at the distribution of the variables and try to make some notes. First, let’s look at the distribution of the ratings.

Graphs are powerful and at this point, just by looking at the above bar graph we can conclude that most people are somehow satisfied with the products offered at Amazon. The reason I am saying ‘at’ Amazon is because it is just a platform where anyone can sell their products and the user are giving ratings to the product and not to Amazon. However, if the user is satisfied with the products it also means that Amazon has a lower return rate and lower fraud case (from seller side). The job of a Data Scientist relies not only on how good a model is but also on how useful it is for the business and that’s why these business insights are really important.

Data pre-processing for textual variables

Lowercasing

Before we move forward to calculate the sentiment scores for each review it is important to pre-process the textual data. Lowercasing helps in the process of normalization which is an important step to keep the words in a uniform manner (Welbers, et al., 2017, pp. 245-265).

Special characters

Special characters are non-alphabetic and non-numeric values such as {!,@#$%^ *()~;:/<>\|+_-[]?}. Dealing with numbers is straightforward but special characters can be sometimes tricky. During tokenization, special characters create their own tokens and again not helpful for any algorithm, likewise, numbers.

Stopwords

Stop-words being most commonly used in the English language; however, these words have no predictive power in reality. Words such as I, me, myself, he, she, they, our, mine, you, yours etc.

Stemming

Stemming algorithm is very useful in the field of text mining and helps to gain relevant information as it reduces all words with the same roots to a common form by removing suffixes such as -action, ing, -es and -ses. However, there can be problematic where there are spelling errors.
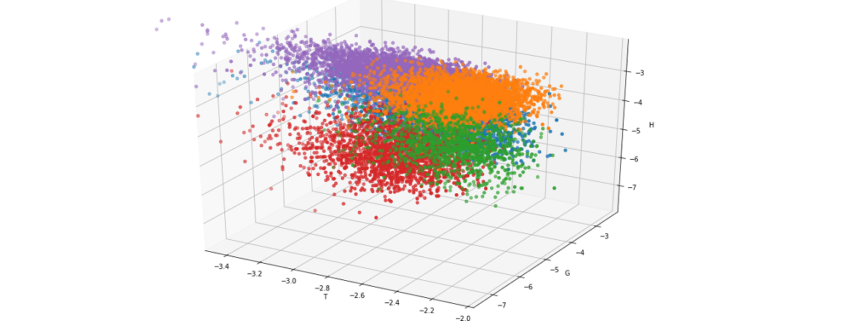
This step is extremely useful for pre-processing textual data but it also depends on your goal. Here our goal is to calculate sentiment scores and if you look closely to the above code words like ‘inexpensive’ and ‘thrilled’ became ‘inexpens’ and ‘thrill’ after applying this technique. This will help us in text classification to deal with the curse of dimensionality but to calculate the sentiment score this process is not useful.
Sentiment Score

It is now time to calculate sentiment scores of each review and check how these scores look like.

As it can be observed there are two scores: the first score is sentiment polarity which tells if the sentiment is positive or negative and the second score is subjectivity score to tell how subjective is the text. The whole code is available here.

In my next article, we will extend this analysis by creating labels based on these scores and finally we will train a classification model.