
Multi-touch attribution: A data-driven approach
This is the first article of article series Getting started with the top eCommerce use cases.
What is Multi-touch attribution?
Customers shopping behavior has changed drastically when it comes to online shopping, as nowadays, customer likes to do a thorough market research about a product before making a purchase. This makes it really hard for marketers to correctly determine the contribution for each marketing channel to which a customer was exposed to. The path a customer takes from his first search to the purchase is known as a Customer Journey and this path consists of multiple marketing channels or touchpoints. Therefore, it is highly important to distribute the budget between these channels to maximize return. This problem is known as multi-touch attribution problem and the right attribution model helps to steer the marketing budget efficiently. Multi-touch attribution problem is well known among marketers. You might be thinking that if this is a well known problem then there must be an algorithm out there to deal with this. Well, there are some traditional models but every model has its own limitation which will be discussed in the next section.
Traditional attribution models
Most of the eCommerce companies have a performance marketing department to make sure that the marketing budget is spent in an agile way. There are multiple heuristics attribution models pre-existing in google analytics however there are several issues with each one of them. These models are:
First touch attribution model
100% credit is given to the first channel as it is considered that the first marketing channel was responsible for the purchase.
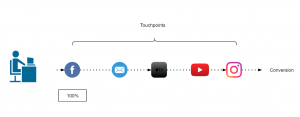
Figure 1: First touch attribution model
Last touch attribution model
100% credit is given to the last channel as it is considered that the first marketing channel was responsible for the purchase.
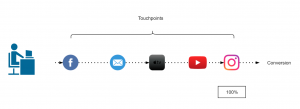
Figure 2: Last touch attribution model
Linear-touch attribution model
In this attribution model, equal credit is given to all the marketing channels present in customer journey as it is considered that each channel is equally responsible for the purchase.
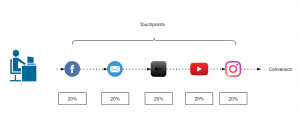
Figure 3: Linear attribution model
U-shaped or Bath tub attribution model
This is most common in eCommerce companies, this model assigns 40% to first and last touch and 20% is equally distributed among the rest.
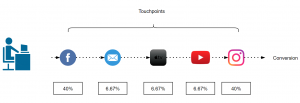
Figure 4: Bathtub or U-shape attribution model
Data driven attribution models
Traditional attribution models follows somewhat a naive approach to assign credit to one or all the marketing channels involved. As it is not so easy for all the companies to take one of these models and implement it. There are a lot of challenges that comes with multi-touch attribution problem like customer journey duration, overestimation of branded channels, vouchers and cross-platform issue, etc.
Switching from traditional models to data-driven models gives us more flexibility and more insights as the major part here is defining some rules to prepare the data that fits your business. These rules can be defined by performing an ad hoc analysis of customer journeys. In the next section, I will discuss about Markov chain concept as an attribution model.
Markov chains
Markov chains concepts revolves around probability. For attribution problem, every customer journey can be seen as a chain(set of marketing channels) which will compute a markov graph as illustrated in figure 5. Every channel here is represented as a vertex and the edges represent the probability of hopping from one channel to another. There will be an another detailed article, explaining the concept behind different data-driven attribution models and how to apply them.
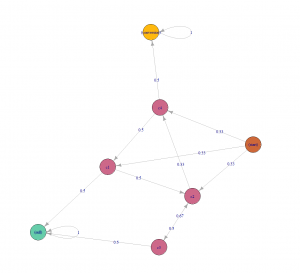
Figure 5: Markov chain example
Challenges during the Implementation
Transitioning from a traditional attribution models to a data-driven one, may sound exciting but the implementation is rather challenging as there are several issues which can not be resolved just by changing the type of model. Before its implementation, the marketers should perform a customer journey analysis to gain some insights about their customers and try to find out/perform:
- Length of customer journey.
- On an average how many branded and non branded channels (distinct and non-distinct) in a typical customer journey?
- Identify most upper funnel and lower funnel channels.
- Voucher analysis: within branded and non-branded channels.
When you are done with the analysis and able to answer all of the above questions, the next step would be to define some rules in order to handle the user data according to your business needs. Some of the issues during the implementation are discussed below along with their solution.
Customer journey duration
Assuming that you are a retailer, let’s try to understand this issue with an example. In May 2016, your company started a Fb advertising campaign for a particular product category which “attracted” a lot of customers including Chris. He saw your Fb ad while working in the office and clicked on it, which took him to your website. As soon as he registered on your website, his boss called him (probably because he was on Fb while working), he closed everything and went for the meeting. After coming back, he started working and completely forgot about your ad or products. After a few days, he received an email with some offers of your products which also he ignored until he saw an ad again on TV in Jan 2019 (after 3 years). At this moment, he started doing his research about your products and finally bought one of your products from some Instagram campaign. It took Chris almost 3 years to make his first purchase.
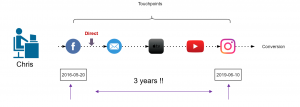
Figure 6: Chris journey
Now, take a minute and think, if you analyse the entire journey of customers like Chris, you would realize that you are still assigning some of the credit to the touchpoints that happened 3 years ago. This can be solved by using an attribution window. Figure 6 illustrates that 83% of the customers are making a purchase within 30 days which means the attribution window here could be 30 days. In simple words, it is safe to remove the touchpoints that happens after 30 days of purchase. This parameter can also be changed to 45 days or 60 days, depending on the use case.
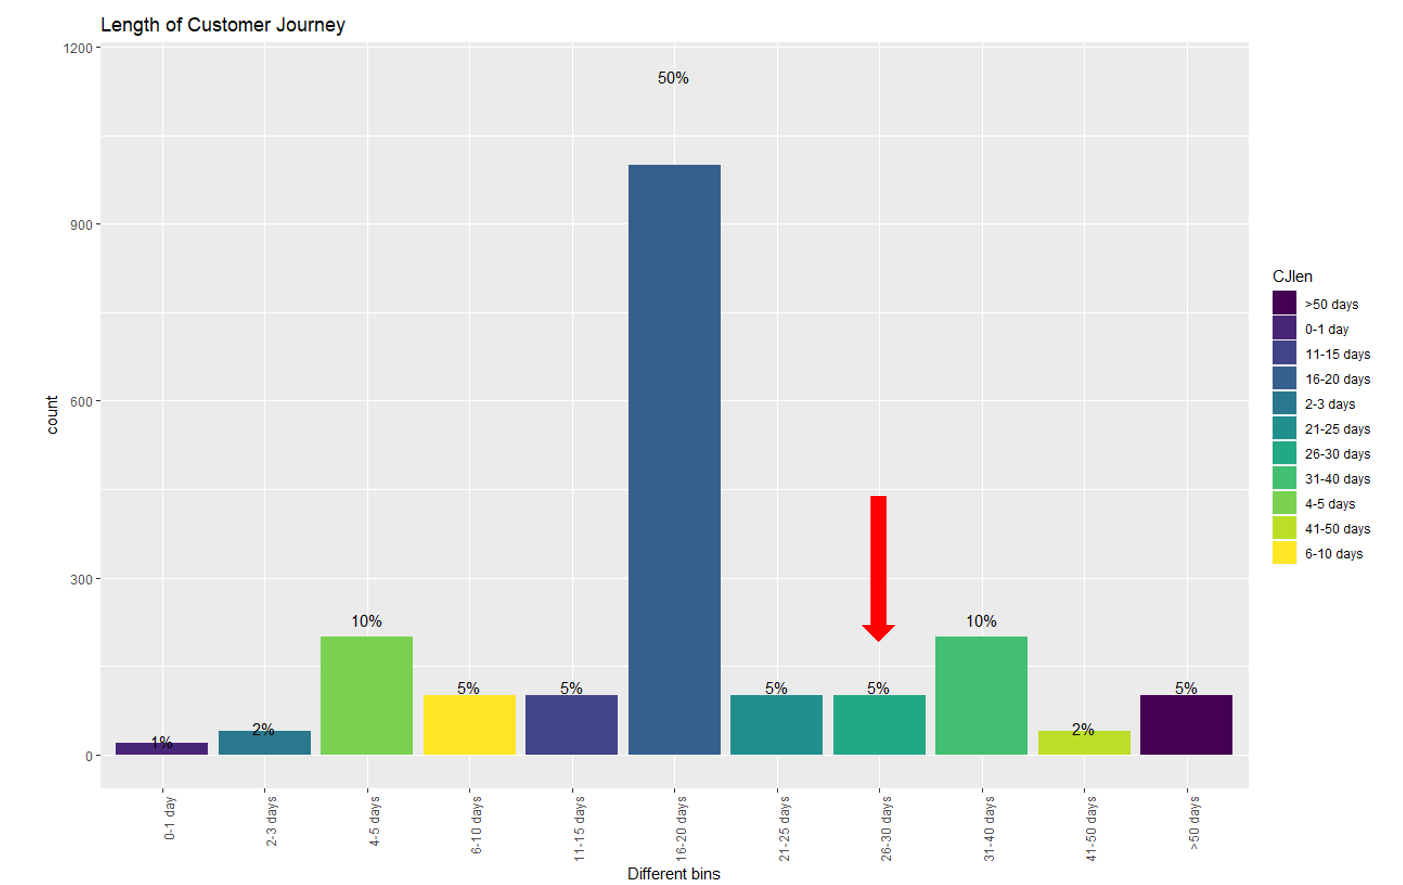
Figure 7: Length of customer journey
Removal of direct marketing channel
A well known issue that every marketing analyst is aware of is, customers who are already aware of the brand usually comes to the website directly. This leads to overestimation of direct channel and branded channels start getting more credit. In this case, you can set a threshold (say 7 days) and remove these branded channels from customer journey.
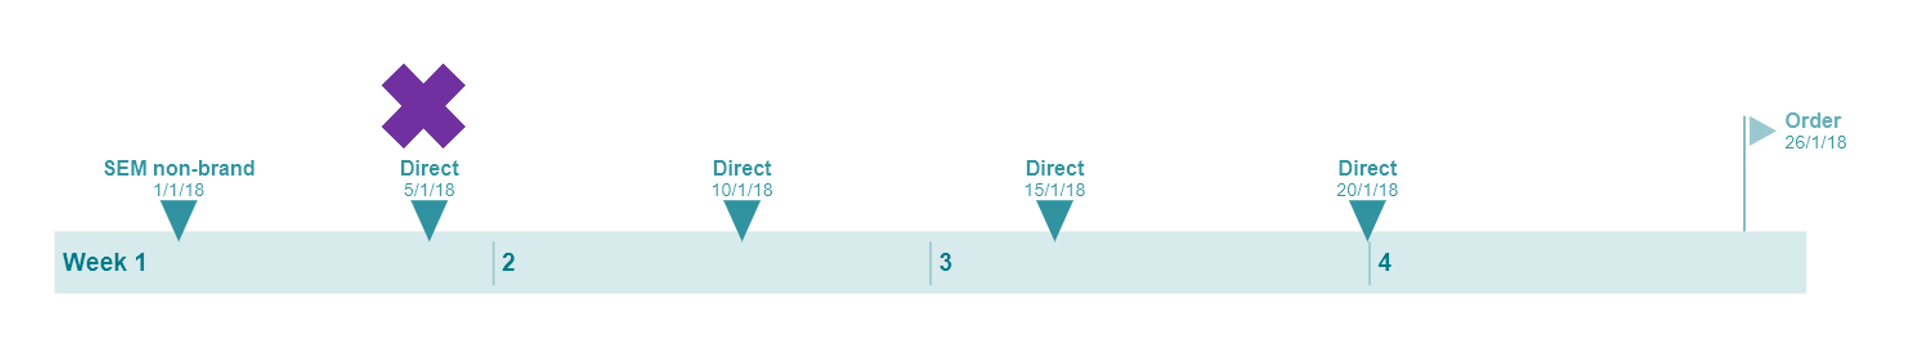
Figure 8: Removal of branded channels
Cross platform problem
If some of your customers are using different devices to explore your products and you are not able to track them then it will make retargeting really difficult. In a perfect world these customers belong to same journey and if these can’t be combined then, except one, other paths would be considered as “non-converting path”. For attribution problem device could be thought of as a touchpoint to include in the path but to be able to track these customers across all devices would still be challenging. A brief introduction to deterministic and probabilistic ways of cross device tracking can be found here.
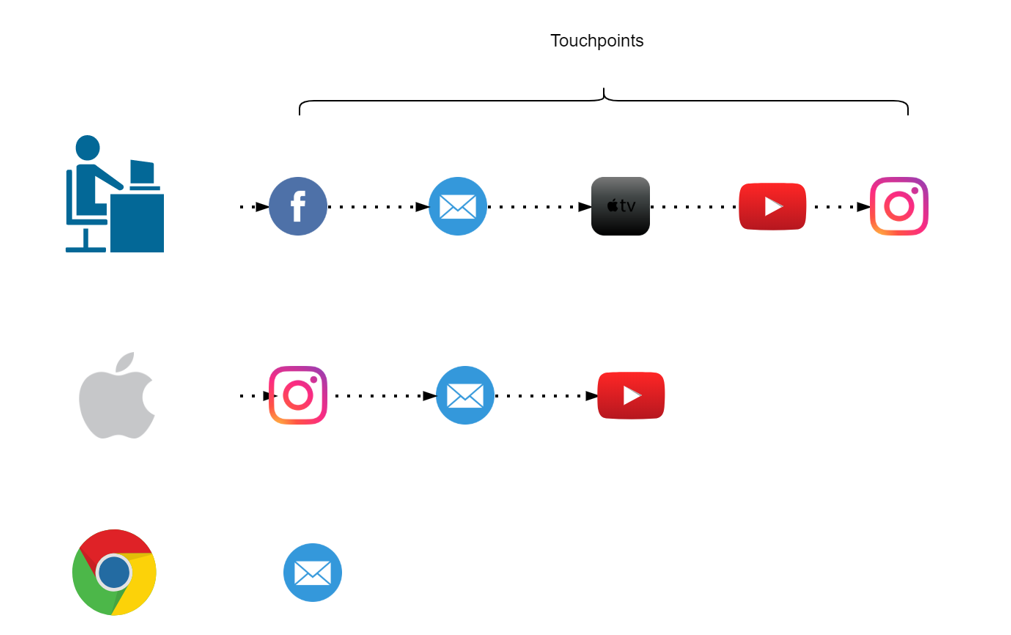
Figure 9: Cross platform clash
How to account for Vouchers?
To better account for vouchers, it can be added as a ‘dummy’ touchpoint of the type of voucher (CRM,Social media, Affiliate or Pricing etc.) used. In our case, we tried to add these vouchers as first touchpoint and also as a last touchpoint but no significant difference was found. Also, if the marketing channel of which the voucher was used was already in the path, the dummy touchpoint was not added.
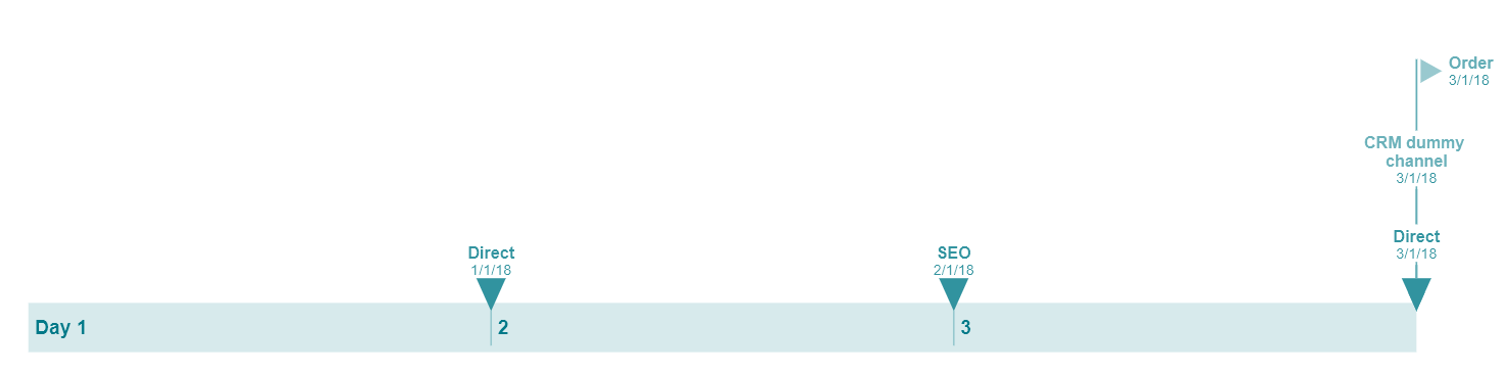
Figure 10: Addition of Voucher as a touchpoint
Let me know in comments if you would like to add something or if you have a different perspective about this use case.
Aakash Chugh
Data Scientist with 4+ years of experience implementing advanced data-driven solutions to complex business problems. Grounded knowledge of building classic machine learning algorithms in R and Python, inferential statistics and modern development tools ( Docker, etc.).


Leave a Reply
Want to join the discussion?Feel free to contribute!