Geschriebene Artikel über Big Data Analytics

Article series: 5 Clean Coding Tips

This series of articles will cover 5 clean coding tips to follow as soon as you’ve made the first steps into your coding career, with the example of python.

At the beginning of your adventure with coding, you might find that getting your code to compile without any errors and give you the output that you expect is hard enough. Conforming to any standards and style guides is at the very bottom of your concerns. You might be at the beginning of your career or you might have a lot of domain experience but not that much in coding. Or maybe until now you worked mostly on your own and never had to make your code available for others to work with it. In any case, it is worth acknowledging how crucial it is to write your code in a concise, readable and understandable way, and how much benefits it will eventually bring you.

The first thing to realize is that the whole clean coding concept has been developed for people, your fellow travelers, not for the computers. The compiler doesn’t care how you name your variables, how you split your lines or if everything is aligned in a pretty way. You could even write your code as a one gigantic, few-meters-long line, giving the interpreter just a signal – a semicolon, that the line should be split, and it will execute it perfectly.

However, it is likely that, the deeper you are into your career, the more people will have to read, understand and modify the code that you wrote. You will write code to communicate certain ideas and solutions with other people. Therefore, you need to be sure, that what you want to communicate is understandable, easy and quick to read. The coding best practice is to always code in a clean way, treating the code itself and not just the output as the result of your work.

There usually are fixed rules and standards regarding code readability. For python, it is the PEP 8[i]. Some companies elaborate on those standards where the PEP 8 is a bit vague or leaves room for interpretation. The exact formatting styles might differ at Facebook, Google[ii] or at the company you happen to work for. But before you get lost in the art of a perfect line splitting, brackets alignment technique, or the hopeless tabs or spaces battle, have a look at the 5 tips in the upcoming articles in this series. They are universal and might help you make your code, less of a chaotic mess and more of blissful delight.

List of articles in this series:

  1. Be consistent
  2. Name variables in a meaningful way
  3. Take advantage of the formatting tools
  4. Stop commenting the obvious
  5. Put yourself in somebody else’s shoes
References:

[i] https://www.python.org/dev/peps/pep-0008/
[ii] http://google.github.io/styleguide/pyguide.html

Integrate Unstructured Data into Your Enterprise to Drive Actionable Insights

In an ideal world, all enterprise data is structured – classified neatly into columns, rows, and tables, easily integrated and shared across the organization.

The reality is far from it! Datamation estimates that unstructured data accounts for more than 80% of enterprise data, and it is growing at a rate of 55 – 65 percent annually. This includes information stored in images, emails, spreadsheets, etc., that cannot fit into databases.

Therefore, it becomes imperative for a data-driven organization to leverage their non-traditional information assets to derive business value. We have outlined a simple 3-step process that can help organizations integrate unstructured sources into their data eco-system:

1. Determine the Challenge

The primary step is narrowing down the challenges you want to solve through the unstructured data flowing in and out of your organization. Financial organizations, for instance, use call reports, sales notes, or other text documents to get real-time insights from the data and make decisions based on the trends. Marketers make use of social media data to evaluate their customers’ needs and shape their marketing strategy.

Figuring out which process your organization is trying to optimize through unstructured data can help you reach your goal faster.

2. Map Out the Unstructured Data Sources Within the Enterprise

An actionable plan starts with identifying the range of data sources that are essential to creating a truly integrated environment. This enables organizations to align the sources with business objectives and streamline their data initiatives.

Deciding which data should be extracted, analyzed, and stored should be a primary concern in this regard. Even if you can ingest data from any source, it doesn’t mean that you should.

Collecting a large volume of unstructured data is not enough to generate insights. It needs to be properly organized and validated for quality before integration. Full, incremental, online, and offline extraction methods are generally used to mine valuable information from unstructured data sources.

3. Transform Unstructured Assets into Decision-Ready Insights

Now that you have all the puzzle pieces, the next step is to create a complete picture. This may require making changes in your organization’s infrastructure to derive meaning from your unstructured assets and get a 360-degree business view.

IDC recommends creating a company culture that promotes the collection, use, and sharing of both unstructured and structured business assets. Therefore, finding an enterprise-grade integration solution that offers enhanced connectivity to a range of data sources, ideally structured, unstructured, and semi-structured, can help organizations generate the most value out of their data assets.

Automation is another feature that can help speed up integration processes, minimize error probability, and generate time-and-cost savings. Features like job scheduling, auto-mapping, and workflow automation can optimize the process of extracting information from XML, JSON, Excel or audio files, and storing it into a relational database or generating insights.

The push to become a data-forward organization has enterprises re-evaluating the way to leverage unstructured data assets for decision-making. With an actionable plan in place to integrate these sources with the rest of the data, organizations can take advantage of the opportunities offered by analytics and stand out from the competition.

Introduction to Recommendation Engines

This is the second article of article series Getting started with the top eCommerce use cases. If you are interested in reading the first article you can find it here.

What are Recommendation Engines?

Recommendation engines are the automated systems which helps select out similar things whenever a user selects something online. Be it Netflix, Amazon, Spotify, Facebook or YouTube etc. All of these companies are now using some sort of recommendation engine to improve their user experience. A recommendation engine not only helps to predict if a user prefers an item or not but also helps to increase sales, ,helps to understand customer behavior, increase number of registered users and helps a user to do better time management. For instance Netflix will suggest what movie you would want to watch or Amazon will suggest what kind of other products you might want to buy. All the mentioned platforms operates using the same basic algorithm in the background and in this article we are going to discuss the idea behind it.

What are the techniques?

There are two fundamental algorithms that comes into play when there’s a need to generate recommendations. In next section these techniques are discussed in detail.

Content-Based Filtering

The idea behind content based filtering is to analyse a set of features which will provide a similarity between items themselves i.e. between two movies, two products or two songs etc. These set of features once compared gives a similarity score at the end which can be used as a reference for the recommendations.

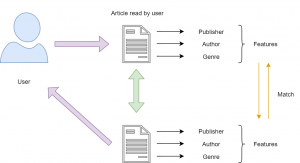
There are several steps involved to get to this similarity score and the first step is to construct a profile for each item by representing some of the important features of that item. In other terms, this steps requires to define a set of characteristics that are discovered easily. For instance, consider that there’s an article which a user has already read and once you know that this user likes this article you may want to show him recommendations of similar articles. Now, using content based filtering technique you could find the similar articles. The easiest way to do that is to set some features for this article like publisher, genre, author etc. Based on these features similar articles can be recommended to the user (as illustrated in Figure 1). There are three main similarity measures one could use to find the similar articles mentioned below.


Figure 1: Content-Based Filtering


Minkowski distance

Minkowski distance between two variables can be calculated as:

(x,y)= (\sum_{i=1}^{n}{|X_{i} - Y_{i}|^{p}})^{1/p}


Cosine Similarity

Cosine similarity between two variables can be calculated as :

  \mbox{Cosine Similarity} = \frac{\sum_{i=1}^{n}{x_{i} y_{i}}} {\sqrt{\sum_{i=1}^{n}{x_{i}^{2}}} \sqrt{\sum_{i=1}^{n}{y_{i}^{2}}}} \


Jaccard Similarity


  J(X,Y) = |X ∩ Y| / |X ∪ Y|


These measures can be used to create a matrix which will give you the similarity between each movie and then a function can be defined to return the top 10 similar articles.


Collaborative filtering

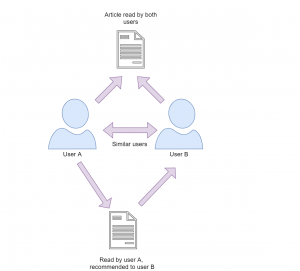
This filtering method focuses on finding how similar two users or two products are by analyzing user behavior or preferences rather than focusing on the content of the items. For instance consider that there are three users A,B and C.  We want to recommend some movies to user A, our first approach would be to find similar users and compare which movies user A has not yet watched and recommend those movies to user A.  This approach where we try to find similar users is called as User-User Collaborative Filtering.  

The other approach that could be used here is when you try to find similar movies based on the ratings given by others, this type is called as Item-Item Collaborative Filtering. The research shows that item-item collaborative filtering works better than user-user collaborative filtering as user behavior is really dynamic and changes over time. Also, there are a lot more users and increasing everyday but on the other side item characteristics remains the same. To calculate the similarities we can use Cosine distance.


Figure 2: Collaborative Filtering


Recently some companies have started to take advantage of both content based and collaborative filtering techniques to make a hybrid recommendation engine. The results from both models are combined into one hybrid model which provides more accurate recommendations. Five steps are involved to make a recommendation engine work which are collection of data, storing of data, analyzing the data, filtering the data and providing recommendations. There are a lot of attributes that are involved in order to collect user data including browsing history, page views, search logs, order history, marketing channel touch points etc. which requires a strong data architecture.  The collection of data is pretty straightforward but it can be overwhelming to analyze this amount of data. Storing this data could get tricky on the other hand as you need a scalable database for this kind of data. With the rise of graph databases this area is also improving for many use cases including recommendation engines. Graph databases like Neo4j can also help to analyze and find similar users and relationship among them. Analyzing the data can be carried in different ways, depending on how strong and scalable your architecture you can run real time, batch or near real time analysis. The fourth step involves the filtering of the data and here you can use any of the above mentioned approach to find similarities to finally provide the recommendations.

Having a good recommendation engine can be time consuming initially but it is definitely beneficial in the longer run. It not only helps to generate revenue but also helps to to improve your product catalog and customer service.

Wie Process Mining 2020 Ihre erfolgreiche Geschäftstransformation 2020 sicherstellt

Fehlende Informationen über bestehende Prozesse sorgen dafür, dass 70% aller großen Transformationsprojekte und rund 50% aller RPA-Projekte scheitern. Grund hierfür sind mangelndes Verständnis der bestehenden Prozesse und die fehlende Verbindung zwischen der Ermittlung, Visualisierung, Analyse und Ausführung vorhandener Daten. Durch den Einsatz von Process Mining-Technologie erhalten Sie die notwendigen Informationen, die Transparenz und die quantifizierbaren Zahlen, die zur Verbesserung der Ende-zu-Ende-Prozesse für eine nachhaltige Transformation erforderlich sind.


Read this article in English:

Six ways process mining in 2020 can save your business transformation


Process Mining im Jahr 2020

Ihr Datenabdruck

Betrachtet man die oben genannten Zahlen (von McKinsey bzw. Ernst & Young (EY)) wird eines deutlich: Die Digitalisierung von Produkten und Dienstleistungen zwingt Unternehmen aller Größen und Branchen dazu, ihre bestehenden Geschäftsmodelle und Prozesse drastisch zu überdenken. Umso wichtiger wird Process Mining. Die Technik nutzt eindeutige Daten – sozusagen den geschäftlichen Fingerabdruck Ihres Unternehmens – um automatisch alle bestehenden Geschäftsprozesse zusammenzufügen und digital darzustellen.

Dieser digitale Nachweis ermöglicht es uns, die Funktionsweise von Prozessen (sowohl in konventioneller als auch variabler Ausführung) bis hin zu einzelnen Prozessinstanzen genau zu visualisieren. Mit anderen Worten: Process Mining deckt verborgene oder inaktive Prozesse auf, legt versteckten Mehrwert offen und ermöglicht ein sofortiges Verständnis.

Mit den richtigen Prozessen zum Erfolg

Mithilfe standardisierter und konfigurierbarer Benachrichtigungen und KPIs können Sie die unmittelbaren Auswirkungen von Prozessänderungen besser nachvollziehen. Auf diese Weise werden Fehlerraten gesenkt und das Vertrauen in das Unternehmen gestärkt. Und das ist noch nicht alles: Jeder, vom neuen Mitarbeiter bis zur C-Suite, kann die Prozesse seiner Organisation besser visualisieren, verstehen und erklären. Dies stellt sicher, dass Prozesse langfristig erfolgreich verändert werden.

Das Potenzial von Prozessen voll ausschöpfen

Im Geschäftsleben ist nicht nur die Kommunikation von entscheidender Bedeutung, sondern auch die Reaktion auf Probleme mit passenden Lösungen. Die täglichen Unternehmensabläufe – gemeint sind die zugrunde liegenden Prozesse – bilden die Verbindung zur eingesetzten Geschäftstechnologie, vom Process Mining bis zur robotergestützten „Prozessautomatisierung“. Ohne ein Verständnis für die Prozesse und tatsächliche Funktionsweise eines Unternehmens ist die Technologie jedoch redundant. Prozesse sind sozusagen das Lebenselixier eines Unternehmens.


Process Mining: Ihr Differenzierungsmerkmal

Integration transformativer, digitaler Technologien

Process Mining bietet weit mehr als Erkennen, Visualisieren und Analysieren: Anhand Ihrer vorhandenen Daten können Sie die Ausführung von Prozessen automatisch in Echtzeit überwachen. Diese einfache Bewertung per Mausklick ermöglicht ein sofortiges Verständnis komplexer Prozesse. Innerhalb von Transformationsprojekten, die aufgrund ihrer Natur tief greifende Änderungen in geschäftlichen und organisatorischen Aktivitäten erfordern, liefert Process Mining die visuelle Übersicht und ermöglicht sofortige Maßnahmen.

Dieser selbsttragende Ansatz führt zu nachhaltigen Ergebnissen und schafft eine Prozesskultur innerhalb des gesamten Unternehmens. Experten für digitale Transformation und Excellence können mithilfe eines solch Ansatzes leichter Prozesse nutzen, ihre Projekte und Programme untermauern und Herausforderungen bei Verhaltensänderungen bewältigen. Hierzu zählen eine leichtere Integration transformativer, digitaler Technologien, bessere operative Agilität und Flexibilität, optimierte Unternehmensführung und -kultur sowie Mitarbeiterförderung.

Drei Wege zu einem erfolgreichen Transformationsprojekt mithilfe von Process Mining:

  • Sie benötigen 100% operative Transparenz: Um all Ihre Transaktionen darstellen zu können, ist vollständige Prozesstransparenz erforderlich. Sie ermöglicht den direkten Vergleich zwischen dem Ist-Zustand und dem geplanten Prozessverlauf. Diese Konformitätsprüfung kann automatisch die Probleme und Aufgaben mit der höchsten Priorität identifizieren und die Hauptursachen für Diskrepanzen zwischen Soll und Ist hervorheben, sodass sofort Maßnahmen ergriffen werden können.
  • Sie müssen Kosten senken und die Effizienz steigern: Untersuchungen von Signavio zeigen, dass fast 60% der Unternehmen aufgrund von Ineffizienzen bei den Prozessen unnötige zusätzliche Kosten tragen mussten. Process Mining kann Ihrem Unternehmen helfen, die Kosten zu senken, da es Schwachstellen und Abweichungen entdeckt und gleichzeitig aufzeigt, welche Prozesse ausbremsen – einschließlich der Engpässe und Ineffizienzen, die sich auf den Umsatz auswirken. Process Mining bietet die Möglichkeit zu Prozessverbesserungen und vorausschauenden Strategien und somit zu positiven geschäftlichen Veränderungen.
  • Sie müssen den Einkaufs- und Verkaufszyklus optimieren: Dauert der Versand zu lange? Welcher Lieferant unterstützt Sie unzureichend? Welcher Lieferant ist der Beste? Process Mining ist Ihr One Click Trick, um Antworten auf solche Fragen zu finden und zu ermitteln, welche Einheiten die beste Leistung erbringen und welche nur Zeit und Geld verschwenden.

Process Mining und Robotic Process Automation (RPA)

Die vorteilhafte Kombination beider Technologien

RPA (Robotic Process Automation) ermöglicht die Automatisierung manueller, sich wiederholender und fehleranfälliger Aufgaben. Dies setzt jedoch voraus, dass Prozessverantwortliche genau wissen, wie und mit welchem Ziel sie Software-Roboter einsetzen und ihre Leistung kontinuierlich messen. Daher bietet die Kombination aus RPA und Process Mining Unternehmen viele Vorteile: Über die gesamte RPA-Initiative hinweg können sie die Leistung und die Vorteile ihrer Software-Roboter messen und sie bestmöglich für ihr Szenario einsetzen.

Upgrade robotergestützter Automatisierung

Mit diesen Erkenntnissen eignet sich Process Mining hervorragend als Vorbereitung für die Prozessautomatisierung: Um die Vorteile der robotergesteuerten Automatisierung vollumfänglich auszuschöpfen, müssen Organisationen nicht nur ihre bestehenden Systeme verstehen, sondern auch Möglichkeiten zur Automatisierung ermitteln. Process Mining-Werkzeuge bieten während des gesamten RPA-Zyklus wertvolle Erkenntnisse über die Prozessdaten: von der Festlegung der Strategie bis hin zu kontinuierlichen Verbesserungen und Innovationen.

 Drei Wege zu einem erfolgreichen RPA Lifecycle-Projekt mithilfe von Process Mining:

  • Sie benötigen Prozessübersichten nach bestimmten Kriterien: Um einen vollständigen Überblick über die Ende-zu-Ende-Prozesse zu erhalten, müssen Prozesse mit hohem ROI identifiziert werden, die sich für die RPA-Implementierung eignen. Auf diese Weise können Sie den optimalen Prozessfluss/-pfad ermitteln und redundante Prozesse aufdecken, die Ihnen vor der Automatisierung möglicherweise gar nicht bewusst waren.
  • Sie sind unsicher, wie Sie die Mensch-Maschine-Zyklen am besten optimieren: Indem Sie den optimalen Prozessfluss/-pfad ermitteln, können Sie auch ineffiziente Mensch-Roboter-Übergaben besser erkennen und erhalten quantifizierbare Daten zu den finanziellen Auswirkungen jedes „digitalen Mitarbeiters“ oder Prozesses. Auf diese Weise können Sie die Arbeit von Mensch und Roboter in Bezug auf Genauigkeit, Effizienz, Kosten und Projektdauer vergleichen.
  • Sie müssen besser verstehen, wie RPA ältere Prozesse und Systeme unterstützt: Durch die Integration in Cloud- und Web-/App-basierte Services können Unternehmen dank RPA auch ihre Legacy-Systeme weiter nutzen. Auf diese Weise lassen sich Legacy-Funktionen mit modernen Tools, Anwendungen und sogar mobilen Apps verbinden. Effizienz und Effektivität werden in allen wichtigen Unternehmensabteilungen, einschließlich HR, Finanzwesen und Legal, verbessert.

Process Mining für ein besseres Kundenerlebnis und Mapping

Denken Sie Kundenzufriedenheit neu

Die Integration von Process Mining in andere Technologien ist auch für eine bessere Prozessqualität und das Wachstum am Markt von entscheidender Bedeutung. So steht beim Prozessmanagement bereits die Kundenbindung im Fokus. Ein erfolgreiches Prozessmanagement ermöglicht es Unternehmen, den Kunden im Rahmen von umfassenden Effektivitätszielen zu geringstmöglichen Kosten zu begeistern, anstatt einseitige Effizienzziele zu verfolgen.

Darüber hinaus bietet Process Mining im Rahmen des Customer Journey Mapping (CJM) – insbesondere in Verknüpfung mit den zugrunde liegenden Prozessen – die Möglichkeit, bessere geschäftliche Erkenntnisse zu erzielen und diese Prozesse mit einer Outside-In-Kundenperspektive zu betrachten. Durch die Kombination aus Process Mining mit einer kundenorientierten Sicht auf die geschäftlichen Tätigkeiten wird die Kundenzufriedenheit zu einem strategischen Faktor für den geschäftlichen Erfolg.

Das volle Potenzial von Prozessen nutzen

Setzen Sie bei Process Mining-Initiativen auf Signavio Process Intelligence und erfahren Sie in unserem kostenlosen Whitepaper Erfolgreiches Process Mining mit Signavio Process Intelligence, wie Ihr Unternehmen den versteckten Mehrwert von Prozessen für sich nutzen, neue Ideen generieren und Zeit und Geld sparen kann.

Six ways process mining in 2020 can save your business transformation

The lack of information about existing processes kills 70% of large transformation projects and around 50% of RPA projects…alarming statistics. Triggering this failure rate is a lack of understanding about existing processes, and the disconnect between the discovery, visualization, analysis, and execution of existing data. So, banish the process guesswork! Utilizing process mining technology unlocks the information, visibility, and quantifiable numbers needed to improve end-to-end processes for sustainable transformation.


Read this article in German:

Wie Process Mining 2020 Ihre erfolgreiche Geschäftstransformation 2020 sicherstellt


Process mining in 2020

Your data fingerprint

If we consider the figures again (from McKinsey and Ernst & Young (EY) respectively), the digitization of products and services is forcing companies of all shapes and sizes, and in all industries, to dramatically reconsider their existing business models and the processes they implement. Because all activities are different, process mining uses the unique data—your company’s business fingerprint—to automatically piece together a digital representation of all your existing business processes.

This digital evidence enables us to visualize exactly how processes are operating (both the conventional path and variable executions) down to individual process instances. In other words, you can unearth processes which lie unseen or dormant, revealing hidden value, and providing an instant understanding of complex processes in minutes rather than days.

Triggering dormant success

Then, with standardized and configurable notifications and KPIs, you can further understand the immediate impact of any process change made—meaning that failure rates decrease, and company confidence is improved. And that’s not all: everyone from new employees to the C-suite can better visualize, understand, and explain their organization’s processes. This ensures that the right process change is secure and that improvement has the intended impact, every time.

Unleash the power of process

In business, we all answer to somebody, and it is critical to connect problems to real solutions. The everyday functions of companies—the processes upon which they are built—are the connection to business tech, from “process” mining to robotic “process” automation. Without process understanding, the tech is redundant because we have no idea how work has flowed in an existing application. Process is the lifeblood of operations.

Process mining: your point of differentiation

Transformative digital technology integration

In addition to the DVA of process mining—discover, visualize, analyze—is the power to monitor real-time process execution automatically from your existing data. This simple point and click assessment can provide an instant understanding of complex processes. Within transformation projects, which by their very nature require the profound transformation of business and organizational activities, processes, competencies, and models, process mining provides the visual map to facilitate immediate action.

This self-sustaining approach across an entire organization is what leads to genuinely sustainable outcomes, and builds a process culture within an organization. By taking this holistic approach, digital transformation and excellence professionals will find it easier to leverage processes, justify their projects and programs, and address behavioral change challenges.

This includes the facilitation of transformative digital technology integration, operational agility and flexibility, leadership and culture, and workforce enablement.

Three ways process mining can save your business in a transformation project:

  • You require 100% operational transparency: To chart all your transactions requires complete process transparency. This capability allows the direct comparison of actual operations to the ways that processes were designed to occur. This conformance checking can automatically identify the highest priority issues and tasks, and highlight root causes, so we can take immediate action.
  • You must reduce costs and increase efficiency: Signavio research shows that almost 60% of companies incurred additional charges from suppliers due to process inefficiencies. Process mining can help your business reduce costs because it finds vulnerabilities and deviations, whilst highlighting what is slowing you down, including the bottlenecks and inefficiencies hampering revenue. Process mining beefs up operational health via process improvements and pre-emptive strategies.
  • You must optimize the buying and selling cycle: Is shipping taking too long? Which of your suppliers supports you least? Who is outperforming whom? Process mining is your one-click trick to finding these answers and identifying which units are performing best and which are wasting time and money.

Process mining and robotic process automation (RPA)

The beneficial fusion of both technologies

Robotic process automation (RPA) provides a virtual workforce to automatize manual, repetitive, and error-prone tasks. However, successful process automation requires exact knowledge about the intended (and potential) benefits, effective training of the robots, and continuous monitoring of their performance. With this, process mining supports organizations throughout the lifecycle of RPA initiatives by monitoring and benchmarking robots to ensure sustainable benefits.

Upgrade robot-led automation

These insights are especially valuable for process miners and managers with a particular interest in process automation. To further upgrade the impact of robot-led automation, there is also a need for a solid understanding of legacy systems, and an overview of automation opportunities. Process mining tools provide critical insights throughout the entire RPA journey, from defining the strategy to continuous improvement and innovation.

 Three ways process mining can save your business in an RPA lifecycle project

  • You require process overviews, based on specific criteria: To provide a complete overview of end-to-end processes, involves the identification of high ROI processes suitable for RPA implementation. This, in turn, helps determine the best-case process flow/path, enabling you to spot redundant processes, which you may not be aware of, before automating.
  • You are unsure how best to optimize human-digital worker cycles: By mining the optimal process flow/path, we can better discover inefficient human-robot hand-off, providing quantifiable data on the financial impact of any digital worker or process. This way, we can compare human vs. digital labor in terms of accuracy, efficiency, cost, and project duration.
  • You need to understand better how RPA supports legacy processes and systems: RPA enables enterprises to keep legacy systems by making integration with cloud and web/app-based services, transforming abilities to connect legacy with modern tools, applications, and even mobile apps. Efficiency and effectiveness will be improved across crucial departments, including HR, finance, and legal.

Process mining for improved customer experience and mapping

Reconfigure customer delight

The integration of process mining with other technologies is also essential in growing the process excellence and management market. With process management, we already talk about customer engagement, which empowers companies to shift away from lopsided efficiency goals, which often frustrate customers, towards all-inclusive effectiveness goals, built around delighting customers at the lowest organizational cost possible.

Further, the application of process mining within customer journey mapping (CJM)—especially when linked to the underlying processes—offers the bundled capability of better business understanding and outside-in customer perspective, connected to the processes that deliver them. So, by connecting process mining with a customer-centric view across producing, marketing, selling, and providing products and services, customer delight becomes a strategic catalyst for success.

Unlock the full potential of process

Trigger process mining initiatives with Signavio Process Intelligence, and see how it can help your organization uncover the hidden value of process, generate fresh ideas, and save time and money. Discover more in our white paper, Managing Successful Process Mining Initiatives with Signavio Process Intelligence.

5 Things You Should Know About Data Mining

The majority of people spend about twenty-four hours online every week. In that time they give out enough information for big data to know a lot about them. Having people collecting and compiling your data might seem scary but it might have been helpful for you in the past.


If you have ever been surprised to find an ad targeted toward something you were talking about earlier or an invention made based on something you were googling, then you already know that data mining can be helpful. Advanced education in data mining can be an awesome resource, so it may pay to have a personal tutor skilled in the area to help you understand. 


It is understandable to be unsure of a system that collects all of the information online so that they can learn more about you. Luckily, so much data is put out every day it is unlikely data mining is focusing on any of your important information. Here are a few statistics you should know about mining.


1. Data Mining Is Used In Crime Scenes

Using a variation of earthquake prediction software and data, the Los Angeles police department and researchers were able to predict crime within five hundred feet. As they learn how to compile and understand more data patterns, crime detecting will become more accurate.


Using their data the Los Angeles police department was able to stop thief activity by thirty-three percent. They were also able to predict violent crime by about twenty-one percent. Those are not perfect numbers, but they are better than before and will get even more impressive as time goes on. 


The fact that data mining is able to pick up on crime statistics and compile all of that data to give an accurate picture of where crime is likely to occur is amazing. It gives a place to look and is able to help stop crime as it starts.


2. Data Mining Helps With Sales

A great story about data mining in sales is the example of Walmart putting beer near the diapers. The story claims that through measuring statistics and mining data it was found that when men purchase diapers they are also likely to buy a pack of beer. Walmart collected that data and put it to good use by putting the beer next to the diapers.


The amount of truth in that story/example is debatable, but it has made data mining popular in most retail stores. Finding which products are often bought together can give insight into where to put products in a store. This practice has increased sales in both items immensely just because people tend to purchase items near one another more than they would if they had to walk to get the second item. 


Putting a lot of stock in the data-gathering teams that big stores build does not always work. There have been plenty of times when data teams failed and sales plummeted. Often, the benefits outweigh the potential failure, however, and many stores now use data mining to make a lot of big decisions about their sales.


3. It’s Helping With Predicting Disease 


In 2009 Google began work to be able to predict the winter flu. Google went through the fifty million most searched words and then compared them with what the CDC was finding during the 2003-2008 flu seasons. With that information google was able to help predict the next winter flu outbreak even down to the states it hit the hardest. 


Since 2009, data mining has gotten much better at predicting disease. Since the internet is a newer invention it is still growing and data mining is still getting better. Hopefully, in the future, we will be able to predict disease breakouts quickly and accurately. 


With new data mining techniques and research in the medical field, there is hope that doctors will be able to narrow down problems in the heart. As the information grows and more data is entered the medical field gets closer to solving problems through data. It is something that is going to help cure diseases more quickly and find the root of a problem.


4. Some Data Mining Gets Ignored

Interestingly, very little of the data that companies collect from you is actually used. “Big data Companies” do not use about eighty-eight percent of the data they have. It is incredibly difficult to use all of the millions of bits of data that go through big data companies every day.


The more people that are used for data mining and the more data companies are actually able to filter through, the better the online experience will be. It might be a bit frightening to think of someone going through what you are doing online, but no one is touching any of the information that you keep private. Big data is using the information you put out into the world and using that data to come to conclusions and make the world a better place.


There is so much information being put onto the internet at all times. Twenty-four hours a week is the average amount of time a single person spends on the internet, but there are plenty of people who spend more time than that. All of that information takes a lot of people to sift through and there are not enough people in the data mining industry to currently actually go through the majority of the data being put online.


5. Too Many Data Mining Jobs

Interestingly, the data industry is booming. In general, there are an amazing amount of careers opening on the internet every day. The industry is growing so quickly that there are not enough people to fill the jobs that are being created.


The lack of talent in the industry means there is plenty of room for new people who want to go into the data mining industry. It was predicted that by 2018 there would be a shortage of 140,000 with deep analytical skills. With the lack of jobs that are being discussed, it is amazing that there is such a shortage in the data industry. 


If big data is only able to wade through less than half of the data being collected then we are wasting a resource. The more people who go into an analytics or computer career the more information we will be able to collect and utilize. There are currently more jobs than there are people in the data mining field and that needs to be corrected.


To Conclude

The data mining industry is making great strides. Big data is trying to use the information they collect to sell more things to you but also to improve the world. Also, there is something very convenient about your computer knowing the type of things you want to buy and showing you them immediately. 


Data mining has been able to help predict crime in Los Angeles and lower crime rates. It has also helped companies know what items are commonly purchased together so that stores can be organized more efficiently. Data mining has even been able to predict the outbreak of disease down to the state.


Even with so much data being ignored and so many jobs left empty, data mining is doing incredible things. The entire internet is constantly growing and the data mining is growing right along with it. As the data mining industry climbs and more people find their careers mining data the more we will learn and the more facts we will find.


Artikelserie: BI Tools im Vergleich – Tableau

Dies ist ein Artikel der Artikel-Serie “BI Tools im Vergleich – Einführung und Motivation“. Solltet ihr gerade erst eingestiegen sein, dann schaut euch ruhig vorher einmal die einführenden Worte und die Ausführungen zur Datenbasis an. Power BI machte den Auftakt und ihr findet den Artikel hier.

Lizenzmodell

Tableau stellt seinen Kunden zu allererst vor die Wahl, wo und von wem die Infrastruktur betrieben werden soll. Einen preislichen Vorteil hat der Kunde bei der Wahl einer selbstverwaltenden Lösung unter Nutzung von Tableau Server. Die Alternative ist eine Cloud-Lösung, bereitgestellt und verwaltet von Tableau. Bei dieser Variante wird Tableau Server durch Tableau Online ersetzt, wobei jede dieser Optionen die gleichen Funktionalitäten mit sich bringen. Bereits das Lizenzmodell definiert unterschiedliche Rollen an Usern, welche in drei verschiedene Lizenztypen unterteilt und unterschiedlich bepreist sind (siehe Grafik). So kann der User die Rolle eines Creators, Explorers oder Viewers einnehmen.Der Creator ist befähigt, alle Funktionen von Tableau zu nutzen, sofern ein Unternehmen die angebotenen Add-ons hinzukauft. Die Lizenz Explorer ermöglicht es dem User, durch den Creator vordefinierte Datasets in Eigenregie zu analysieren und zu visualisieren. Demnach obliegt dem Creator, und somit einer kleinen Personengruppe, die Datenbereitstellung, womit eine Single Source of Truth garantiert werden soll. Der Viewer hat nur die Möglichkeit Berichte zu konsumieren, zu teilen und herunterzuladen. Wobei in Bezug auf Letzteres der Viewer limitiert ist, da dieser nicht die kompletten zugrundeliegenden Daten herunterladen kann. Lediglich eine Aggregation, auf welcher die Visualisierung beruht, kann heruntergeladen werden. Ein Vergleich zeigt die wesentlichen Berechtigungen je Lizenz.
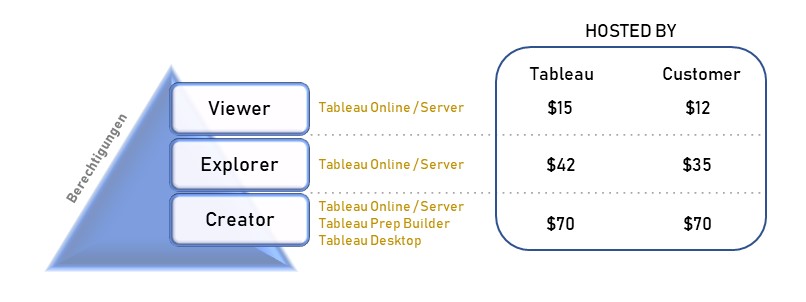
Der Einstieg bei Tableau ist für Organisationen nicht unter 106 Lizenzen (100 Viewer, 5 Explorer, 1 Creator) möglich, und Kosten von mindestens $1445 im Monat müssen einkalkuliert werden.

Wie bereits erwähnt, existieren Leistungserweiterungen, sogennante Add-ons. Die selbstverwaltende Alternative unter Nutzung von Tableau Server (hosted by customer) kann um das Tableau Data Management Add‑on und das Server Management Add‑on erweitert werden. Hauptsächlich zur Serveradministration, Datenverwaltung und -bereitstellung konzipiert sind die Features in vielen Fällen entbehrlich. Für die zweite Alternative (hosted by Tableau) kann der Kunde ebenfalls das Tableau Data Management Add‑on sowie sogenannte Resource Blocks dazu kaufen. Letzteres lässt bereits im Namen einen kapazitätsabhängigen Kostenfaktor vermuten, welcher zur Skalierung dient. Die beiden Add‑ons wiederum erhöhen die Kosten einer jeden Lizenz, was erhebliche Kostensteigerungen mit sich bringen kann. Das Data Management Add‑on soll als Beispiel die Kostenrelevanz verdeutlichen. Es gelten $5,50 je Lizenz für beide Hosting Varianten. Ein Unternehmen bezieht 600 Lizenzen (50 Creator, 150 Explorer und 400 Viewer) und hosted Tableau Server auf einer selbstgewählten Infrastruktur. Beim Zukauf des Add‑ons erhöht sich die einzelne Viewer-Lizenz bei einem Basispreis von $12 um 46%. Eine nicht unrelevante Größe bei der Vergabe neuer Viewer-Lizenzen, womit sich ein jedes Unternehmen mit Wachstumsambitionen auseinandersetzen sollte. Die Gesamtkosten würden nach geschilderter Verteilung der Lizenzen um 24% steigen (Anmerkung: eventuelle Rabatte sind nicht mit einbezogen). Die Tatsache, dass die Zuschläge für alle Lizenzen gelten, kann zumindest kritisch hinterfragt werden.

Ein weiterer, anfangs oft unterschätzter Kostenfaktor ist die Anzahl der Explorer-Lizenzen. Das Verhältnis der Explorer-Lizenzen an der Gesamtanzahl wächst in vielen Fällen mittelfristig nach der Einführungsphase stark an. Häufig wird Tableau als eine neue State of the Art Reporting Lösung mit schönen bunten Bildern betrachtet und dessen eigentliche Stärke, die Generierung von neuen Erkenntnissen mittels Data Discovery, wird unterschätzt. Hier kommt die Explorer Lizenz ins Spiel, welche ca. das Dreifache einer Viewer Lizenz kostet und den User befähigt, tiefer in die Daten einzusteigen.

Nichtdestotrotz kann man behaupten, dass das Lizenzmodell sehr transparent ist. Tableau selbst wirbt damit, dass keine versteckten Kosten auf den Kunden zukommen. Das Lizenzmodell ist aber nicht nur auf die Endkunden ausgerichtet, sondern bietet mit Tableau Server auch ein besonders auf Partner ausgerichtetes Konzept an. Serviceanbieter können so Lizenzen erwerben und in das eigene Angebot zu selbst gewählten Konditionen aufnehmen. Eine Server Instanz reicht aus, da das Produkt auch aus technischer Sicht mit sogenannten Sites auf verschiedene Stakeholder ausgerichtet werden kann.

Community & Features von anderen Entwicklern

Die Bedeutung einer breiten Community soll hier noch einmal hervorgehoben werden. Für Nutzer ist der Austausch über Probleme und Herausforderungen sowie technischer und organisatorischer Art äußerst wichtig, und auch der Softwarehersteller profitiert davon erheblich. Nicht nur, dass der Support teilweise an die eigenen Nutzer abgegeben wird, auch kann der Anbieter bestehende Features zielgerichteter optimieren und neue Features der Nachfrage anpassen. Somit steht die Tableau Community der Power BI Community in nichts nach. Zu den meisten Themen wird man schnell fündig in diversen Foren wie auch auf der Tableau Webseite. Es existiert die klassische Community Plattform, aber auch eine Tableau Besonderheit: Tableau Public. Es handelt sich hierbei um eine kostenlose Möglichkeit eine abgespeckte Version von Tableau zu nutzen und Inhalte auf der gleichnamigen Cloud zu veröffentlichen. Ergänzend sind etliche Lernvideos auf den einschlägigen Seiten fast zu jedem Thema zu finden und komplettieren das Support-Angebot.

Zusätzlich bietet Tableau sogenannte Admin-Tools aus eigenem Hause an, welche als Plug ins eingebunden werden können. Tableau unterscheidet dabei zwischen Community Supported Tools (z.B. TabMon) und Tableau Supported Tools (z.B. Tabcmd).

Ebenfalls bietet Tableau seit der Version 2018.2 dritten Entwicklern eine sogenannte Extensions API an und ermöglicht diesen damit, auf Basis der Tableau-Produkte eigene Produkte zu entwickeln. Erst kürzlich wurde mit Sandboxed Extensions in der Version 2019.4 ein wesentlicher Schritt hin zu einer höheren Datensicherheit gemacht, so dass es zukünftig zwei Gruppen von Erweiterungen geben wird. Die erste und neue Gruppe Sandboxed Extensions beinhaltet alle Erweiterungen, bei denen die Daten das eigene Netzwerk bzw. die Cloud nicht verlassen. Alle übrigen Erweiterungen werden in der zweiten Gruppe Network-Enabled Extensions zusammengefasst. Diese kommunizieren wie gehabt mit der Außenwelt, um den jeweiligen Service bereitzustellen.

Grundsätzlich ist Tableau noch zurückhaltend, wenn es um Erweiterungen des eigenen Produktportfolios geht. Deshalb ist die Liste mit insgesamt 37 Erweiterungen von 19 Anbietern noch recht überschaubar.

Daten laden & transformieren

Bevor der Aufbau der Visualisierungen beginnen kann, müssen die Daten fehlerfrei in Logik und in Homogenität in das Tool geladen werden. Zur Umsetzung dieser Anforderungen bietet sich ein ETL Tool an, und mit der Einführung von Tableau Prep Builder im April 2018 gibt der Softwareentwickler dem Anwender ein entsprechendes Tool an die Hand. Die Umsetzung ist sehr gut gelungen und die Bedienung ist sogar Analysten ohne Kenntnisse von Programmiersprachen möglich. Natürlich verfügen die zur Visualisierung gedachten Tools im Produktsortiment (Tableau Desktop, Server und Online) ebenfalls über (gleiche) Werkzeuge zur Datenmanipulierung. Jedoch verfügt Tableau Prep Builder dank seiner erweiterten Visualisierungen zur Transformation und Zusammenführung von Daten über hervorragende Werkzeuge zur Überprüfung und Analyse der Datengrundlage sowie der eigenen Arbeit.

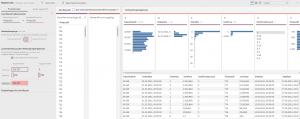
Als Positivbeispiel ist die Visualisierung zu den JOIN-Operationen hervorzuheben, welche dem Anwender auf einen Blick zeigt, wie viele Datensätze vom JOIN betroffen sind und letztendlich auch, wie viele Datensätze in die Output-Tabelle eingeschlossen werden (siehe Grafik).
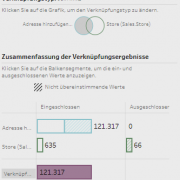
Zur Datenzusammenführung dienen klassische JOIN- und UNION-Befehle und die Logik entspricht den SQL-Befehlen. Das Ziel dabei ist die Generierung einer Extract-Datei und somit einer zweidimensionalen Tabelle für den Bau von Visualisierungen.

Exkurs – Joins in Power BI:

Erst bei der Visualisierung führt Power BI (im Hintergrund) die Daten durch Joins verschiedener Tabellen zusammen, sofern man vorher ein Datenmodell fehlerfrei definiert hat und die Daten nicht bereits mittels Power Query zusammengeführt hat.

Alternativ können auch diverse Datenquellen in das Visualisierungstool geladen und entsprechend des Power BI-Ansatzes Daten zusammengeführt werden. Dieses sogenannte Data Blending rückt seit der Einführung von Tableau Prep Builder immer mehr in den Hintergrund und Tableau führt die User auch hin zu einer weiteren Komponente: Tableau Prep Conductor. Es ist Bestandteil des bereits erwähnten, kostenpflichtigen Tableau Data Management Add-ons und ergänzt die eingeschränkte Möglichkeit, in Tableau Prep Builder automatisierte Aktualisierungen zu planen.

Kalkulationen können, wie auch bei Power BI, teilweise über ein Userinterface (UI) getätigt werden. Jedoch bietet das UI weniger Möglichkeiten, die wirklich komplizierten Berechnungen vorzunehmen, und der User wird schneller mit der von Tableau entwickelten Sprache konfrontiert. Drei Kategorien von Berechnungen werden unterschieden:

  • Einfache Berechnungen
  • Detailgenauigkeits-Ausdrücke (Level of Detail, LOD)
  • Tabellenberechnungen

Es gibt zwei wesentliche Fragestellungen bei der Auswahl der Berechnungsmethode.

1. Was soll berechnet werden? => Detailgenauigkeit?

Diese Frage klingt auf den ersten Blick simpel, kann aber komplexe Ausmaße annehmen. Tableau gibt hierzu aber einen guten Leitfaden für den Start an die Hand.

2. Wann soll berechnet werden?

Die Wahl der Berechnungsmethode hängt auch davon ab, wann welche Berechnung von der Software durchgeführt wird. Die Reihenfolge der Operationen zeigt die folgende Grafik.
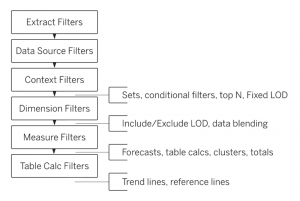
Man braucht einiges an Übung, bis man eine gewisse Selbstsicherheit erlangt hat. Deshalb ist ein strukturiertes Vorgehen für komplexe Vorhaben ratsam.

Daten laden & transformieren: AdventureWorks2017Dataset

Wie bereits im ersten Artikel beschrieben, ist es nicht sehr sinnvoll, ein komplettes Datenmodell in ein BI-Tool zu laden, insbesondere wenn man nur wenige Informationen aus diesem benötigt. Ein für diese Zwecke angepasster View in der Datenbasis wäre aus vielerlei Hinsicht näher an einem Best Practice-Vorgehen. Nicht immer hat man die Möglichkeit, Best Practice im Unternehmen zu leben => siehe Artikel 1 der Serie.

Erst durch die Nutzung von Tableau Prep wurde die komplexe Struktur der Daten deutlich. In Power BI fiel bei der Bereitstellung der Tabellen nicht auf, dass die Adressdaten zu den [Store Contact] nicht in der Tabelle [Adress] zu finden sind. Erst durch die Nutzung von Tableau Prep und einer Analyse zu den Joins, zeigte das Fehlen zuvor genannter Adressen für Stores auf. Weiterhin zeigte die Analyse des Joins von Handelswaren und dazugehöriger Lieferanten auch eine m:n Beziehung auf und somit eine Vervielfachung der Datensätze der output Tabelle.

Kurzum: Tableau Prep ist ein empfehlenswertes Tool, um die Datenbasis schnell zu durchdringen und aufwendige Datenbereitstellungen vorzunehmen.
Daten visualisieren

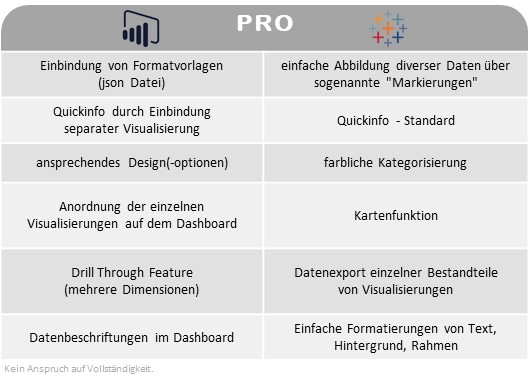
Erwartungsgemäß sind im Vergleich zwischen Tableau und Power BI einige Visualisierungen leichter und andere dagegen schwerer aufzubauen. Grundsätzlich bieten beide Tools einige vorprogrammierte Visualisierungsobjekte an, welche ohne großen Aufwand erstellt werden können. Interessant wird es beim Vergleich der Detailgenauigkeit der Visualisierungen, wobei es nebensächlich ist, ob es sich dabei um ein Balken- oder Liniendiagramm handelt.
Hands on! Dazu lädt Tableau ein, und das ist auch der beste Weg, um sich mit der Software vertraut zu machen. Für einen einfacheren Start sollte man sich mit zwei wesentlichen Konzepten vertraut machen:

Reihenfolge der Operationen

Yep! Wir hatten das Thema bereits. Ein Blick auf die Grafik beim Basteln einzelner Visualisierungen kann helfen! Jeder Creator und Explorer sollte sich vorher mit der Reihenfolge von Operationen vertraut machen. Das Konzept ist nicht selbsterklärend und Fehler fallen nicht sofort auf. Schaut einmal HIER rein! Tableau hat sich eine Stunde Zeit genommen, um das Konzept anhand von Beispielen zu erklären.

Starre Anordnung von Elementen

Visualisierungen werden erst in einem extra Arbeitsblatt entworfen und können mit anderen Arbeitsblättern in einem Dashboard verbaut werden. Die Anordnung der Elemente auf dem Dashboard kann frei erfolgen und/oder Elemente werden in einer Objekthierarchie abgelegt. Letzteres eignet sich gut für den Bau von Vorlagen und ist somit eine Stärke von Tableau. Das Vorgehen dabei ist nicht trivial, das heißt ein saloppes Reinschmeißen von Visualisierungen führt definitiv nicht zum Ziel.
Tim erklärt ziemlich gut, wie man vorgehen kann => HIER.

Tableau ist aus der Designperspektive limitiert, weshalb das Endergebnis, das Dashboard,  nicht selten sehr eckig und kantig aussieht. Einfache visuelle Anpassungen wie abgerundete Kanten von Arbeitsblättern/Containern sind nicht möglich. Designtechnisch hat Tableau daher noch Luft nach oben!

Fazit

Der Einstieg für kleine Unternehmen mit Tableau ist nur unter sehr hohem Kostenaufwand möglich, aufgrund von preisintensiven Lizenzen und einer Mindestabnahme an Lizenzen. Aber auch bei einem hohen Bedarf an Lizenzen befindet sich Tableau im höheren Preissegment. Jedoch beinhalten Tableaus Lizenzgebühren bereits Kosten, welche bei der Konkurrenz erst durch die Nutzung ersichtlich werden, da bei ihnen die Höhe der Kosten stärker von der beanspruchten Kapazität abhängig ist. Tableau bietet seinen Kunden damit eine hohe Transparenz über ein zwar preisintensives, aber sehr ausgereiftes Produktportfolio.

Tableau legt mit einer lokalen Option, welche die gleichen Funktionalitäten beinhaltet wie die cloudbasierte Alternative, ein Augenmerk auf Kunden mit strengen Data Governance-Richtlinien. Sandboxed Extensions sind ein weiteres Beispiel für das Bewusstsein für eine hohe Datensicherheit. Jedoch ist das Angebot an Extensions, also das Angebot dritter Entwickler, ausbaufähig. Eine breit aufgestellte Community bietet nicht nur dritten Entwicklern eine gute Geschäftsgrundlage, sondern auch Nutzern zu fast jedem Thema eine Hilfestellung.

Tableau Prep Builder => TOP!

Mit diesem Tool kann die Datengrundlage super einfach analysiert werden und Datenmanipulationen sind einfach durchzuführen. Die Syntax und die Verwendung von Berechnungen bedarf einiger Übung, aber wenn man die wesentlichen Konzepte verstanden hat, dann sind Berechnungen schnell erstellt.

Ein Dashboard kann zu 90 % in fast jedem Tool gleich aussehen. Der Weg dorthin ist oft ein anderer und je nach Anforderung bei einem Tool leichter als bei einem anderen. Tableau bietet ein komplexes Konzept, sodass auch die außergewöhnlichsten Anforderungen erfüllt werden können. Jedoch ist das zugrundliegende Design oft sehr kantig und nicht immer zeitgemäß.

Fortsetzung folgt… MicroStrategy

Python vs R: Which Language to Choose for Deep Learning?

Data science is increasingly becoming essential for every business to operate efficiently in this modern world. This influences the processes composed together to obtain the required outputs for clients. While machine learning and deep learning sit at the core of data science, the concepts of deep learning become essential to understand as it can help increase the accuracy of final outputs. And when it comes to data science, R and Python are the most popular programming languages used to instruct the machines.

Python and R: Primary Languages Used for Deep Learning

Deep learning and machine learning differentiate based on the input data type they use. While machine learning depends upon the structured data, deep learning uses neural networks to store and process the data during the learning. Deep learning can be described as the subset of machine learning, where the data to be processed is defined in another structure than a normal one.

R is developed specifically to support the concepts and implementation of data science and hence, the support provided by this language is incredible as writing codes become much easier with its simple syntax.

Python is already much popular programming language that can serve more than one development niche without straining even for a bit. The implementation of Python for programming machine learning algorithms is very much popular and the results provided are accurate and faster than any other language. (C or Java). And because of its extended support for data science concept implementation, it becomes a tough competitor for R.

However, if we compare the charts of popularity, Python is obviously more popular among data scientists and developers because of its versatility and easier usage during algorithm implementation. However, R outruns Python when it comes to the packages offered to developers specifically expertise in R over Python. Therefore, to conclude which one of them is the best, let’s take an overview of the features and limits offered by both languages.

Python

Python was first introduced by Guido Van Rossum who developed it as the successor of ABC programming language. Python puts white space at the center while increasing the readability of the developed code. It is a general-purpose programming language that simply extends support for various development needs.

The packages of Python includes support for web development, software development, GUI (Graphical User Interface) development and machine learning also. Using these packages and putting the best development skills forward, excellent solutions can be developed. According to Stackoverflow, Python ranks at the fourth position as the most popular programming language among developers.

Benefits for performing enhanced deep learning using Python are:

  • Concise and Readable Code
  • Extended Support from Large Community of Developers
  • Open-source Programming Language
  • Encourages Collaborative Coding
  • Suitable for small and large-scale products

The latest and stable version of Python has been released as Python 3.8.0 on 14th October 2019. Developing a software solution using Python becomes much easier as the extended support offered through the packages drives better development and answers every need.

R

R is a language specifically used for the development of statistical software and for statistical data analysis. The primary user base of R contains statisticians and data scientists who are analyzing data. Supported by R Foundation for statistical computing, this language is not suitable for the development of websites or applications. R is also an open-source environment that can be used for mining excessive and large amounts of data.

R programming language focuses on the output generation but not the speed. The execution speed of programs written in R is comparatively lesser as producing required outputs is the aim not the speed of the process. To use R in any development or mining tasks, it is required to install its operating system specific binary version before coding to run the program directly into the command line.

R also has its own development environment designed and named RStudio. R also involves several libraries that help in crafting efficient programs to execute mining tasks on the provided data.

The benefits offered by R are pretty common and similar to what Python has to offer:

  • Open-source programming language
  • Supports all operating systems
  • Supports extensions
  • R can be integrated with many of the languages
  • Extended Support for Visual Data Mining

Although R ranks at the 17th position in Stackoverflow’s most popular programming language list, the support offered by this language has no match. After all, the R language is developed by statisticians for statisticians!

Python vs R: Should They be Really Compared?

Even when provided with the best technical support and efficient tools, a developer will not be able to provide quality outputs if he/she doesn’t possess the required skills. The point here is, technical skills rank higher than the resources provided. A comparison of these two programming languages is not advisable as they both hold their own set of advantages. However, the developers considering to use both together are less but they obtain maximum benefit from the process.

Both these languages have some features in common. For example, if a representative comes asking you if you lend technical support for developing an uber clone, you are directly going to decline as Python and R both do not support mobile app development. To benefit the most and develop excellent solutions using both these programming languages, it is advisable to stop comparing and start collaborating!

R and Python: How to Fit Both In a Single Program

Anticipating the future needs of the development industry, there has been a significant development to combine these both excellent programming languages into one. Now, there are two approaches to performing this: either we include R script into Python code or vice versa.

Using the available interfaces, packages and extended support from Python we can include R script into the code and enhance the productivity of Python code. Availability of PypeR, pyRserve and more resources helps run these two programming languages efficiently while efficiently performing the background work.

Either way, using the developed functions and packages made available for integrating Python in R are also effective at providing better results. Available R packages like rJython, rPython, reticulate, PythonInR and more, integrating Python into R language is very easy.

Therefore, using the development skills at their best and maximizing the use of such amazing resources, Python and R can be togetherly used to enhance end results and provide accurate deep learning support.

Conclusion

Python and R both are great in their own names and own places. However, because of the wide applications of Python in almost every operation, the annual packages offered to Python developers are less than the developers skilled in using R. However, this doesn’t justify the usability of R. The ultimate decision of choosing between these two languages depends upon the data scientists or developers and their mining requirements.

And if a developer or data scientist decides to develop skills for both- Python and R-based development, it turns out to be beneficial in the near future. Choosing any one or both to use in your project depends on the project requirements and expert support on hand.

Looking for the ‘aha moment’: An expert’s insights on process mining

Henny Selig is a specialist in process mining, with significant expertise in the implementation of process mining solutions and supporting customers with process analysis. As a Solution Owner at Signavio, Henny is also well versed in bringing Signavio Process Intelligence online for businesses of all shapes and sizes. In this interview, Henny shares her thoughts about the challenges and opportunities of process mining. 


Read this interview in German:

Im Interview mit Henny Selig zu Process Mining: “Für den Kunden sind solche Aha-Momente toll“


Henny, could you give a simple explanation of the concept of process mining?

Basically, process mining is a combination of data analysis and business process management. IT systems support almost every business process, meaning they leave behind digital traces. We extrapolate all the data from the IT systems connected to a particular process, then visualize and evaluate it with the help of data science technology.

In short, process mining builds a bridge between employees, process experts and management, allowing for a data-driven and fact-based approach to business process optimization. This helps avoid thinking in siloes, as well as enabling transparent design of handovers and process steps that cross departmental boundaries within an organization.

When a business starts to analyze their process data, what are the sorts of questions they ask? Do they have at least have some expectation about what process mining can offer?

That’s a really good question! There isn’t really a single good answer to it, as it is different for different companies. For example, there was one procurement manager, and we were presenting the complete data set to him, and it turned out there was an approval at one point, but it should have been at another. He was really surprised, but we weren’t, because we sat outside the process itself and were able to take a broader view. 

We also had different questions that the company hadn’t considered, things like what was the process flow if an order amount is below 1000 euros, and how often that occurs—just questions that seem clear to an outsider but often do not occur to process owners.

So do people typically just have an idea that something is wrong, or do they generally understand there is a specific problem in one area, and they want to dive deeper? 

There are those people who know that a process is running well, but they know a particular problem pops up repeatedly. Usually, even if people say they don’t have a particular focus or question, most of them actually do because they know their area. They already have some assumptions and ideas, but it is sometimes so deep in their mind they can’t actually articulate it.

Often, if you ask people directly how they do things, it can put pressure on them, even if that’s not the intention. If this happens, people may hide things without meaning to, because they already have a feeling that the process or workflow they are describing is not perfect, and they want to avoid blame. 

The approvals example I mentioned above is my favorite because it is so simple. We had a team who all said, over and over, “We don’t approve this type of request.” However, the data said they did–the team didn’t even know. 

We then talked to the manager, who was interested in totally different ideas, like all these risks, approvals, are they happening, how many times this, how many times that — the process flow in general. Just by having this conversation, we were able to remove the mismatch between management and the team, and that is before we even optimized the actual process itself. 

So are there other common issues or mismatches that people should be aware of when beginning their process mining initiative?

The one I often return to is that not every variation that is out of line with the target model is necessarily negative. Very few processes, apart from those that run entirely automatically, actually conform 100% to the intended process model—even when the environment is ideal. For this reason, there will always be exceptions requiring a different approach. This is the challenge in projects: finding out which variations are desirable, and where to make necessary exceptions.

So would you say that data-based process analysis is a team effort?

Absolutely! In every phase of a process mining project, all sorts of project members are included. IT makes the data available and helps with the interpretation of the data. Analysts then carry out the analysis and discuss the anomalies they find with IT, the process owners, and experts from the respective departments. Sometimes there are good reasons to explain why a process is behaving differently than expected. 

In this discussion, it is incredibly helpful to document the thought process of the team with technical means, such as Signavio Process Intelligence. In this way, it is possible to break down the analysis into individual processes and to bring the right person into the discussion at the right point without losing the thread of the discussion. Then, the next colleague who picks up the topic can then see the thread of the analysis and properly classify the results.

At the very least, we can provide some starting points. Helping people reach an “aha moment” is one of the best parts of my job!

To find out more about how process mining can help you understand and optimize your business processes, visit the Signavio Process Intelligence product page. If you would like to get a group effort started in your organization right now, why not sign up for a free 30-day trial with Signavio, today.

Wie der C++-Programmierer bei der Analyse großer Datenmengen helfen kann

Die Programmiersprache C wurde von Dennis Ritchie in den Bell Labs in einer Zeit (1969-1973) entwickelt, als jeder CPU-Zyklus und jeder Byte Speicher sehr teuer war. Aus diesem Grund wurde C (und später C++) so konzipiert, dass die maximale Leistung der Hardware mit der Sprachkomplexität erzielt werden konnte. Derzeit ist der C++ Programmierer besonders begehrt auf dem Arbeitsmarkt, für ganz bestimmte Abläufe, die wir später genauer beschreiben werden.

Warum sollten Sie einen C++ Entwickler mieten, wenn es um große Daten geht?

C++ ermöglicht, als Sprache auf einem niedrigen Level, eine Feinabstimmung der Leistung der Anwendung in einer Weise, die bei der Verwendung von Sprachen auf einem hohen Level nicht möglich ist. Warum sollten Sie einen C++ Entwickler mieten? C++ bietet den Entwicklern eine viel bessere Kontrolle über den Systemspeicher und die Ressourcen, als die der C Programmierer oder Anderer.

C++ ist die einzige Sprache, in der man Daten mit mehr als 1 GB pro Sekunde knacken, die prädiktive Analyse in Echtzeit neu trainieren und anwenden und vierstellige QPS einer REST-ful API in der Produktion bedienen kann, während die [eventuelle] Konsistenz des Aufzeichnungssystems ständig erhalten bleibt. Auf einem einzigen Server, natürlich aus Gründen der Zuverlässigkeit dupliziert, aber das, ohne in Repliken, Sharding und das Auffüllen und Wiederholen von persistenten Nachrichtenwarteschlangen investieren zu. Für ein groß angelegtes Werbesystem, dynamischen Lastausgleich oder eine hocheffiziente adaptive Caching-Schicht ist C++ die klügste Wahl.

Die allgemeine Vorstellung ist, dass R und Python schneller sind, aber das ist weit von der Wahrheit entfernt. Ein gut optimierter C++-Code könnte hundertmal schneller laufen, als das gleiche Stück Code, das in Python oder R geschrieben wurde. Die einzige Herausforderung bei C++ ist die Menge an Arbeit, die Sie bewältigen müssen, um die fertigen Funktionen zum Laufen zu bringen. Sie müssen wissen, wie man Zeiger verteilt und verwaltet – was ehrlich gesagt ein wenig kompliziert sein kann. Die C# Programmierer Ausbildung ist aus diesem Grunde z.Z. sehr begehrt.

R und Python

Akademiker und Statistiker haben R über zwei Jahrzehnte entwickelt. R verfügt nun über eines der reichsten Ökosysteme, um Datenanalysen durchzuführen. Es sind etwa 12000 Pakete in CRAN (Open-Source-Repository) verfügbar. Es ist möglich, eine Bibliothek zu finden, für was auch immer für eine Analyse Sie durchführen möchten. Die reiche Vielfalt der Bibliothek macht R zur ersten Wahl für statistische Analysen, insbesondere für spezialisierte analytische Arbeiten.

Python kann so ziemlich die gleichen Aufgaben wie R erledigen: Data Wrangling, Engineering, Feature Selection Web Scrapping, App und so weiter. Python ist ein Werkzeug, um maschinelles Lernen in großem Maßstab einzusetzen und zu implementieren. Python-Codes sind einfacher zu warten und robuster als R. Vor Jahren hatte Python nicht viele Bibliotheken für Datenanalyse und maschinelles Lernen. In letzter Zeit holt Python auf und bietet eine hochmoderne API für maschinelles Lernen oder künstliche Intelligenz. Der größte Teil der datenwissenschaftlichen Arbeit kann mit fünf Python-Bibliotheken erledigt werden: Numpy, Pandas, Scipy, Scikit-Learning und Seaborn.

Aber das Wissen, mit Zeigern zu arbeiten oder den Code in C++ zu verwalten, ist mit einem hohen Preis verbunden. Aus diesem Grunde werden C++ Programmierer gesucht, für die Bewältigung von großen Datenpaketen. Ein tiefer Einblick in das Innenleben der Anwendung ermöglicht es ihnen, die Anwendung im Falle von Fehlern besser zu debuggen und sogar Funktionen zu erstellen, die eine Kontrolle des Systems auf Mikroebene erfordern. Schauen Sie sich doch nach C# Entwickler in Berlin um, denn sie haben einen besonders guten Ruf unter den neuen Entwicklern.

Das Erlernen der Programmierung ist eine wesentliche Fähigkeit im Arsenal der Analysten von Big Data. Analysten müssen kodieren, um numerische und statistische Analysen mit großen Datensätzen durchzuführen. Einige der Sprachen, in deren Erlernen auch die C Entwickler Zeit und Geld investieren sollten, sind unter anderem Python, R, Java und C++. Je mehr sie wissen, desto besser – Programmierer sollten immer daran denken, dass sie nicht nur eine einzelne Sprache lernen sollten. C für Java Programmierer sollte ein MUSS sein.

Wo wird das C++ Programmieren eingesetzt?

Die Programmiersprache C++ ist eine etablierte Sprache mit einem großen Satz von Bibliotheken und Tools, die bereit ist, große Datenanwendungen und verteilte Systeme zu betreiben. In den meisten Fällen wird C++ zum Schreiben von Frameworks und Paketen für große Daten verwendet. Diese Programmiersprache bietet auch eine Reihe von Bibliotheken, die beim Schreiben von Algorithmen für das tiefe Lernen helfen. Mit ausreichenden C++-Kenntnissen ist es möglich, praktisch unbegrenzte Funktionen auszuführen. Dennoch ist C++ nicht die Sprache, die man leicht erlernen kann, da man die über 1000 Seiten Spezifikation und fast 100 Schlüsselwörter beherrschen muss.

Die Verwendung von C++ ermöglicht die prozedurale Programmierung für intensive Funktionen der CPU und die Kontrolle über die Hardware, und diese Sprache ist sehr schnell, weshalb sie bei der Entwicklung verschiedener Spiele oder in Spielmaschinen weit verbreitet ist.

C++ bietet viele Funktionen, die anderen Sprachen fehlen. Darüber hinaus bietet die Sprache auch Zugang zu umfangreichen Vorlagen, die es Ihnen ermöglichen, generische Codes zu schreiben. Als betroffenes Unternehmen sollten Sie sich deshalb tatsächlich überlegen, einen C++ Programmierer zu suchen oder in einen Kurs von C++ für Ihren C Programmierer zu investieren. Am Ende lohnen sich bestimmt diese Kosten.

Und vergessen Sie nicht: C++ ist die einzige Sprache, die in der Lage ist, 1 GB+ Daten in weniger als einer Sekunde zu verarbeiten. Darüber hinaus können Sie Ihr Modell neu trainieren und prädiktive Analysen in Echtzeit und sogar die Konsistenz der Systemaufzeichnung anwenden. Diese Gründe machen C++ zu einer bevorzugten Wahl für Sie, wenn Sie einen Datenwissenschaftler für Ihr Unternehmen suchen.

Beispiele für die Verwendung von C++

Die Verwendung von C++ zur Entwicklung von Anwendungen und vielen produktbasierten Programmen, die in dieser Sprache entwickelt wurden, hat mehrere Vorteile, die nur auf ihren Eigenschaften und ihrer Sicherheit beruhen. Unten finden Sie eine Liste der häufigsten Anwendungen von C++.

  • Google-Anwendungen – Einige der Google-Anwendungen sind auch in C++ geschrieben, darunter das Google-Dateisystem und der Google-Chromium-Browser sowie MapReduce für die Verarbeitung großer Clusterdaten. Die Open-Source-Gemeinschaft von Google hat über 2000 Projekte, von denen viele in den Programmiersprachen C oder C++ geschrieben und bei GitHub frei verfügbar sind.
  • Mozilla Firefox und Thunderbird – Der Mozilla-Internetbrowser Firefox und der E-Mail-Client Thunderbird sind beide in der Programmiersprache C++ geschrieben, und sie sind ebenfalls Open-Source-Projekte. Der C++-Quellcode dieser Anwendungen ist in den MDN-Webdokumenten zu finden.
  • Adobe-Systeme – Die meisten der wichtigsten Anwendungen von Adobe-Systemen werden in der Programmiersprache C++ entwickelt. Zu diesen Anwendungen gehören Adobe Photoshop und Image Ready, Illustrator und Adobe Premier. Sie haben in der Vergangenheit eine Menge Open-Source-Codes veröffentlicht, immer in C++, und ihre Entwickler waren in der C++-Community aktiv.
  • 12D-Lösungen – 12D Solutions Pty Ltd ist ein australischer Softwareentwickler, der sich auf Anwendungen im Bereich Bauwesen und Vermessung spezialisiert hat. Computer Aided Design-System für Vermessung, Bauwesen und mehr. Zu den Kunden von 12D Solutions gehören Umweltberater, Berater für Bau- und Wasserbau, lokale, staatliche und nationale Regierungsabteilungen und -behörden, Vermessungsingenieure, Forschungsinstitute, Bauunternehmen und Bergbau-Berater.
  • In C/C++ geschriebene Betriebssysteme

Apple – Betriebssystem OS XApple – Betriebssystem OS X

Einige Teile von Apple OS X sind in der Programmiersprache C++ geschrieben. Auch einige Anwendungen für den iPod sind in C++ geschrieben.

Microsoft-BetriebssystemeMicrosoft-Betriebssysteme

Der Großteil der Software wird buchstäblich mit verschiedenen Varianten von Visual C++ oder einfach C++ entwickelt. Die meisten der großen Anwendungen wie Windows 95, 98, Me, 200 und XP sind ebenfalls in C++ geschrieben. Auch Microsoft Office, Internet Explorer und Visual Studio sind in Visual C++ geschrieben.

  • Betriebssystem Symbian – Auch Symbian OS wird mit C++ entwickelt. Dies war eines der am weitesten verbreiteten Betriebssysteme für Mobiltelefone.

Die Einstellung eines C- oder C++-Entwicklers kann eine gute Investition in Ihr Projekt-Upgrade sein

Normalerweise benötigen C- und C++-Anwendungen weniger Strom, Speicher und Platz als die Sprachen der virtuellen Maschinen auf hoher Ebene. Dies trägt dazu bei, den Kapitalaufwand, die Betriebskosten und sogar die Kosten für die Serverfarm zu reduzieren. Hier zeigt sich, dass C++ die Gesamtentwicklungskosten erheblich reduziert.

Trotz der Tatsache, dass wir eine Reihe von Tools und Frameworks nur für die Verwaltung großer Daten und die Arbeit an der Datenwissenschaft haben, ist es wichtig zu beachten, dass auf all diesen modernen Frameworks eine Schicht einer niedrigen Programmiersprache – wie C++ – aufgesetzt ist. Die Niedrigsprachen sind für die tatsächliche Ausführung des dem Framework zugeführten Hochsprachencodes verantwortlich. Es ist also ratsam in ein C-Entwickler-Gehalt zu investieren.

Der Grund dafür, dass C++ ein so unverzichtbares Werkzeug ist, liegt darin, dass es nicht nur einfach, sondern auch extrem leistungsfähig ist und zu den schnellsten Sprachen auf dem Markt gehört. Darüber hinaus verfügt ein gut geschriebenes Programm in C++ über ein komplexes Wissen und Verständnis der Architektur der Maschine, sowie der Speicherzugriffsmuster und kann schneller laufen als andere Programme. Es wird Ihrem Unternehmen Zeit- und Stromkosten sparen.

Zum Abschluss eine Grafik, die Sie als Unternehmer interessieren wird und die das Verhältnis von der Performance and der Sicherheit diverser Sprachen darstellt:

Aus diesen und weiteren Gründen neigen viele Unternehmensentwickler und Datenwissenschaftler mit massiven Anforderungen an Skalierbarkeit und Leistung zu dem guten alten C++. Viele Organisationen, die Python oder andere Hochsprachen für die Datenanalyse und Erkundungsaufgaben verwenden, verlassen sich auf C++, um Programme zu entwickeln, die diese Daten an die Kunden weiterleiten – in Echtzeit.