5 Things You Should Know About Data Mining

The majority of people spend about twenty-four hours online every week. In that time they give out enough information for big data to know a lot about them. Having people collecting and compiling your data might seem scary but it might have been helpful for you in the past.


If you have ever been surprised to find an ad targeted toward something you were talking about earlier or an invention made based on something you were googling, then you already know that data mining can be helpful. Advanced education in data mining can be an awesome resource, so it may pay to have a personal tutor skilled in the area to help you understand. 


It is understandable to be unsure of a system that collects all of the information online so that they can learn more about you. Luckily, so much data is put out every day it is unlikely data mining is focusing on any of your important information. Here are a few statistics you should know about mining.


1. Data Mining Is Used In Crime Scenes

Using a variation of earthquake prediction software and data, the Los Angeles police department and researchers were able to predict crime within five hundred feet. As they learn how to compile and understand more data patterns, crime detecting will become more accurate.


Using their data the Los Angeles police department was able to stop thief activity by thirty-three percent. They were also able to predict violent crime by about twenty-one percent. Those are not perfect numbers, but they are better than before and will get even more impressive as time goes on. 


The fact that data mining is able to pick up on crime statistics and compile all of that data to give an accurate picture of where crime is likely to occur is amazing. It gives a place to look and is able to help stop crime as it starts.


2. Data Mining Helps With Sales

A great story about data mining in sales is the example of Walmart putting beer near the diapers. The story claims that through measuring statistics and mining data it was found that when men purchase diapers they are also likely to buy a pack of beer. Walmart collected that data and put it to good use by putting the beer next to the diapers.


The amount of truth in that story/example is debatable, but it has made data mining popular in most retail stores. Finding which products are often bought together can give insight into where to put products in a store. This practice has increased sales in both items immensely just because people tend to purchase items near one another more than they would if they had to walk to get the second item. 


Putting a lot of stock in the data-gathering teams that big stores build does not always work. There have been plenty of times when data teams failed and sales plummeted. Often, the benefits outweigh the potential failure, however, and many stores now use data mining to make a lot of big decisions about their sales.


3. It’s Helping With Predicting Disease 


In 2009 Google began work to be able to predict the winter flu. Google went through the fifty million most searched words and then compared them with what the CDC was finding during the 2003-2008 flu seasons. With that information google was able to help predict the next winter flu outbreak even down to the states it hit the hardest. 


Since 2009, data mining has gotten much better at predicting disease. Since the internet is a newer invention it is still growing and data mining is still getting better. Hopefully, in the future, we will be able to predict disease breakouts quickly and accurately. 


With new data mining techniques and research in the medical field, there is hope that doctors will be able to narrow down problems in the heart. As the information grows and more data is entered the medical field gets closer to solving problems through data. It is something that is going to help cure diseases more quickly and find the root of a problem.


4. Some Data Mining Gets Ignored

Interestingly, very little of the data that companies collect from you is actually used. “Big data Companies” do not use about eighty-eight percent of the data they have. It is incredibly difficult to use all of the millions of bits of data that go through big data companies every day.


The more people that are used for data mining and the more data companies are actually able to filter through, the better the online experience will be. It might be a bit frightening to think of someone going through what you are doing online, but no one is touching any of the information that you keep private. Big data is using the information you put out into the world and using that data to come to conclusions and make the world a better place.


There is so much information being put onto the internet at all times. Twenty-four hours a week is the average amount of time a single person spends on the internet, but there are plenty of people who spend more time than that. All of that information takes a lot of people to sift through and there are not enough people in the data mining industry to currently actually go through the majority of the data being put online.


5. Too Many Data Mining Jobs

Interestingly, the data industry is booming. In general, there are an amazing amount of careers opening on the internet every day. The industry is growing so quickly that there are not enough people to fill the jobs that are being created.


The lack of talent in the industry means there is plenty of room for new people who want to go into the data mining industry. It was predicted that by 2018 there would be a shortage of 140,000 with deep analytical skills. With the lack of jobs that are being discussed, it is amazing that there is such a shortage in the data industry. 


If big data is only able to wade through less than half of the data being collected then we are wasting a resource. The more people who go into an analytics or computer career the more information we will be able to collect and utilize. There are currently more jobs than there are people in the data mining field and that needs to be corrected.


To Conclude

The data mining industry is making great strides. Big data is trying to use the information they collect to sell more things to you but also to improve the world. Also, there is something very convenient about your computer knowing the type of things you want to buy and showing you them immediately. 


Data mining has been able to help predict crime in Los Angeles and lower crime rates. It has also helped companies know what items are commonly purchased together so that stores can be organized more efficiently. Data mining has even been able to predict the outbreak of disease down to the state.


Even with so much data being ignored and so many jobs left empty, data mining is doing incredible things. The entire internet is constantly growing and the data mining is growing right along with it. As the data mining industry climbs and more people find their careers mining data the more we will learn and the more facts we will find.


Python vs R: Which Language to Choose for Deep Learning?

Data science is increasingly becoming essential for every business to operate efficiently in this modern world. This influences the processes composed together to obtain the required outputs for clients. While machine learning and deep learning sit at the core of data science, the concepts of deep learning become essential to understand as it can help increase the accuracy of final outputs. And when it comes to data science, R and Python are the most popular programming languages used to instruct the machines.

Python and R: Primary Languages Used for Deep Learning

Deep learning and machine learning differentiate based on the input data type they use. While machine learning depends upon the structured data, deep learning uses neural networks to store and process the data during the learning. Deep learning can be described as the subset of machine learning, where the data to be processed is defined in another structure than a normal one.

R is developed specifically to support the concepts and implementation of data science and hence, the support provided by this language is incredible as writing codes become much easier with its simple syntax.

Python is already much popular programming language that can serve more than one development niche without straining even for a bit. The implementation of Python for programming machine learning algorithms is very much popular and the results provided are accurate and faster than any other language. (C or Java). And because of its extended support for data science concept implementation, it becomes a tough competitor for R.

However, if we compare the charts of popularity, Python is obviously more popular among data scientists and developers because of its versatility and easier usage during algorithm implementation. However, R outruns Python when it comes to the packages offered to developers specifically expertise in R over Python. Therefore, to conclude which one of them is the best, let’s take an overview of the features and limits offered by both languages.

Python

Python was first introduced by Guido Van Rossum who developed it as the successor of ABC programming language. Python puts white space at the center while increasing the readability of the developed code. It is a general-purpose programming language that simply extends support for various development needs.

The packages of Python includes support for web development, software development, GUI (Graphical User Interface) development and machine learning also. Using these packages and putting the best development skills forward, excellent solutions can be developed. According to Stackoverflow, Python ranks at the fourth position as the most popular programming language among developers.

Benefits for performing enhanced deep learning using Python are:

  • Concise and Readable Code
  • Extended Support from Large Community of Developers
  • Open-source Programming Language
  • Encourages Collaborative Coding
  • Suitable for small and large-scale products

The latest and stable version of Python has been released as Python 3.8.0 on 14th October 2019. Developing a software solution using Python becomes much easier as the extended support offered through the packages drives better development and answers every need.

R

R is a language specifically used for the development of statistical software and for statistical data analysis. The primary user base of R contains statisticians and data scientists who are analyzing data. Supported by R Foundation for statistical computing, this language is not suitable for the development of websites or applications. R is also an open-source environment that can be used for mining excessive and large amounts of data.

R programming language focuses on the output generation but not the speed. The execution speed of programs written in R is comparatively lesser as producing required outputs is the aim not the speed of the process. To use R in any development or mining tasks, it is required to install its operating system specific binary version before coding to run the program directly into the command line.

R also has its own development environment designed and named RStudio. R also involves several libraries that help in crafting efficient programs to execute mining tasks on the provided data.

The benefits offered by R are pretty common and similar to what Python has to offer:

  • Open-source programming language
  • Supports all operating systems
  • Supports extensions
  • R can be integrated with many of the languages
  • Extended Support for Visual Data Mining

Although R ranks at the 17th position in Stackoverflow’s most popular programming language list, the support offered by this language has no match. After all, the R language is developed by statisticians for statisticians!

Python vs R: Should They be Really Compared?

Even when provided with the best technical support and efficient tools, a developer will not be able to provide quality outputs if he/she doesn’t possess the required skills. The point here is, technical skills rank higher than the resources provided. A comparison of these two programming languages is not advisable as they both hold their own set of advantages. However, the developers considering to use both together are less but they obtain maximum benefit from the process.

Both these languages have some features in common. For example, if a representative comes asking you if you lend technical support for developing an uber clone, you are directly going to decline as Python and R both do not support mobile app development. To benefit the most and develop excellent solutions using both these programming languages, it is advisable to stop comparing and start collaborating!

R and Python: How to Fit Both In a Single Program

Anticipating the future needs of the development industry, there has been a significant development to combine these both excellent programming languages into one. Now, there are two approaches to performing this: either we include R script into Python code or vice versa.

Using the available interfaces, packages and extended support from Python we can include R script into the code and enhance the productivity of Python code. Availability of PypeR, pyRserve and more resources helps run these two programming languages efficiently while efficiently performing the background work.

Either way, using the developed functions and packages made available for integrating Python in R are also effective at providing better results. Available R packages like rJython, rPython, reticulate, PythonInR and more, integrating Python into R language is very easy.

Therefore, using the development skills at their best and maximizing the use of such amazing resources, Python and R can be togetherly used to enhance end results and provide accurate deep learning support.

Conclusion

Python and R both are great in their own names and own places. However, because of the wide applications of Python in almost every operation, the annual packages offered to Python developers are less than the developers skilled in using R. However, this doesn’t justify the usability of R. The ultimate decision of choosing between these two languages depends upon the data scientists or developers and their mining requirements.

And if a developer or data scientist decides to develop skills for both- Python and R-based development, it turns out to be beneficial in the near future. Choosing any one or both to use in your project depends on the project requirements and expert support on hand.

Wie der C++-Programmierer bei der Analyse großer Datenmengen helfen kann

Die Programmiersprache C wurde von Dennis Ritchie in den Bell Labs in einer Zeit (1969-1973) entwickelt, als jeder CPU-Zyklus und jeder Byte Speicher sehr teuer war. Aus diesem Grund wurde C (und später C++) so konzipiert, dass die maximale Leistung der Hardware mit der Sprachkomplexität erzielt werden konnte. Derzeit ist der C++ Programmierer besonders begehrt auf dem Arbeitsmarkt, für ganz bestimmte Abläufe, die wir später genauer beschreiben werden.

Warum sollten Sie einen C++ Entwickler mieten, wenn es um große Daten geht?

C++ ermöglicht, als Sprache auf einem niedrigen Level, eine Feinabstimmung der Leistung der Anwendung in einer Weise, die bei der Verwendung von Sprachen auf einem hohen Level nicht möglich ist. Warum sollten Sie einen C++ Entwickler mieten? C++ bietet den Entwicklern eine viel bessere Kontrolle über den Systemspeicher und die Ressourcen, als die der C Programmierer oder Anderer.

C++ ist die einzige Sprache, in der man Daten mit mehr als 1 GB pro Sekunde knacken, die prädiktive Analyse in Echtzeit neu trainieren und anwenden und vierstellige QPS einer REST-ful API in der Produktion bedienen kann, während die [eventuelle] Konsistenz des Aufzeichnungssystems ständig erhalten bleibt. Auf einem einzigen Server, natürlich aus Gründen der Zuverlässigkeit dupliziert, aber das, ohne in Repliken, Sharding und das Auffüllen und Wiederholen von persistenten Nachrichtenwarteschlangen investieren zu. Für ein groß angelegtes Werbesystem, dynamischen Lastausgleich oder eine hocheffiziente adaptive Caching-Schicht ist C++ die klügste Wahl.

Die allgemeine Vorstellung ist, dass R und Python schneller sind, aber das ist weit von der Wahrheit entfernt. Ein gut optimierter C++-Code könnte hundertmal schneller laufen, als das gleiche Stück Code, das in Python oder R geschrieben wurde. Die einzige Herausforderung bei C++ ist die Menge an Arbeit, die Sie bewältigen müssen, um die fertigen Funktionen zum Laufen zu bringen. Sie müssen wissen, wie man Zeiger verteilt und verwaltet – was ehrlich gesagt ein wenig kompliziert sein kann. Die C# Programmierer Ausbildung ist aus diesem Grunde z.Z. sehr begehrt.

R und Python

Akademiker und Statistiker haben R über zwei Jahrzehnte entwickelt. R verfügt nun über eines der reichsten Ökosysteme, um Datenanalysen durchzuführen. Es sind etwa 12000 Pakete in CRAN (Open-Source-Repository) verfügbar. Es ist möglich, eine Bibliothek zu finden, für was auch immer für eine Analyse Sie durchführen möchten. Die reiche Vielfalt der Bibliothek macht R zur ersten Wahl für statistische Analysen, insbesondere für spezialisierte analytische Arbeiten.

Python kann so ziemlich die gleichen Aufgaben wie R erledigen: Data Wrangling, Engineering, Feature Selection Web Scrapping, App und so weiter. Python ist ein Werkzeug, um maschinelles Lernen in großem Maßstab einzusetzen und zu implementieren. Python-Codes sind einfacher zu warten und robuster als R. Vor Jahren hatte Python nicht viele Bibliotheken für Datenanalyse und maschinelles Lernen. In letzter Zeit holt Python auf und bietet eine hochmoderne API für maschinelles Lernen oder künstliche Intelligenz. Der größte Teil der datenwissenschaftlichen Arbeit kann mit fünf Python-Bibliotheken erledigt werden: Numpy, Pandas, Scipy, Scikit-Learning und Seaborn.

Aber das Wissen, mit Zeigern zu arbeiten oder den Code in C++ zu verwalten, ist mit einem hohen Preis verbunden. Aus diesem Grunde werden C++ Programmierer gesucht, für die Bewältigung von großen Datenpaketen. Ein tiefer Einblick in das Innenleben der Anwendung ermöglicht es ihnen, die Anwendung im Falle von Fehlern besser zu debuggen und sogar Funktionen zu erstellen, die eine Kontrolle des Systems auf Mikroebene erfordern. Schauen Sie sich doch nach C# Entwickler in Berlin um, denn sie haben einen besonders guten Ruf unter den neuen Entwicklern.

Das Erlernen der Programmierung ist eine wesentliche Fähigkeit im Arsenal der Analysten von Big Data. Analysten müssen kodieren, um numerische und statistische Analysen mit großen Datensätzen durchzuführen. Einige der Sprachen, in deren Erlernen auch die C Entwickler Zeit und Geld investieren sollten, sind unter anderem Python, R, Java und C++. Je mehr sie wissen, desto besser – Programmierer sollten immer daran denken, dass sie nicht nur eine einzelne Sprache lernen sollten. C für Java Programmierer sollte ein MUSS sein.

Wo wird das C++ Programmieren eingesetzt?

Die Programmiersprache C++ ist eine etablierte Sprache mit einem großen Satz von Bibliotheken und Tools, die bereit ist, große Datenanwendungen und verteilte Systeme zu betreiben. In den meisten Fällen wird C++ zum Schreiben von Frameworks und Paketen für große Daten verwendet. Diese Programmiersprache bietet auch eine Reihe von Bibliotheken, die beim Schreiben von Algorithmen für das tiefe Lernen helfen. Mit ausreichenden C++-Kenntnissen ist es möglich, praktisch unbegrenzte Funktionen auszuführen. Dennoch ist C++ nicht die Sprache, die man leicht erlernen kann, da man die über 1000 Seiten Spezifikation und fast 100 Schlüsselwörter beherrschen muss.

Die Verwendung von C++ ermöglicht die prozedurale Programmierung für intensive Funktionen der CPU und die Kontrolle über die Hardware, und diese Sprache ist sehr schnell, weshalb sie bei der Entwicklung verschiedener Spiele oder in Spielmaschinen weit verbreitet ist.

C++ bietet viele Funktionen, die anderen Sprachen fehlen. Darüber hinaus bietet die Sprache auch Zugang zu umfangreichen Vorlagen, die es Ihnen ermöglichen, generische Codes zu schreiben. Als betroffenes Unternehmen sollten Sie sich deshalb tatsächlich überlegen, einen C++ Programmierer zu suchen oder in einen Kurs von C++ für Ihren C Programmierer zu investieren. Am Ende lohnen sich bestimmt diese Kosten.

Und vergessen Sie nicht: C++ ist die einzige Sprache, die in der Lage ist, 1 GB+ Daten in weniger als einer Sekunde zu verarbeiten. Darüber hinaus können Sie Ihr Modell neu trainieren und prädiktive Analysen in Echtzeit und sogar die Konsistenz der Systemaufzeichnung anwenden. Diese Gründe machen C++ zu einer bevorzugten Wahl für Sie, wenn Sie einen Datenwissenschaftler für Ihr Unternehmen suchen.

Beispiele für die Verwendung von C++

Die Verwendung von C++ zur Entwicklung von Anwendungen und vielen produktbasierten Programmen, die in dieser Sprache entwickelt wurden, hat mehrere Vorteile, die nur auf ihren Eigenschaften und ihrer Sicherheit beruhen. Unten finden Sie eine Liste der häufigsten Anwendungen von C++.

  • Google-Anwendungen – Einige der Google-Anwendungen sind auch in C++ geschrieben, darunter das Google-Dateisystem und der Google-Chromium-Browser sowie MapReduce für die Verarbeitung großer Clusterdaten. Die Open-Source-Gemeinschaft von Google hat über 2000 Projekte, von denen viele in den Programmiersprachen C oder C++ geschrieben und bei GitHub frei verfügbar sind.
  • Mozilla Firefox und Thunderbird – Der Mozilla-Internetbrowser Firefox und der E-Mail-Client Thunderbird sind beide in der Programmiersprache C++ geschrieben, und sie sind ebenfalls Open-Source-Projekte. Der C++-Quellcode dieser Anwendungen ist in den MDN-Webdokumenten zu finden.
  • Adobe-Systeme – Die meisten der wichtigsten Anwendungen von Adobe-Systemen werden in der Programmiersprache C++ entwickelt. Zu diesen Anwendungen gehören Adobe Photoshop und Image Ready, Illustrator und Adobe Premier. Sie haben in der Vergangenheit eine Menge Open-Source-Codes veröffentlicht, immer in C++, und ihre Entwickler waren in der C++-Community aktiv.
  • 12D-Lösungen – 12D Solutions Pty Ltd ist ein australischer Softwareentwickler, der sich auf Anwendungen im Bereich Bauwesen und Vermessung spezialisiert hat. Computer Aided Design-System für Vermessung, Bauwesen und mehr. Zu den Kunden von 12D Solutions gehören Umweltberater, Berater für Bau- und Wasserbau, lokale, staatliche und nationale Regierungsabteilungen und -behörden, Vermessungsingenieure, Forschungsinstitute, Bauunternehmen und Bergbau-Berater.
  • In C/C++ geschriebene Betriebssysteme

Apple – Betriebssystem OS XApple – Betriebssystem OS X

Einige Teile von Apple OS X sind in der Programmiersprache C++ geschrieben. Auch einige Anwendungen für den iPod sind in C++ geschrieben.

Microsoft-BetriebssystemeMicrosoft-Betriebssysteme

Der Großteil der Software wird buchstäblich mit verschiedenen Varianten von Visual C++ oder einfach C++ entwickelt. Die meisten der großen Anwendungen wie Windows 95, 98, Me, 200 und XP sind ebenfalls in C++ geschrieben. Auch Microsoft Office, Internet Explorer und Visual Studio sind in Visual C++ geschrieben.

  • Betriebssystem Symbian – Auch Symbian OS wird mit C++ entwickelt. Dies war eines der am weitesten verbreiteten Betriebssysteme für Mobiltelefone.

Die Einstellung eines C- oder C++-Entwicklers kann eine gute Investition in Ihr Projekt-Upgrade sein

Normalerweise benötigen C- und C++-Anwendungen weniger Strom, Speicher und Platz als die Sprachen der virtuellen Maschinen auf hoher Ebene. Dies trägt dazu bei, den Kapitalaufwand, die Betriebskosten und sogar die Kosten für die Serverfarm zu reduzieren. Hier zeigt sich, dass C++ die Gesamtentwicklungskosten erheblich reduziert.

Trotz der Tatsache, dass wir eine Reihe von Tools und Frameworks nur für die Verwaltung großer Daten und die Arbeit an der Datenwissenschaft haben, ist es wichtig zu beachten, dass auf all diesen modernen Frameworks eine Schicht einer niedrigen Programmiersprache – wie C++ – aufgesetzt ist. Die Niedrigsprachen sind für die tatsächliche Ausführung des dem Framework zugeführten Hochsprachencodes verantwortlich. Es ist also ratsam in ein C-Entwickler-Gehalt zu investieren.

Der Grund dafür, dass C++ ein so unverzichtbares Werkzeug ist, liegt darin, dass es nicht nur einfach, sondern auch extrem leistungsfähig ist und zu den schnellsten Sprachen auf dem Markt gehört. Darüber hinaus verfügt ein gut geschriebenes Programm in C++ über ein komplexes Wissen und Verständnis der Architektur der Maschine, sowie der Speicherzugriffsmuster und kann schneller laufen als andere Programme. Es wird Ihrem Unternehmen Zeit- und Stromkosten sparen.

Zum Abschluss eine Grafik, die Sie als Unternehmer interessieren wird und die das Verhältnis von der Performance and der Sicherheit diverser Sprachen darstellt:

Aus diesen und weiteren Gründen neigen viele Unternehmensentwickler und Datenwissenschaftler mit massiven Anforderungen an Skalierbarkeit und Leistung zu dem guten alten C++. Viele Organisationen, die Python oder andere Hochsprachen für die Datenanalyse und Erkundungsaufgaben verwenden, verlassen sich auf C++, um Programme zu entwickeln, die diese Daten an die Kunden weiterleiten – in Echtzeit.

Wie funktioniert Natural Language Processing in der Praxis? Ein Überblick

Natural Language Processing (NLP,auf Deutsch auch als Computerlinguistik bezeichnet) gilt als ein Teilbereich des Machine Learning und der Sprachwissenschaften.

Beim NLP geht es vom Prinzip um das Extrahieren und Verarbeiten von Informationen, die in den natürlichen Sprachen enthalten sind. Im Rahmen von NLP wird die natürliche Sprache durch den Rechner in Zahlenabfolgen umgewandelt. Diese Zahlenabfolgen kann wiederum der Rechner benutzen, um Rückschlüsse auf unsere Welt zu ziehen. Kurz gesagt erlaubt NLP dem Computer unsere Sprache in ihren verschiedenen Formen zu verarbeiten. 

Eine ausführlichere Definition von NLP wurde auf dem Data Science Blog von Christopher Kipp vorgenommen. 

In diesem Beitrag werde ich dagegen einen Überblick über die spezifischen Schritte im NLP als Prozess darstellen, denn NLP erfolgt in mehreren Phasen, die aufeinander Folgen und zum Teil als Kreislauf verstanden werden können. In ihren Grundlagen ähneln sich diese Phasen bei jeder NLP-Anwendung, sei es Chatbot Erstellung oder Sentiment Analyse.

1. Datenreinigung / Normalisierung 

In dieser Phase werden die rohen Sprachdaten aus ihrem ursprünglichen Format entnommen, sodass am Ende nur reine Textdaten ohne Format erhalten bleiben. 

Beispielsweise können die Textdaten für unsere Analyse aus Webseiten stammen und nach ihrer Erhebung in HTML Code eingebettet sein.

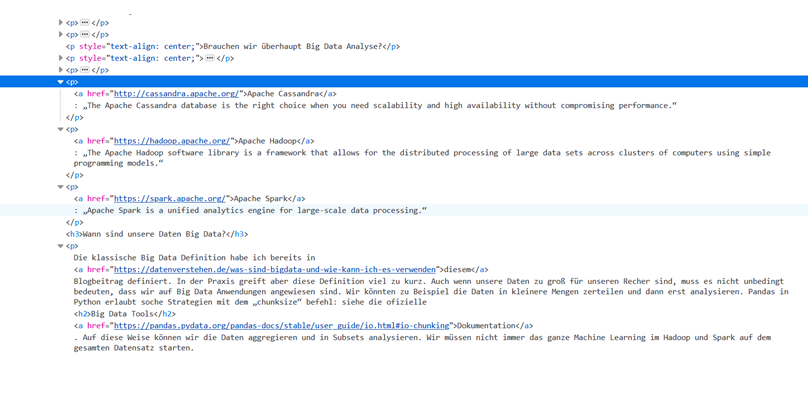
Das Bild zeigt eine Beispielseite. Der Text hier ist noch in einen HTML Kontext eingebettet. Der erste Schritt muss daher sein, den Text von den diversen HTML-Tags zu bereinigen. 


2. Tokenisierung und Normalisierung (Tokenizing and Normalizing) 

Nach dem ersten Schritt steht als Ergebnis idealerweise reiner Text da, der aber auch Sprachelemente wie Punkte, Kommata sowie Groß- und Kleinschreibung beinhaltet. 

Hier kommt der nächste Schritt ins Spiel – die Entfernung der Interpunktion vom Text. Der Text wird auf diese Weise auf seine Wort-Bestandteile (sog. Tokens) reduziert. 

Zusätzlich zu diesem Schritt kann auch Groß- und Kleinschreibung entfernt werden (Normalisierung). Dies spart vor allem die Rechenkapazität. 

So wird aus folgendem Abschnitt:

Auf diese Weise können wir die Daten aggregieren und in Subsets analysieren. Wir müssen nicht immer das ganze Machine Learning in Hadoop und Spark auf dem gesamten Datensatz starten.

folgender Text 

auf diese weise können wir die daten aggregieren und in subsets analysieren wir müssen nicht immer das ganze machine learning in hadoop und spark auf dem gesamten datensatz starten


3. Füllwörterentfernung / Stop words removal 

Im nächsten Schritt entfernen wir die sogenannten Füllwörter wie „und“, „sowie“, „etc.“. In den entsprechenden Python Bibliotheken sind die gängigen Füllwörter bereits gespeichert und können leicht entfernt werden. Trotzdem ist hier Vorsicht geboten. Die Bedeutung der Füllwörter in einer Sprache verändert sich je nach Kontext. Aus diesem Grund ist dieser Schritt optional und die zu entfernenden Füllwörter müssen kontextabhängig ausgewählt werden. 

Nach diesem Schritt bleibt dann in unserem Beispiel folgender Text erhalten: 

können daten aggregieren subsets analysieren müssen nicht immer machine learning hadoop spark datensatz starten


4. Pats of speech (POS) 
Als weiterer Schritt können die Wörter mit ihrer korrekten Wortart markiert werden. Der Rechner markiert sie entsprechend als Verben, Nomen, Adjektive etc. Dieser Schritt könnte für manche Fälle der Grundformreduktion/Lemmatization notwendig sein (dazu sogleich unten).


5. Stemming und Lemmatization/Grundformreduktion

In weiteren Schritten kann weiter das sogenannte Stemming und Lemmatization folgen. Vom Prinzip werden hier die einzelnen Wörter in ihre Grundform bzw. Wörterbuchform gebracht. 

Im Fall von Stemming werden die Wörter am Ende einfach abgeschnitten und auf den Wortstamm reduziert. So wäre zum Beispiel das Verb „gehen“, „geht“ auf die Form „geh“ reduziert. 

Im Fall der Lemmatization bzw. Grundformreduktion werden die Wörter in ihre ursprüngliche Wörterbuchform gebracht: das Verb „geht“ wäre dann ins „gehen“ transformiert. 

Parts of Speech, Stemming als auch Lemmatising sind vorteilhaft für die Komplexitätsreduktion. Sie führen deswegen zu mehr Effizienz und schnellerer Anwendbarkeit. Dies geschieht allerdings auf Kosten der Präzision. Die auf diese Weise erstellten Listen können dann im Fall einer Suchmaschine weniger relevante Ergebnisse liefern.

Nachfolgende Schritte beim NLP transformieren den Text in mathematische Zahlenfolgen, die der Rechner verstehen kann. Wie wir in diesem Schritt vorgehen, hängt stark davon ab, was das eigentliche Ziel des Projektes sei. Es gibt ein breites Angebot an Python Paketen, die die Zahlenbildung je nach Projektziel unterschiedlich gestalten


6a. Bag of Words Methoden in Python (https://en.wikipedia.org/wiki/Bag-of-words_model)

Zu den Bag of Words Methoden in Python gehört das sogenannte TF-IDF Vectorizer. Die Transformationsmethode mit dem TF-IDF eignet sich beispielsweise zum Bau eines Spamdetektors, da der TF-IDF Vectorizer die Wörter im Kontext des Gesamtdokumentes betrachtet.


6b. Word Embeddings Methoden in Python: Word2Vec, GloVe (https://en.wikipedia.org/wiki/Word_embedding)

Wie der Name bereits sagt transformiert Word2Vec die einzelnen Wörter zu Vektoren (Zahlenfolgen). Dabei werden ähnliche Wörter zu ähnlichen Vektoren transformiert. Die Methoden aus der Word Embeddings Kiste eignen sich zum Beispiel besser, um einen Chatbot zu erstellen. 

Im letzten Schritt des NLP können wir die so prozessierte Sprache in die gängigen Machine Learning Modelle einspeisen. Das Beste an den oben erwähnten NLP Techniken ist die Transformation der Sprache in Zahlensequenzen, die durch jeden ML Algorithmus analysiert werden können. Die weitere Vorgehensweise hängt hier nur noch vom Ziel des Projektes ab. 

Dies ist ein Überblick über die notwendigen (und optionalen) Schritte in einem NLP Verfahren. Natürlich hängt die Anwendung vom jeweiligen Use Case ab. Die hier beschriebenen NLP Phasen nehmen viele Ungenauigkeiten in Kauf, wie zum Beispiel die Reduzierung der Wörter auf Wortstämmen bzw. den Verzicht auf Großschreibung. Bei der Umsetzung in der Praxis müssen immer Kosten und Nutzen abgewogen werden und das Verfahren dem besonderen Fall angepasst werden. 

Quellen:
  • Mandy Gu: „Spam or Ham: Introduction to Natural Language Processing Part 2“ https://towardsdatascience.com/spam-or-ham-introduction-to-natural-language-processing-part-2-a0093185aebd
  • Christopher D. Manning, Prabhakar Raghavan & Hinrich Schütze: „Introduction to Information Retrieval”, Cambridge University Press, https://nlp.stanford.edu/IR-book/
  • Hobson Lane, Cole Howard, Hannes Max Hapke: „Natural Language Processing in Action. Understanding, analyzing, and generating text with Python.” Manning Shelter Island

Process Paradise by the Dashboard Light

The right questions drive business success. Questions like, “How can I make sure my product is the best of its kind?” “How can I get the edge over my competitors?” and “How can I keep growing my organization?” Modern businesses take their questions further, focusing on the details of how they actually function. At this level, the questions become, “How can I make my business as efficient as possible?” “How can I improve the way my company does business?” and even, “Why aren’t my company’s processes working as they should?”


Read this article in German:

Mit Dashboards zur Prozessoptimierung


To discover the answers to these questions (and many others!), more and more businesses are turning to process mining. Process mining helps organizations unlock hidden value by automatically collecting information on process models from across the different IT systems operating within a business. This allows for continuous monitoring of an organization’s end-to-end process landscape, meaning managers and staff gain specific operational insights into potential risks—as well as ongoing improvement opportunities.

However, process mining is not a silver bullet that turns data into insights at the push of a button. Process mining software is simply a tool that produces information, which then must be analyzed and acted upon by real people. For this to happen, the information produced must be available to decision-makers in an understandable format.

For most process mining tools, the emphasis remains on the sophistication of analysis capabilities, with the resulting data needing to be interpreted by a select group of experts or specialists within an organization. This necessarily creates a delay between the data being produced, the analysis completed, and actions taken in response.

Process mining software that supports a more collaborative approach by reducing the need for specific expertise can help bridge this gap. Only if hypotheses, analysis, and discoveries are shared, discussed, and agreed upon with a wide range of people can really meaningful insights be generated.

Of course, process mining software is currently capable of generating standardized reports and readouts, but in a business environment where the pace of change is constantly increasing, this may not be sufficient for very much longer. For truly effective process mining, the secret to success will be anticipating challenges and opportunities, then dealing with them as they arise in real time.

Dashboards of the future

To think about how process mining could improve, let’s consider an analog example. Technology evolves to make things easier—think of the difference between keeping track of expenditure using a written ledger vs. an electronic spreadsheet. Now imagine the spreadsheet could tell you exactly when you needed to read it, and where to start, as well as alerting you to errors and omissions before you were even aware you’d made them.

Advances in process mining make this sort of enhanced assistance possible for businesses seeking to improve the way they work. With the right process mining software, companies can build tailored operational cockpits that unite real-time operational data with process management. This allows for the usual continuous monitoring of individual processes and outcomes, but it also offers even clearer insights into an organization’s overall process health.

Combining process mining with an organization’s existing process models in the right way turns these models from static representations of the way a particular process operates, into dynamic dashboards that inform, guide and warn managers and staff about problems in real time. And remember, dynamic doesn’t have to mean distracting—the right process mining software cuts into your processes to reveal an all-new analytical layer of process transparency, making things easier to understand, not harder.

As a result, business transformation initiatives and other improvement plans and can be adapted and restructured on the go, while decision-makers can create automated messages to immediately be advised of problems and guided to where the issues are occurring, allowing corrective action to be completed faster than ever. This rapid evaluation and response across any process inefficiencies will help organizations save time and money by improving wasted cycle times, locating bottlenecks, and uncovering non-compliance across their entire process landscape.

Dynamic dashboards with Signavio

To see for yourself how the most modern and advanced process mining software can help you reveal actionable insights into the way your business works, give Signavio Process Intelligence a try. With Signavio’s Live Insights, all your process information can be visualized in one place, represented through a traffic light system. Simply decide which processes and which activities within them you want to monitor or understand, place the indicators, choose the thresholds, and let Signavio Process Intelligence connect your process models to the data.

Banish multiple tabs and confusing layouts, amaze your colleagues and managers with fact-based insights to support your business transformation, and reduce the time it takes to deliver value from your process management initiatives. To find out more about Signavio Process Intelligence, or sign up for a free 30-day trial, visit www.signavio.com/try.

Process mining is a powerful analysis tool, giving you the visibility, quantifiable numbers, and information you need to improve your business processes. Would you like to read more? With this guide to managing successful process mining initiatives, you will learn that how to get started, how to get the right people on board, and the right project approach.

Mit Dashboards zur Prozessoptimierung

Geschäftlicher Erfolg ergibt sich oft aus den richtigen Fragen – zum Beispiel: „Wie kann ich sicherstellen, dass mein Produkt das beste ist?“, „Wie hebe ich mich von meinen Mitbewerbern ab?“ und „Wie baue ich mein Unternehmen weiter aus?“ Moderne Unternehmen gehen über derartige Fragen hinaus und stellen vielmehr die Funktionsweise ihrer Organisation in den Fokus. Fragen auf dieser Ebene lauten dann: „Wie kann ich meine Geschäftsprozesse so effizient wie möglich gestalten?“, „Wie kann ich Zusammenarbeit meiner Mitarbeiter verbessern?“ oder auch „Warum funktionieren die Prozesse meines Unternehmens nicht so, wie sie sollten?“


Read this article in English: 
“Process Paradise by the Dashboard Light”


Um die Antworten auf diese (und viele andere!) Fragen zu erhalten, setzen immer mehr Unternehmen auf Process Mining. Process Mining hilft Unternehmen dabei, den versteckten Mehrwert in ihren Prozessen aufzudecken, indem Informationen zu Prozessmodellen aus den verschiedenen IT-Systemen eines Unternehmens automatisch erfasst werden. Auf diese Weise kann die End-to-End-Prozesslandschaft eines Unternehmens kontinuierlich überwacht werden. Manager und Mitarbeiter profitieren so von operativen Erkenntnissen und können potenzielle Risiken ebenso erkennen wie Möglichkeiten zur Verbesserung.

Process Mining ist jedoch keine „Wunderwaffe“, die Daten auf Knopfdruck in Erkenntnisse umwandelt. Eine Process-Mining-Software ist vielmehr als Werkzeug zu betrachten, das Informationen erzeugt, die anschließend analysiert und in Maßnahmen umgesetzt werden. Hierfür müssen die generierten Informationen den Entscheidungsträgern jedoch auch in einem verständlichen Format zur Verfügung stehen.

Bei den meisten Process-Mining-Tools steht nach wie vor die Verbesserung der Analysefunktionen im Fokus und die generierten Daten müssen von Experten oder Spezialisten innerhalb einer Organisation bewertet werden. Dies führt zwangsläufig dazu, dass es zwischen den einzelnen Schritten zu Verzögerungen kommt und die Abläufe bis zur Ergreifung von Maßnahmen ins Stocken geraten.

Process-Mining-Software, die einen kooperativeren Ansatz verfolgt und dadurch das erforderliche spezifische Fachwissen verringert, kann diese Lücke schließen. Denn nur wenn Informationen, Hypothesen und Analysen mit einer Vielzahl von Personen geteilt und erörtert werden, können am Ende aussagekräftige Erkenntnisse gewonnen werden.

Aktuelle Process-Mining-Software kann natürlich standardisierte Berichte und Informationen generieren. In einem sich immer schneller ändernden Geschäftsumfeld reicht dies jedoch möglicherweise nicht mehr aus. Das Erfolgsgeheimnis eines wirklich effektiven Process Minings besteht darin, Herausforderungen und geschäftliche Möglichkeiten vorherzusehen und dann in Echtzeit auf sie zu reagieren.

Dashboards der Zukunft

Nehmen wir ein analoges Beispiel, um aufzuzeigen, wie sich das Process Mining verbessern lässt. Der technologische Fortschritt soll die Dinge einfacher machen: Denken Sie beispielsweise an den Unterschied zwischen der handschriftlichen Erfassung von Ausgaben und einem Tabellenkalkulator. Stellen Sie sich nun vor, die Tabelle könnte Ihnen genau sagen, wann Sie sie lesen und wo Sie beginnen müssen, und würde Sie auf Fehler und Auslassungen aufmerksam machen, bevor Sie überhaupt bemerkt haben, dass sie Ihnen passiert sind.

Fortschrittliche Process-Mining-Tools bieten Unternehmen, die ihre Arbeitsweise optimieren möchten, genau diese Art der Unterstützung. Denn mit der richtigen Process-Mining-Software können individuelle operative Cockpits erstellt werden, die geschäftliche Daten in Echtzeit mit dem Prozessmanagement verbinden. Der Vorteil: Es werden nicht nur einzelne Prozesse und Ergebnisse kontinuierlich überwacht, sondern auch klare Einblicke in den Gesamtzustand eines Unternehmens geboten.

Durch die richtige Kombination von Process Mining mit den vorhandenen Prozessmodellen eines Unternehmens werden statisch dargestellte Funktionsweisen eines bestimmten Prozesses in dynamische Dashboards umgewandelt. Manager und Mitarbeiter erhalten so Warnungen über potenzielle Probleme und Schwachstellen in Ihren Prozessen. Und denken Sie daran, dynamisch heißt nicht zwingend störend: Die richtige Process-Mining-Software setzt an der richtigen Stelle in Ihren Prozessen an und bietet ein völlig neues Maß an Prozesstransparenz und damit an Prozessverständnis.

Infolgedessen können Transformationsinitiativen und andere Verbesserungspläne jederzeit angepasst und umstrukturiert werden und Entscheidungsträger mittels automatisierter Nachrichten sofort über Probleme informiert werden, sodass sich Korrekturmaßnahmen schneller als je zuvor umsetzen lassen. Der Vorteil: Unternehmen sparen Zeit und Geld, da Zykluszeiten verkürzt, Engpässe lokalisiert und nicht konforme Prozesse in der Prozesslandschaft der Organisation aufgedeckt werden.

Dynamische Dashboards von Signavio

 Testen Sie Signavio Process Intelligence und erleben Sie selbst, wie die modernste und fortschrittlichste Process-Mining-Software Ihnen dabei hilft, umsetzbare Einblicke in die Funktionsweise Ihres Unternehmens zu erhalten. Mit Signavios Live Insights profitieren Sie von einer zentralen Ansicht Ihrer Prozesse und Informationen, die in Form eines Ampelsystems dargestellt werden. Entscheiden Sie einfach, welche Prozesse und Aktivitäten Sie innerhalb eines Prozesses überwachen möchten, platzieren Sie Indikatoren und wählen Sie Grenzwerte aus. Alles Weitere übernimmt Signavio Process Intelligence, das Ihre Prozessmodelle mit den Daten verbindet.

Lassen Sie veraltete Arbeitsweisen hinter sich. Setzen Sie stattdessen auf faktenbasierte Erkenntnisse, um Ihre Geschäftstransformation zu unterstützen und Ihre Prozessmanagementinitiativen schneller zum Erfolg zu führen. Erfahren Sie mehr über Signavio Process Intelligence oder registrieren Sie sich für eine kostenlose 30-Tage-Testversion über www.signavio.com/try.

Erfahren Sie in unserem kostenlosen Whitepaper mehr über erfolgreiches Process Mining mit Signavio Process Intelligence.

Interview – Customer Data Platform, more than CRM 2.0?

Interview with David M. Raab from the CDP Institute

David M. Raab is as a consultant specialized in marketing software and service vendor selection, marketing analytics and marketing technology assessment. Furthermore he is the founder of the Customer Data Platform Institute which is a vendor-neutral educational project to help marketers build a unified customer view that is available to all of their company systems.

Furthermore he is a Keynote-Speaker for the Predictive Analytics World Event 2019 in Berlin.

Data Science Blog: Mr. Raab, what exactly is a Customer Data Platform (CDP)? And where is the need for it?

The CDP Institute defines a Customer Data Platform as „packaged software that builds a unified, persistent customer database that is accessible by other systems“.  In plainer language, a CDP assembles customer data from all sources, combines it into customer profiles, and makes the profiles available for any use.  It’s important because customer data is collected in so many different systems today and must be unified to give customers the experience they expect.

Data Science Blog: Is it something like a CRM System 2.0? What Use Cases can be realized by a Customer Data Platform?

CRM systems are used to interact directly with customers, usually by telephone or in the field.  They work almost exclusively with data that is entered during those interactions.  This gives a very limited view of the customer since interactions through other channels such as order processing or Web sites are not included.  In fact, one common use case for CDP is to give CRM users a view of all customer interactions, typically by opening a window into the CDP database without needing to import the data into the CRM.  There are many other use cases for unified data, including customer segmentation, journey analysis, and personalization.  Anything that requires sharing data across different systems is a CDP use case.

Data Science Blog: When does a CDP make sense for a company? It is more relevant for retail and financial companies than for industrial companies, isn´t it?

CDP has been adopted most widely in retail and online media, where each customer has many interactions and there are many products to choose from.  This is a combination that can make good use of predictive modeling, which benefits greatly from having more complete data.  Financial services was slower to adopt, probably because they have fewer products but also because they already had pretty good customer data systems.  B2B has also been slow to adopt because so much of their customer relationship is handled by sales people.  We’ve more recently been seeing growth in additional sectors such as travel, healthcare, and education.  Those involve fewer transactions than retail but also rely on building strong customer relationships based on good data.

Data Science Blog: There are several providers for CDPs. Adobe, Tealium, Emarsys or Dynamic Yield, just to name some of them. Do they differ a lot between each other?

Yes they do.  All CDPs build the customer profiles I mentioned.  But some do more things, such as predictive modeling, message selection, and, increasingly, message delivery.  Of course they also vary in the industries they specialize in, regions they support, size of clients they work with, and many technical details.  This makes it hard to buy a CDP but also means buyers are more likely to find a system that fits their needs.

Data Science Blog: How established is the concept of the CDP in Europe in general? And how in comparison with the United States?

CDP is becoming more familiar in Europe but is not as well understood as in the U.S.  The European market spent a lot of money on Data Management Platforms (DMPs) which promised to do much of what a CDP does but were not able to because they do not store the level of detail that a CDP does.  Many DMPs also don’t work with personally identifiable data because the DMPs primarily support Web advertising, where many customers are anonymous.  The failures of DMPs have harmed CDPs because they have made buyers skeptical that any system can meet their needs, having already failed once.  But we are overcoming this as the market becomes better educated and more success stories are available.  What’s the same in Europe and the U.S. is that marketers face the same needs.  This will push European marketers towards CDPs as the best solution in many cases.

Data Science Blog: What are coming trends? What will be the main topic 2020?

We see many CDPs with broader functions for marketing execution: campaign management, personalization, and message delivery in particular.  This is because marketers would like to buy as few systems as possible, so they want broader scope in each systems.  We’re seeing expansion into new industries such as financial services, travel, telecommunications, healthcare, and education.  Perhaps most interesting will be the entry of Adobe, Salesforce, and Oracle, who have all promised CDP products late this year or early next year.  That will encourage many more people to consider buying CDPs.  We expect that market will expand quite rapidly, so current CDP vendors will be able to grow even as Adobe, Salesforce, and Oracle make new CDP sales.


You want to get in touch with Daniel M. Raab and understand more about the concept of a CDP? Meet him at the Predictive Analytics World 18th and 19th November 2019 in Berlin, Germany. As a Keynote-Speaker, he will introduce the concept of a Customer Data Platform in the light of Predictive Analytics. Click here to see the agenda of the event.


Simple Linear Regression: Mathematics explained with implementation in numpy

Simple Linear Regression

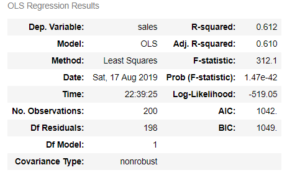
Being in the field of data science, we all are familiar with at least some of the measures shown in figure 1.1 (generated in python using statsmodels). But do we really understand how these measures are being calculated? or what is the math behind these measures? In this article, I hope that I can answer these questions for you. This article will start from the fundamentals of simple linear regression but by the end of this article, you will get an idea of how to program this in numpy (python library).


Fig. 1.1

Simple linear regression is a very simple approach for supervised learning where we are trying to predict a quantitative response Y based on the basis of only one variable x. Here x is an independent variable and Y is our dependent variable. Assuming that there is a linear relationship between our independent and dependent variable we can represent this relationship as:


Y = mx+c


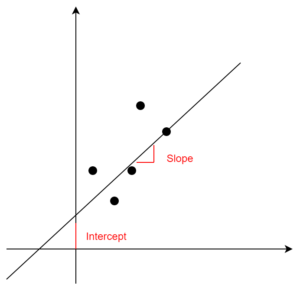
where m and c are two unknown constants that represent the slope and the intercept of our linear model. Together, these constants are also known as parameters or coefficients. If you want to visualize these parameters see figure 1.2.

Fig. 1.2

Please note that we can only calculate the estimates of these parameters thus we have to rewrite our linear equation like:


\widehat{y} = \widehat{m}x + \widehat{c}


here y-hat represents a prediction of Y (actual value) based on x. Once we have found the estimates of these parameters, the equation can be used to predict the future value of Y provided a new/test value of x.

How to find the estimate of these parameters?

Let’s assume we have ‘n’ observations and for each independent variable value we have a value for dependent variable like this:

(x1,y1), (x2,y2),……,(xn,yn). Our goal is to find the best values of these parameters so the line in fig 1.1 should be as close as possible to the data points and we will be using the most common approach of Ordinary least squares to do that.  This best fit is found by minimizing the residual sum of squared errors which can be calculated as below:


RSS = {(y_1-\widehat{y1}})^2+{(y_2-\widehat{y2}})^2 +…..+{(y_n-\widehat{yn}})^2


or

RSS = {(y_1-\widehat{c}-{\widehat m_1x_1})}^2+ {(y_2-\widehat{c}-{\widehat m_1x_2})}^2 +…..+{(y_n-\widehat{c}-{\widehat m_1x_n})}^2


where

m_1 = \frac{\sum_i^n (x_i-\bar x)(y_i-\bar y)}{\sum_i^n (x_i-\bar x)^{2}}


and

\widehat{c} = \bar y - \widehat{m_1} \bar x


Measures to evaluate our regression model

We can use two measures to evaluate our simple linear regression model:

Residual Standard Error (RSE)

According to the book An Introduction to Statistical Learning with Applications in R (James, et al., 2013, pp. 68-71) explains RSE as an estimate of the standard deviation of the error ϵ and can be calculated as:


RSE = \sqrt{\frac{1}{n-2}\sum_i^n(y_i-\widehat y_i)^2}


R square

It is not always clear what is a good score for RSE so we use R square as an alternative to measuring the performance of our model. Please note that there are other measures also which we will discuss in my next article about multiple linear regression. We will also cover the difference between the R square and adjusted R square. The formula for R square can be seen below.


R^2 =1- \frac{\sum_i^n(y_i-\widehat y_i)^2}{(y_i-\bar y)^2}


Now that we have covered the theoretical part of simple linear regression, let’s write these formulas in python (numpy).


Python implementation

To implement this in python first we need a dataset on which we can work on. The dataset that we are going to use in this article is Advertising data and can be downloaded from here. Before we start the analysis we will use pandas library to load the dataset as a dataframe (see code below).

**Please check your path of the advertising file.

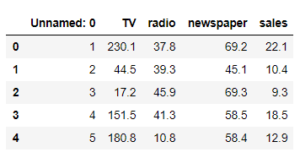
To show the first five rows of the dataset use df.head() and you will see output like this:


Let me try to explain what are we have to do here, we have the dataset of an ad company which has three different advertising channels TV, radio and newspaper. This company regularly invests in these channels and track their sales over time. However, the time variable is not present in this csv file. Anyway, this company wants to know how much sales will be impacted if they spent a certain amount on any of their advertising channels. As this is the case for simple linear regression we will be using only one predictor TV to fit our model. From here we will go step by step.

Step 1: Define the dependent and independent variable

Step 2: Define a function to find the slope (m)

So, when we applied the function in our current dataset we got a slope of 0.0475.

Step 3: Define a function to find the intercept (c)

and an intercept of 7.0325

Once we have the values for slope and intercept, it is now time to define functions to calculate the residual sum of squares (RSS) and the metrics we will use to evaluate our linear model i.e. residual standard error (RSE) and R-square.

Step 4: Define a function to find residual sum of squares (RSS)

As we discussed in the theory section that it is very hard to evaluate a model based on RSS as we can never generalize the thresholds for RSS and hence we need to settle for other measures.

Step 5: Define a function to calculate residual standard error (RSE)

Step 6: Define a function to find R-square

Here, we see that R-square offers an advantage over RSE as it always lies between 0 and 1, which makes it easier to evaluate our linear model. If you want to understand more about what constitutes a good measure of R-square you can read the explanation given in the book An introduction to statistical learning (mentioned this above also).

The final step now would be to define a function which can be used to predict our sales on the amount of budget spend on TV.

Now, let’s say if the advertising budget for TV is 1500 USD, what would be their sales?

Our linear model predicted that if the ad company would spend 1500 USD they will see an increase of 78 units. If you want to go through the whole code you can find the jupyter notebook here. In this notebook, I have also made a class wrapper at the end of this linear model. It will be really hard to explain the whole logic why I did it here, so I will keep that for another post.In the next article, I will explain the mathematics behind Multiple Linear Regression and how we can implement that in python. Please let me know if you have any question in the comments section. Thank you for reading !!

A Bird’s Eye View: How Machine Learning Can Help You Charge Your E-Scooters

Bird scooters in Columbus, Ohio

Bird scooters in Columbus, Ohio

Ever since I started using bike-sharing to get around in Seattle, I have become fascinated with geolocation data and the transportation sharing economy. When I saw this project leveraging the mobility data RESTful API from the Los Angeles Department of Transportation, I was eager to dive in and get my hands dirty building a data product utilizing a company’s mobility data API.

Unfortunately, the major bike and scooter providers (Bird, JUMP, Lime) don’t have publicly accessible APIs. However, some folks have seemingly been able to reverse-engineer the Bird API used to populate the maps in their Android and iOS applications.

One interesting feature of this data is the nest_id, which indicates if the Bird scooter is in a “nest” — a centralized drop-off spot for charged Birds to be released back into circulation.

I set out to ask the following questions:

  1. Can real-time predictions be made to determine if a scooter is currently in a nest?
  2. For non-nest scooters, can new nest location recommendations be generated from geospatial clustering?

To answer these questions, I built a full-stack machine learning web application, NestGenerator, which provides an automated recommendation engine for new nest locations. This application can help power Bird’s internal nest location generation that runs within their Android and iOS applications. NestGenerator also provides real-time strategic insight for Bird chargers who are enticed to optimize their scooter collection and drop-off route based on proximity to scooters and nest locations in their area.

Bird

The electric scooter market has seen substantial growth with Bird’s recent billion dollar valuation  and their $300 million Series C round in the summer of 2018. Bird offers electric scooters that top out at 15 mph, cost $1 to unlock and 15 cents per minute of use. Bird scooters are in over 100 cities globally and they announced in late 2018 that they eclipsed 10 million scooter rides since their launch in 2017.
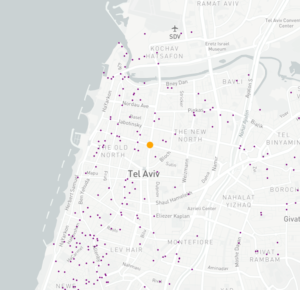
Bird scooters in Tel Aviv, Israel

Bird scooters in Tel Aviv, Israel

With all of these scooters populating cities, there’s much-needed demand for people to charge them. Since they are electric, someone needs to charge them! A charger can earn additional income for charging the scooters at their home and releasing them back into circulation at nest locations. The base price for charging each Bird is $5.00. It goes up from there when the Birds are harder to capture.

Data Collection and Machine Learning Pipeline
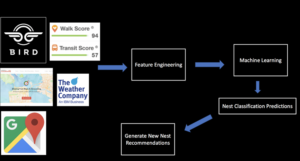
The full data pipeline for building “NestGenerator”

Data

From the details here, I was able to write a Python script that returned a list of Bird scooters within a specified area, their geolocation, unique ID, battery level and a nest ID.

I collected scooter data from four cities (Atlanta, Austin, Santa Monica, and Washington D.C.) across varying times of day over the course of four weeks. Collecting data from different cities was critical to the goal of training a machine learning model that would generalize well across cities.

Once equipped with the scooter’s latitude and longitude coordinates, I was able to leverage additional APIs and municipal data sources to get granular geolocation data to create an original scooter attribute and city feature dataset.

Data Sources:

  • Walk Score API: returns a walk score, transit score and bike score for any location.
  • Google Elevation API: returns elevation data for all locations on the surface of the earth.
  • Google Places API: returns information about places. Places are defined within this API as establishments, geographic locations, or prominent points of interest.
  • Google Reverse Geocoding API: reverse geocoding is the process of converting geographic coordinates into a human-readable address.
  • Weather Company Data: returns the current weather conditions for a geolocation.
  • LocationIQ: Nearby Points of Interest (PoI) API returns specified PoIs or places around a given coordinate.
  • OSMnx: Python package that lets you download spatial geometries and model, project, visualize, and analyze street networks from OpenStreetMap’s APIs.

Feature Engineering

After extensive API wrangling, which included a four-week prolonged data collection phase, I was finally able to put together a diverse feature set to train machine learning models. I engineered 38 features to classify if a scooter is currently in a nest.
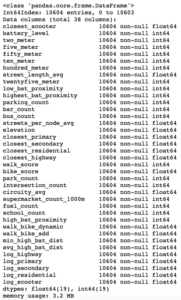
Full Feature Set

Full Feature Set

The features boiled down into four categories:

  • Amenity-based: parks within a given radius, gas stations within a given radius, walk score, bike score
  • City Network Structure: intersection count, average circuity, street length average, average streets per node, elevation level
  • Distance-based: proximity to closest highway, primary road, secondary road, residential road
  • Scooter-specific attributes: battery level, proximity to closest scooter, high battery level (> 90%) scooters within a given radius, total scooters within a given radius


Log-Scale Transformation

For each feature, I plotted the distribution to explore the data for feature engineering opportunities. For features with a right-skewed distribution, where the mean is typically greater than the median, I applied these log transformations to normalize the distribution and reduce the variability of outlier observations. This approach was used to generate a log feature for proximity to closest scooter, closest highway, primary road, secondary road, and residential road.

An example of a log transformation

Statistical Analysis: A Systematic Approach

Next, I wanted to ensure that the features I included in my model displayed significant differences when broken up by nest classification. My thinking was that any features that did not significantly differ when stratified by nest classification would not have a meaningful predictive impact on whether a scooter was in a nest or not.

Distributions of a feature stratified by their nest classification can be tested for statistically significant differences. I used an unpaired samples t-test with a 0.01% significance level to compute a p-value and confidence interval to determine if there was a statistically significant difference in means for a feature stratified by nest classification. I rejected the null hypothesis if a p-value was smaller than the 0.01% threshold and if the 99.9% confidence interval did not straddle zero. By rejecting the null-hypothesis in favor of the alternative hypothesis, it’s deemed there is a significant difference in means of a feature by nest classification.

Battery Level Distribution Stratified by Nest Classification to run a t-test

Battery Level Distribution Stratified by Nest Classification to run a t-test

Log of Closest Scooter Distribution Stratified by Nest Classification to run a t-test

Throwing Away Features

Using the approach above, I removed ten features that did not display statistically significant results.
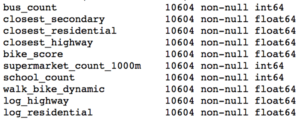
Statistically Insignificant Features Removed Before Model Development

Model Development

I trained two models, a random forest classifier and an extreme gradient boosting classifier since tree-based models can handle skewed data, capture important feature interactions, and provide a feature importance calculation. I trained the models on 70% of the data collected for all four cities and reserved the remaining 30% for testing.

After hyper-parameter tuning the models for performance on cross-validation data it was time to run the models on the 30% of test data set aside from the initial data collection.

I also collected additional test data from other cities (Columbus, Fort Lauderdale, San Diego) not involved in training the models. I took this step to ensure the selection of a machine learning model that would generalize well across cities. The performance of each model on the additional test data determined which model would be integrated into the application development.

Performance on Additional Cities Test Data

The Random Forest Classifier displayed superior performance across the board

The Random Forest Classifier displayed superior performance across the board

I opted to move forward with the random forest model because of its superior performance on AUC score and accuracy metrics on the additional cities test data. AUC is the Area under the ROC Curve, and it provides an aggregate measure of model performance across all possible classification thresholds.
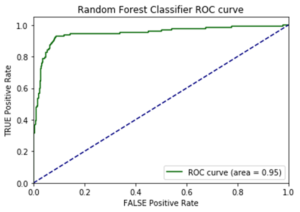
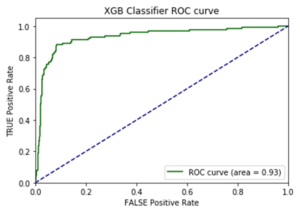
AUC Score on Test Data for each Model

AUC Score on Test Data for each Model

Feature Importance

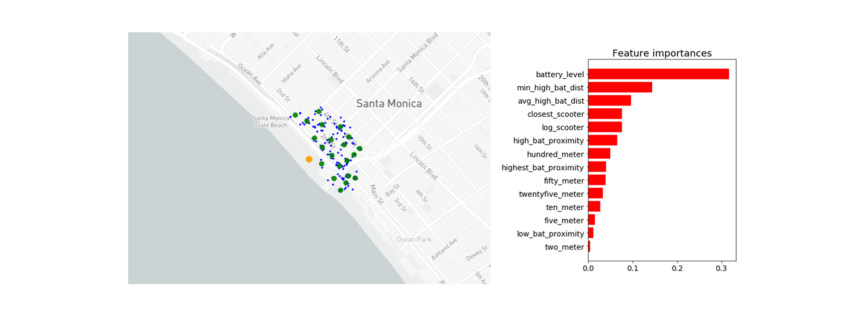
Battery level dominated as the most important feature. Additional important model features were proximity to high level battery scooters, proximity to closest scooter, and average distance to high level battery scooters.
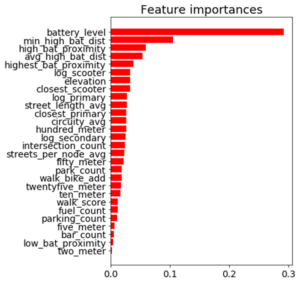
Feature Importance for the Random Forest Classifier

Feature Importance for the Random Forest Classifier

The Trade-off Space

Once I had a working machine learning model for nest classification, I started to build out the application using the Flask web framework written in Python. After spending a few days of writing code for the application and incorporating the trained random forest model, I had enough to test out the basic functionality. I could finally run the application locally to call the Bird API and classify scooter’s into nests in real-time! There was one huge problem, though. It took more than seven minutes to generate the predictions and populate in the application. That just wasn’t going to cut it.

The question remained: will this model deliver in a production grade environment with the goal of making real-time classifications? This is a key trade-off in production grade machine learning applications where on one end of the spectrum we’re optimizing for model performance and on the other end we’re optimizing for low latency application performance.

As I continued to test out the application’s performance, I still faced the challenge of relying on so many APIs for real-time feature generation. Due to rate-limiting constraints and daily request limits across so many external APIs, the current machine learning classifier was not feasible to incorporate into the final application.

Run-Time Compliant Application Model

After going back to the drawing board, I trained a random forest model that relied primarily on scooter-specific features which were generated directly from the Bird API.

Through a process called vectorization, I was able to transform the geolocation distance calculations utilizing NumPy arrays which enabled batch operations on the data without writing any “for” loops. The distance calculations were applied simultaneously on the entire array of geolocations instead of looping through each individual element. The vectorization implementation optimized real-time feature engineering for distance related calculations which improved the application response time by a factor of ten.
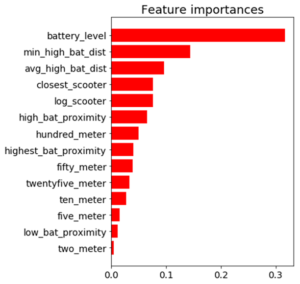
Feature Importance for the Run-time Compliant Random Forest Classifier

Feature Importance for the Run-time Compliant Random Forest Classifier

This random forest model generalized well on test-data with an AUC score of 0.95 and an accuracy rate of 91%. The model retained its prediction accuracy compared to the former feature-rich model, but it gained 60x in application performance. This was a necessary trade-off for building a functional application with real-time prediction capabilities.

Geospatial Clustering

Now that I finally had a working machine learning model for classifying nests in a production grade environment, I could generate new nest locations for the non-nest scooters. The goal was to generate geospatial clusters based on the number of non-nest scooters in a given location.

The k-means algorithm is likely the most common clustering algorithm. However, k-means is not an optimal solution for widespread geolocation data because it minimizes variance, not geodetic distance. This can create suboptimal clustering from distortion in distance calculations at latitudes far from the equator. With this in mind, I initially set out to use the DBSCAN algorithm which clusters spatial data based on two parameters: a minimum cluster size and a physical distance from each point. There were a few issues that prevented me from moving forward with the DBSCAN algorithm.

  1. The DBSCAN algorithm does not allow for specifying the number of clusters, which was problematic as the goal was to generate a number of clusters as a function of non-nest scooters.
  2. I was unable to hone in on an optimal physical distance parameter that would dynamically change based on the Bird API data. This led to suboptimal nest locations due to a distortion in how the physical distance point was used in clustering. For example, Santa Monica, where there are ~15,000 scooters, has a higher concentration of scooters in a given area whereas Brookline, MA has a sparser set of scooter locations.
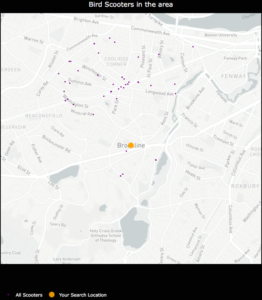
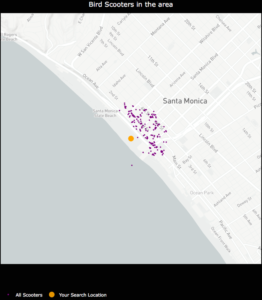
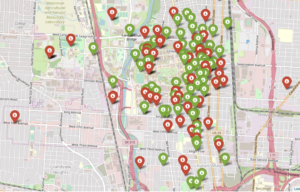
An example of how sparse scooter locations vs. highly concentrated scooter locations for a given Bird API call can create cluster distortion based on a static physical distance parameter in the DBSCAN algorithm. Left:Bird scooters in Brookline, MA. Right:Bird scooters in Santa Monica, CA.

An example of how sparse scooter locations vs. highly concentrated scooter locations for a given Bird API call can create cluster distortion based on a static physical distance parameter in the DBSCAN algorithm. Left:Bird scooters in Brookline, MA. Right:Bird scooters in Santa Monica, CA.

Given the granularity of geolocation scooter data I was working with, geospatial distortion was not an issue and the k-means algorithm would work well for generating clusters. Additionally, the k-means algorithm parameters allowed for dynamically customizing the number of clusters based on the number of non-nest scooters in a given location.

Once clusters were formed with the k-means algorithm, I derived a centroid from all of the observations within a given cluster. In this case, the centroids are the mean latitude and mean longitude for the scooters within a given cluster. The centroids coordinates are then projected as the new nest recommendations.
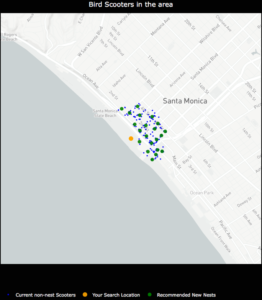
NestGenerator showcasing non-nest scooters and new nest recommendations utilizing the K-Means algorithm

NestGenerator showcasing non-nest scooters and new nest recommendations utilizing the K-Means algorithm.

NestGenerator Application

After wrapping up the machine learning components, I shifted to building out the remaining functionality of the application. The final iteration of the application is deployed to Heroku’s cloud platform.

In the NestGenerator app, a user specifies a location of their choosing. This will then call the Bird API for scooters within that given location and generate all of the model features for predicting nest classification using the trained random forest model. This forms the foundation for map filtering based on nest classification. In the app, a user has the ability to filter the map based on nest classification.
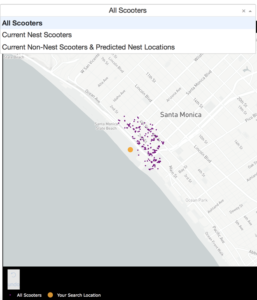
Drop-Down Map View filtering based on Nest Classification

Drop-Down Map View filtering based on Nest Classification

Nearest Generated Nest

To see the generated nest recommendations, a user selects the “Current Non-Nest Scooters & Predicted Nest Locations” filter which will then populate the application with these nest locations. Based on the user’s specified search location, a table is provided with the proximity of the five closest nests and an address of the Nest location to help inform a Bird charger in their decision-making.
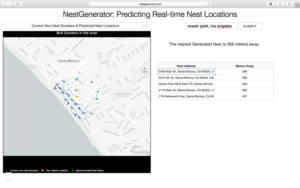
NestGenerator web-layout with nest addresses and proximity to nearest generated nests

NestGenerator web-layout with nest addresses and proximity to nearest generated nests

Conclusion

By accurately predicting nest classification and clustering non-nest scooters, NestGenerator provides an automated recommendation engine for new nest locations. For Bird, this application can help power their nest location generation that runs within their Android and iOS applications. NestGenerator also provides real-time strategic insight for Bird chargers who are enticed to optimize their scooter collection and drop-off route based on scooters and nest locations in their area.

Code

The code for this project can be found on my GitHub

Comments or Questions? Please email me an E-Mail!


Allgemeines über Geodaten

Dieser Artikel ist der Auftakt in einer Artikelserie zum Thema “Geodatenanalyse”.

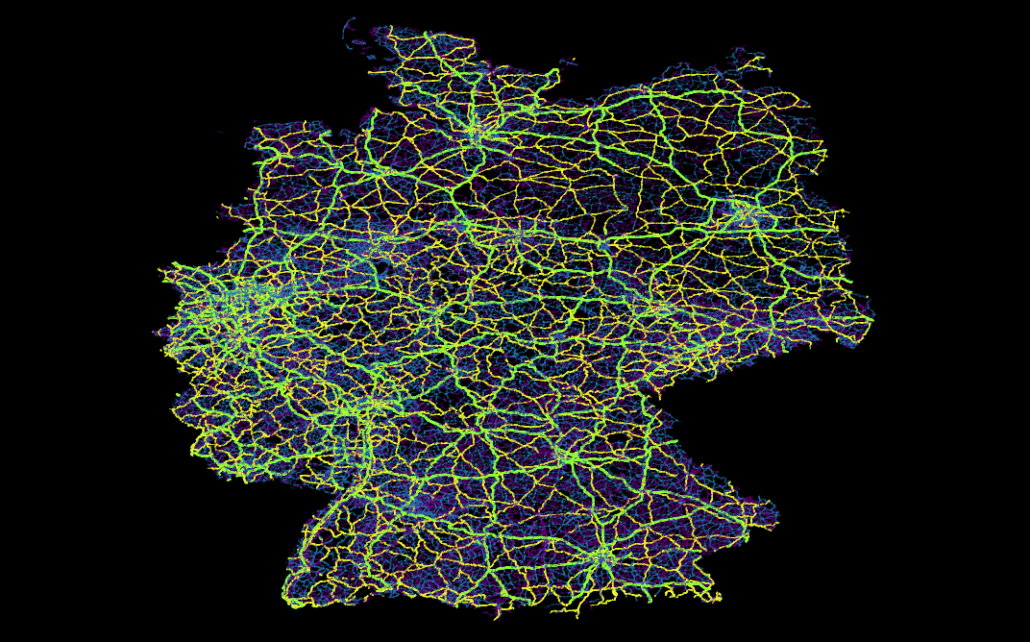
Von den vielen Arten an Datensätzen, die öffentlich im Internet verfügbar sind, bin ich in letzter Zeit vermehrt über eine besonders interessante Gruppe gestolpert, die sich gleich für mehrere Zwecke nutzen lassen: Geodaten.

Gerade in wirtschaftlicher Hinsicht bieten sich eine ganze Reihe von Anwendungsfällen, bei denen Geodaten helfen können, Einblicke in Tatsachen zu erlangen, die ohne nicht möglich wären. Der wohl bekannteste Fall hierfür ist vermutlich die einfache Navigation zwischen zwei Punkten, die jeder kennt, der bereits ein Navigationssystem genutzt oder sich eine Route von Google Maps berechnen lassen hat.
Hiermit können nicht nur Fragen nach dem schnellsten oder Energie einsparensten (und damit gleichermaßen auch witschaftlichsten) Weg z. B. von Berlin nach Hamburg beantwortet werden, sondern auch die bestmögliche Lösung für Ausnahmesituationen wie Stau oder Vollsperrungen berechnet werden (ja, Stau ist, zumindest in der Theorie immer noch eine “Ausnahmesituation” ;-)).
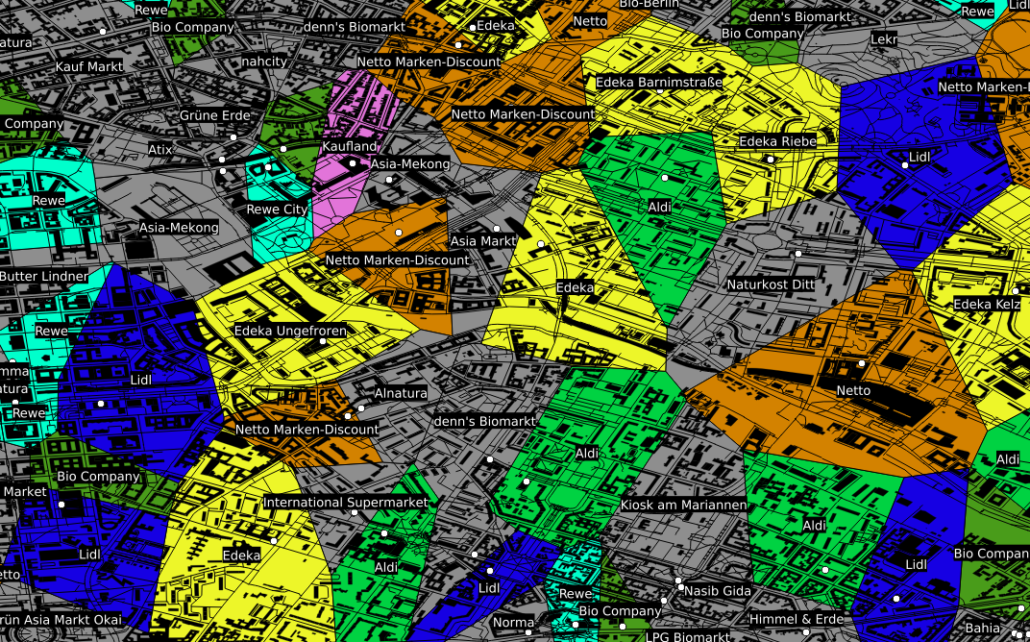
Neben dieser beliebten Art Geodaten zu nutzen, gibt es eine ganze Reihe weiterer Situationen in denen deren Nutzung hilfreich bis essentiell sein kann. Als Beispiel sei hier der Einzugsbereich von in Konkurrenz stehenden Einheiten, wie z. B. Supermärkten genannt. Ohne an dieser Stelle statistische Nachweise vorlegen zu können, kaufen (zumindest meiner persönlichen Beobachtung nach) die meisten Menschen fast immer bei dem Supermarkt ein, der am bequemsten zu erreichen ist und dies ist in der Regel der am nächsten gelegene. Besitzt man nun eine Datenbank mit der Information, wo welcher Supermarkt bzw. welche Supermarktkette liegt, kann man mit so genannten Voronidiagrammen recht einfach den jeweiligen Einzugsbereich der jeweiligen Supermärkte berechnen.
Entsprechende Karten können auch von beliebigen anderen Entitäten mit fester geographischer Position gezeichnet werden: Geldautomaten, Funkmasten, öffentlicher Nahverkehr, …

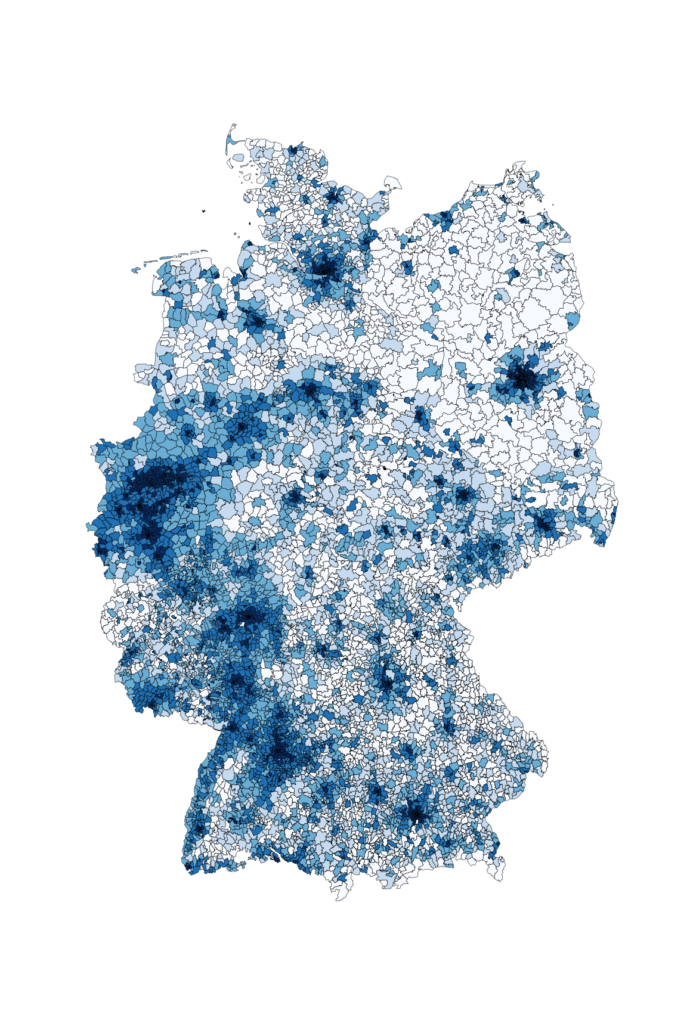
Ein anderes Beispiel, das für die Datenauswertung interessant ist, ist die kartographische Auswertung von Postleitzahlen. Diese sind in fast jedem Datensatz zu Kunden, Lieferanten, ect. vorhanden, bilden jedoch weder eine ordinale, noch eine sinnvolle kategorische Größe, da es viele tausend verschiedene gibt. Zudem ist auch eine einfache Gruppierung in gröbere Kategorien wie beispielsweise Postleitzahlen des Schemas 1xxxx oft kaum sinnvoll, da diese in aller Regel kein sinnvolles Mapping auf z. B. politische Gebiete – wie beispielsweise Bundesländer – zulassen. Ein Ausweg aus diesem Dilemma ist eine einfache kartographische Übersicht, welche die einzelnen Postleitzahlengebiete in einer Farbskala zeigt.

Im gezeigten Beispiel ist die Bevölkerungsdichte Deutschlands als Karte zu sehen. Hiermit wird schnell und übersichtlich deutlich, wo in Deutschland die Bevölkerung lokalisiert ist. Ähnliche Karten können beispielsweise erstellt werden, um Fragen wie “Wie ist meine Kundschaft verteilt?” oder “Wo hat die Werbekampange XYZ besonders gut funktioniert?” zu beantworten. Bezieht man weitere Daten wie die absolute Bevölkerung oder die Bevölkerungsdichte mit ein, können auch Antworten auf Fragen wie “Welchen Anteil der Bevölkerung habe ich bereits erreicht und wo ist noch nicht genutztes Potential?” oder “Ist mein Produkt eher in städtischen oder ländlichen Gebieten gefragt?” einfach und schnell gefunden werden.
Ohne die entsprechende geographische Zusatzinformation bleiben insbesondere Postleitzahlen leider oft als “nicht sinnvoll auswertbar” bei der Datenauswertung links liegen.
Eine ganz andere Art von Vorteil der Geodaten ist der educational point of view:
  • Wer erst anfängt, sich mit Datenbanken zu beschäftigen, findet mit Straßen, Postleitzahlen und Ländern einen deutlich einfacheren und vor allem besser verständlichen Zugang zu SQL als mit abstrakten Größen und Nummern wie ProductID, CustomerID und AdressID. Zudem lassen sich Geodaten nebenbei bemerkt mittels so genannter GeoInformationSystems (*gis-Programme), erstaunlich einfach und ansprechend plotten.
  • Wer sich mit SQL bereits ein wenig auskennt, kann mit den (beispielsweise von Spatialite oder PostGIS) bereitgestellten SQL-Funktionen eine ganze Menge über Datenbanken sowie deren Möglichkeiten – aber auch über deren Grenzen – erfahren.
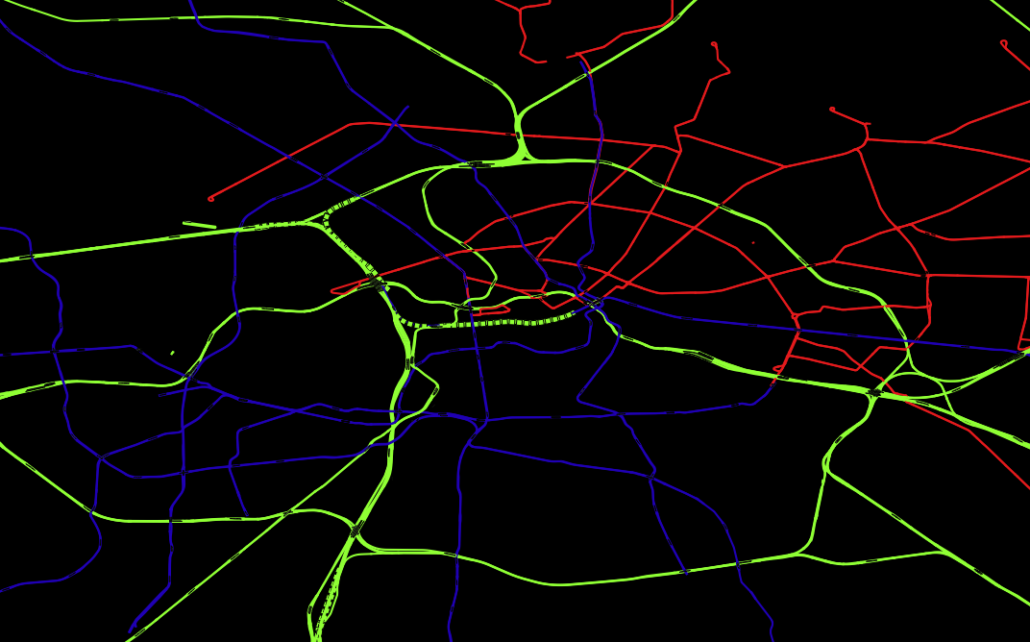
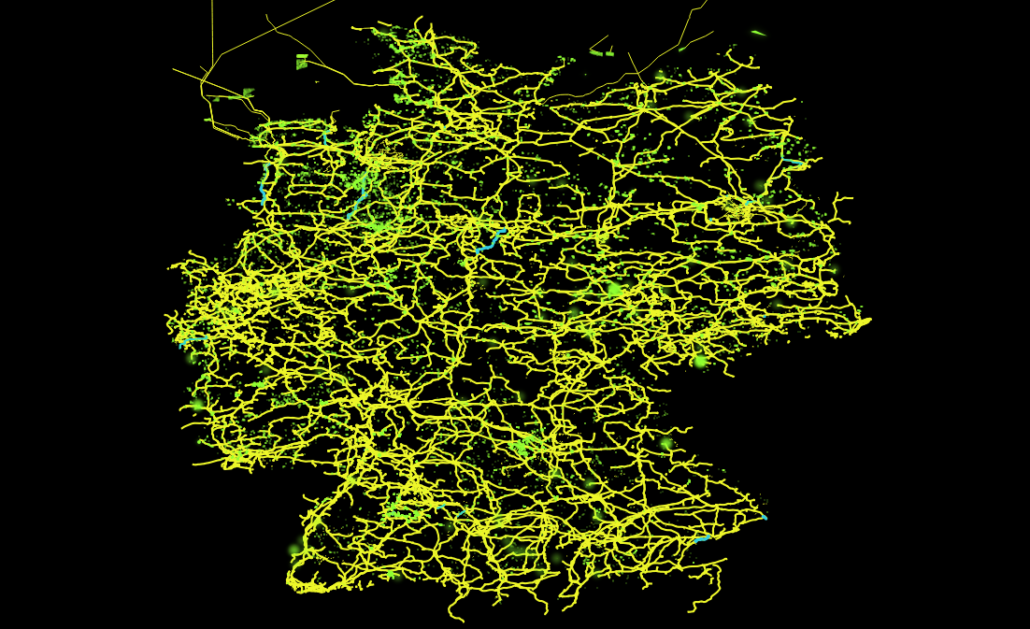
  • Für wen relationale Datenbanken sowie deren Funktionen schon lange nichts Neues mehr darstellen, kann sich hier (selbst mit dem eigenen Notebook) erstaunlich einfach in das Thema “Bug Data” einarbeiten, da die Menge an öffentlich vorhandenen Geodaten z.B. des OpenStreetMaps-Projektes selbst in optimal gepackten Format vielen Dutzend GB entsprechen. Gerade die Möglichkeit, die viele *gis-Programme wie beispielsweise QGIS bieten, nämlich Straßen-, Schienen- und Stromnetze “on-the-fly” zu plotten, macht die Bedeutung von richtig oder falsch gesetzten Indices in verschiedenen Datenbanken allein anhand der Geschwindigkeit mit der sich die Plots aufbauen sehr eindrucksvoll deutlich.
Um an Datensätze zu kommen, reicht es in der Regel Google mit den entsprechenden Schlagworten zu versorgen.
Neben – um einen Vergleich zu nutzen – dem Brockhaus der Karten GoogleMaps gibt es beispielsweise mit dem OpenStreetMaps-Projekt einen freien Geodatensatz, welcher in diesem Kontext etwa als das Wikipedia der Karten zu verstehen ist.
Hier findet man zum Beispiel Daten wie Straßen-, Schienen- oder dem Stromnetz, aber auch die im obigen Voronidiagramm eingezeichneten Gebäude und Supermärkte stammen aus diesem Datensatz. Hiermit lassen sich recht einfach just for fun interessante Dinge herausfinden, wie z. B., dass es in Deutschland ca. 28 Mio Gebäude gibt (ein SQL-Einzeiler), dass der Berliner Osten auch ca. 30 Jahre nach der Wende noch immer vorwiegend von der Tram versorgt wird, während im Westen hauptsächlich die U-Bahn fährt. Oder über welche Trassen der in der Nordsee von Windkraftanlagen erzeugte Strom auf das Festland kommt und von da aus weiter verteilt wird.
Eher grundlegende aber deswegen nicht weniger nützliche Datensätze lassen sich unter dem Stichwort “natural earth” finden. Hier sind Daten wie globale Küstenlinien, mittels Echolot ausgemessene Meerestiefen, aber auch von Menschen geschaffene Dinge wie Landesgrenzen und Städte sehr übersichtlich zu finden.
Im Grunde sind der Vorstellung aber keinerlei Grenzen gesetzt und fast alle denkbaren geographischen Fakten können, manchmal sogar live via Sattelit, mitverfolgt werden. So kann man sich beispielsweise neben aktueller Wolkenbedekung, Regenradar und globaler Oberflächentemperatur des Planeten auch das Abschmelzen der Polkappen seit 1970 ansehen (NSIDC) oder sich live die Blitzeinschläge auf dem gesamten Planeten anschauen – mit Vorhersage darüber, wann und wo der Donner zu hören ist (das funktioniert wirklich! Beispielsweise auf lightningmaps).
Kurzum Geodaten sind neben ihrer wirtschaftlichen Relevanz – vor allem für die Logistik – auch für angehende Data Scientists sehr aufschlussreich und ein wunderbares Spielzeug, mit dem man sich lange beschäftigen und eine Menge interessanter Dinge herausfinden kann.