Posts

Simple RNN

Simple RNN: the first foothold for understanding LSTM

*In this article “Densely Connected Layers” is written as “DCL,” and “Convolutional Neural Network” as “CNN.”

In the last article, I mentioned “When it comes to the structure of RNN, many study materials try to avoid showing that RNNs are also connections of neurons, as well as DCL or CNN.” Even if you manage to understand DCL and CNN, you can be suddenly left behind once you try to understand RNN because it looks like a different field. In the second section of this article, I am going to provide a some helps for more abstract understandings of DCL/CNN , which you need when you read most other study materials.

My explanation on this simple RNN is based on a chapter in a textbook published by Massachusetts Institute of Technology, which is also recommended in some deep learning courses of Stanford University.

First of all, you should keep it in mind that simple RNN are not useful in many cases, mainly because of vanishing/exploding gradient problem, which I am going to explain in the next article. LSTM is one major type of RNN used for tackling those problems. But without clear understanding forward/back propagation of RNN, I think many people would get stuck when they try to understand how LSTM works, especially during its back propagation stage. If you have tried climbing the mountain of understanding LSTM, but found yourself having to retreat back to the foot, I suggest that you read through this article on simple RNNs. It should help you to gain a solid foothold, and you would be ready for trying to climb the mountain again.

*This article is the second article of “A gentle introduction to the tiresome part of understanding RNN.”

1, A brief review on back propagation of DCL.

Simple RNNs are straightforward applications of DCL, but if you do not even have any ideas on DCL forward/back propagation, you will not be able to understand this article. If you more or less understand how back propagation of DCL works, you can skip this first section.

Deep learning is a part of machine learning. And most importantly, whether it is classical machine learning or deep learning, adjusting parameters is what machine learning is all about. Parameters mean elements of functions except for variants. For example when you get a very simple function f(x)=a + bx + cx^2 + dx^3, then x is a variant, and a, b, c, d are parameters. In case of classical machine learning algorithms, the number of those parameters are very limited because they were originally designed manually. Such functions for classical machine learning is useful for features found by humans, after trial and errors(feature engineering is a field of finding such effective features, manually). You adjust those parameters based on how different the outputs(estimated outcome of classification/regression) are from supervising vectors(the data prepared to show ideal answers).
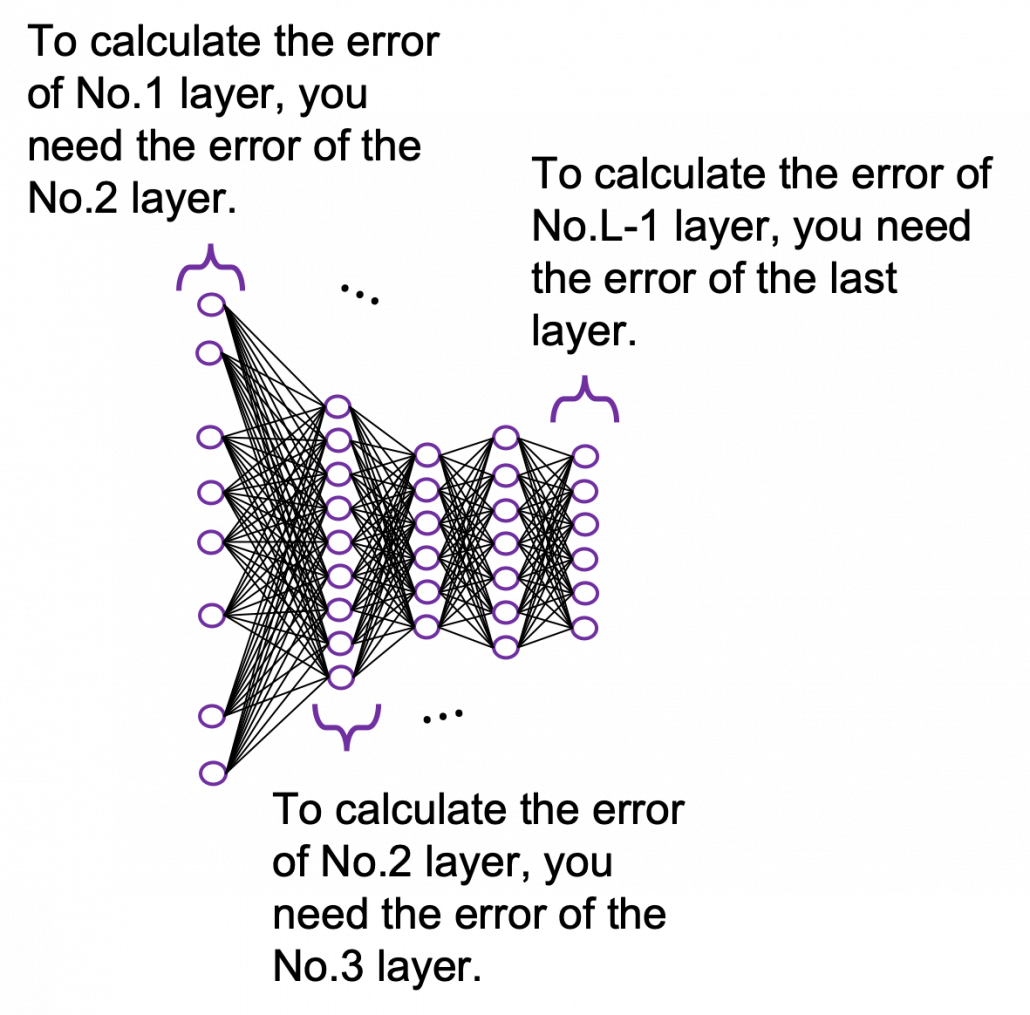
In the last article I said neural networks are just mappings, whose inputs are vectors, matrices, or sequence data. In case of DCLs, inputs are vectors. Then what’s the number of parameters ? The answer depends on the the number of neurons and layers. In the example of DCL at the right side, the number of the connections of the neurons is the number of parameters(Would you like to try to count them? At least I would say “No.”). Unlike classical machine learning you no longer need to do feature engineering, but instead you need to design networks effective for each task and adjust a lot of parameters.

*I think the hype of AI comes from the fact that neural networks find features automatically. But the reality is difficulty of feature engineering was just replaced by difficulty of designing proper neural networks.

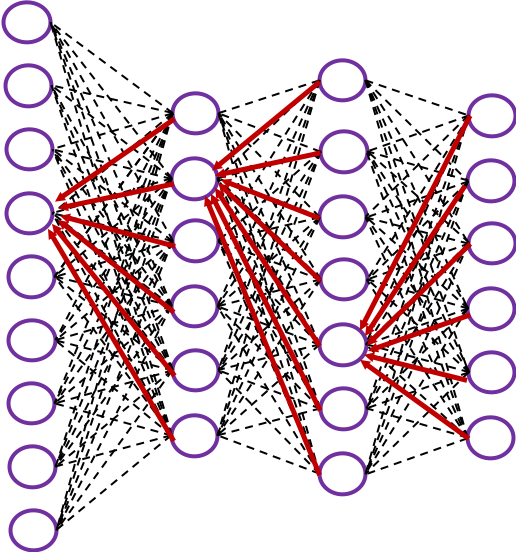
It is easy to imagine that you need an efficient way to adjust those parameters, and the method is called back propagation (or just backprop). As long as it is about DCL backprop, you can find a lot of well-made study materials on that, so I am not going to cover that topic precisely in this article series. Simply putting, during back propagation, in order to adjust parameters of a layer you need errors in the next layer. And in order calculate the errors of the next layer, you need errors in the next next layer.

*You should not think too much about what the “errors” exactly mean. Such “errors” are defined in this context, and you will see why you need them if you actually write down all the mathematical equations behind backprops of DCL.

The red arrows in the figure shows how errors of all the neurons in a layer propagate backward to a neuron in last layer. The figure shows only some sets of such errors propagating backward, but in practice you have to think about all the combinations of such red arrows in the whole back propagation(this link would give you some ideas on how DCLs work).
These points are minimum prerequisites for continuing reading this  RNN this article. But if you are planning to understand RNN forward/back propagation at  an abstract/mathematical level that you can read academic papers,  I highly recommend you to actually write down all the equations of DCL backprop. And if possible you should try to implement backprop of three-layer DCL.

2, Forward propagation of simple RNN

*For better understandings of the second and third section, I recommend you to download an animated PowerPoint slide which I prepared. It should help you understand simple RNNs.
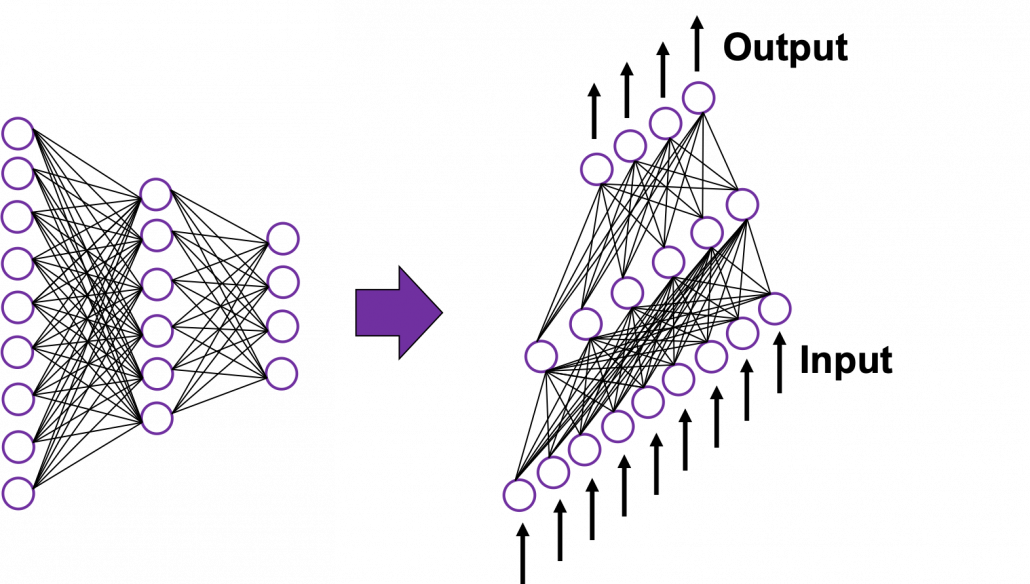
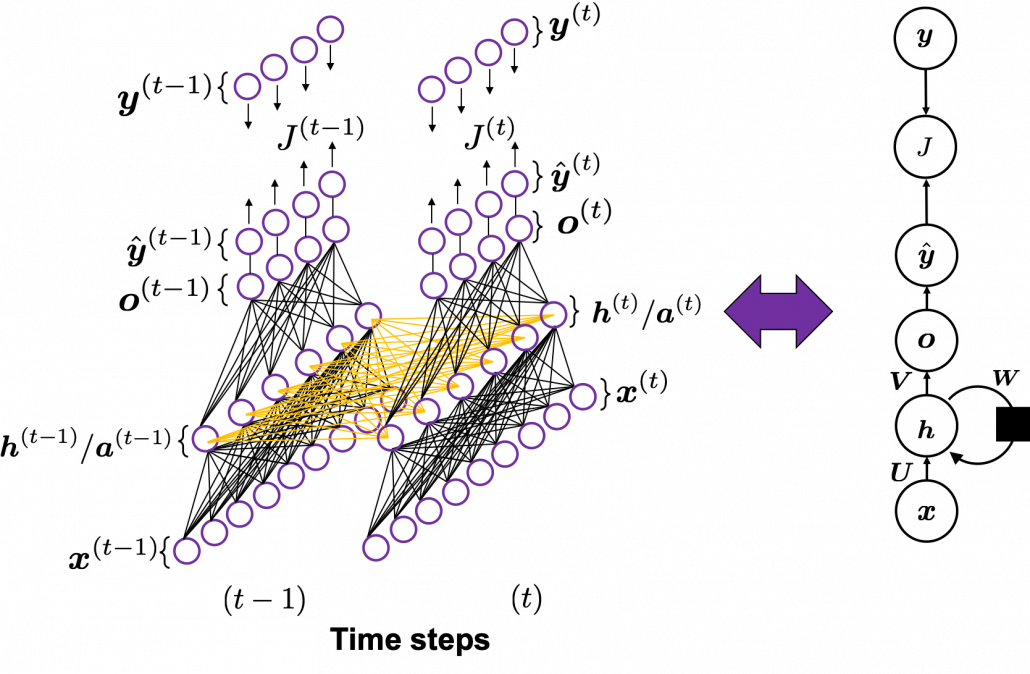
In fact the simple RNN which we are going to look at in this article has only three layers. From now on imagine that inputs of RNN come from the bottom and outputs go up. But RNNs have to keep information of earlier times steps during upcoming several time steps because as I mentioned in the last article RNNs are used for sequence data, the order of whose elements is important. In order to do that, information of the neurons in the middle layer of RNN propagate forward to the middle layer itself. Therefore in one time step of forward propagation of RNN, the input at the time step propagates forward as normal DCL, and the RNN gives out an output at the time step. And information of one neuron in the middle layer propagate forward to the other neurons like yellow arrows in the figure. And the information in the next neuron propagate forward to the other neurons, and this process is repeated. This is called recurrent connections of RNN.

*To be exact we are just looking at a type of recurrent connections. For example Elman RNNs have simpler recurrent connections. And recurrent connections of LSTM are more complicated.
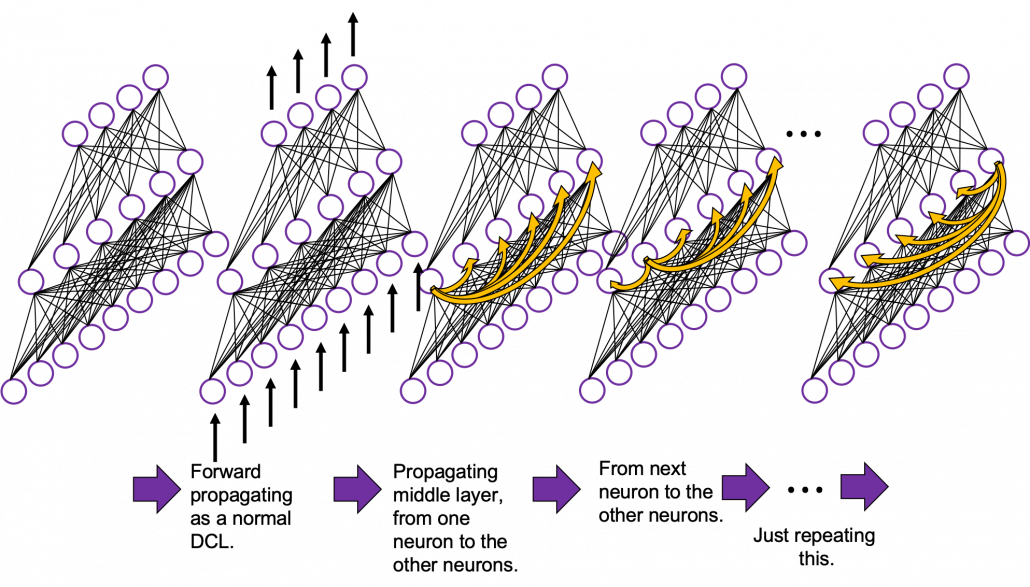
Whether it is a simple one or not, basically RNN repeats this process of getting an input at every time step, giving out an output, and making recurrent connections to the RNN itself. But you need to keep the values of activated neurons at every time step, so virtually you need to consider the same RNNs duplicated for several time steps like the figure below. This is the idea of unfolding RNN. Depending on contexts, the whole unfolded DCLs with recurrent connections is also called an RNN.
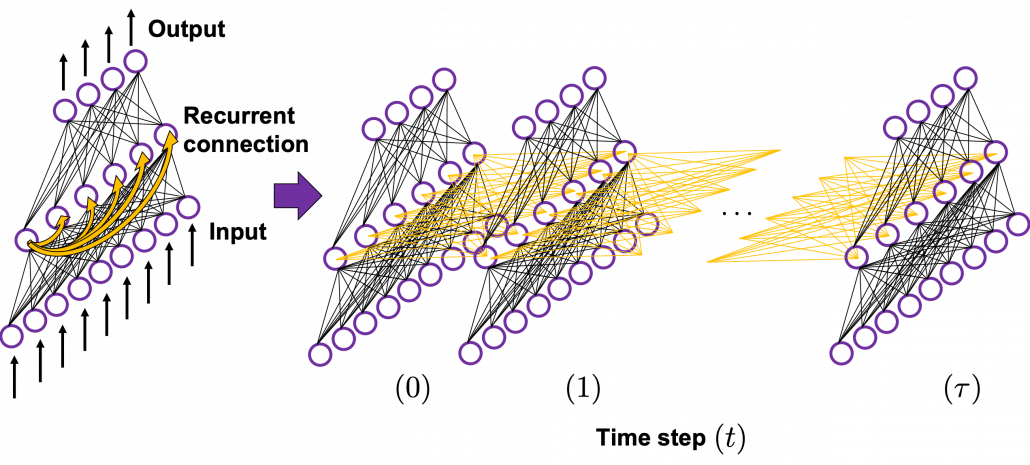
In many situations, RNNs are simplified as below. If you have read through this article until this point, I bet you gained some better understanding of RNNs, so you should little by little get used to this more abstract, blackboxed  way of showing RNN.
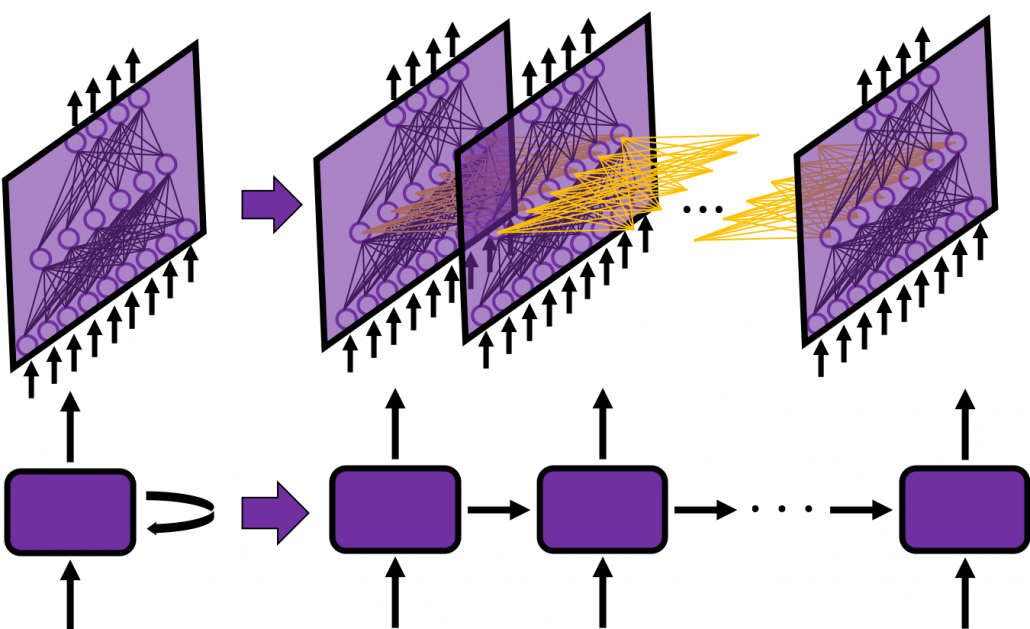
You have seen that you can unfold an RNN, per time step. From now on I am going to show the simple RNN in a simpler way,  based on the MIT textbook which I recomment. The figure below shows how RNN propagate forward during two time steps (t-1), (t).

The input \boldsymbol{x}^{(t-1)}at time step(t-1) propagate forward as a normal DCL, and gives out the output \hat{\boldsymbol{y}} ^{(t)} (The notation on the \boldsymbol{y} ^{(t)} is called “hat,” and it means that the value is an estimated value. Whatever machine learning tasks you work on, the outputs of the functions are just estimations of ideal outcomes. You need to adjust parameters for better estimations. You should always be careful whether it is an actual value or an estimated value in the context of machine learning or statistics). But the most important parts are the middle layers.
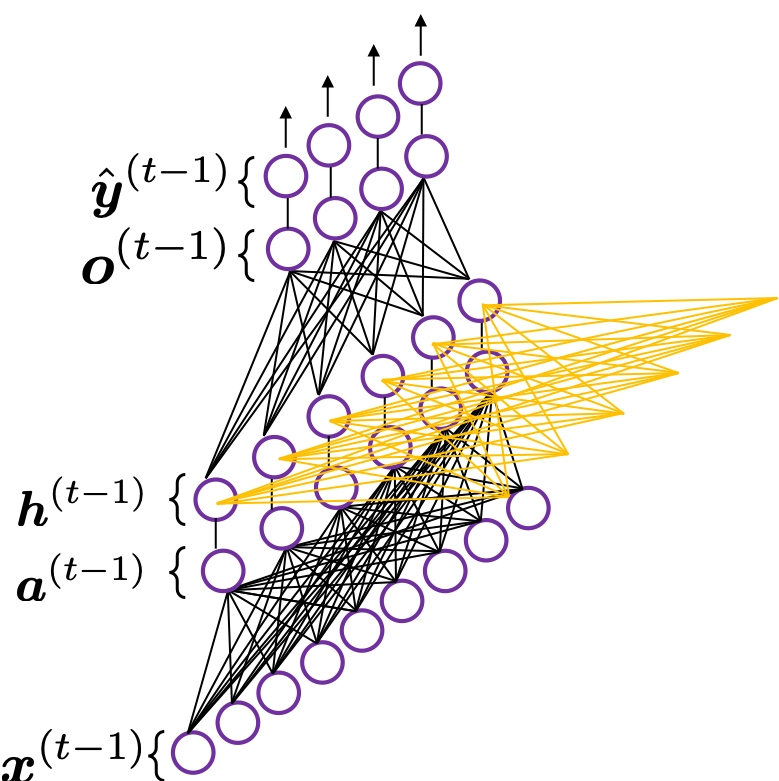
*To be exact I should have drawn the middle layers as connections of two layers of neurons like the figure at the right side. But I made my figure closer to the chart in the MIT textbook, and also most other study materials show the combinations of the two neurons before/after activation as one neuron.

\boldsymbol{a}^{(t)} is just linear summations of \boldsymbol{x}^{(t)} (If you do not know what “linear summations” mean, please scroll this page a bit), and \boldsymbol{h}^{(t)} is a combination of activated values of \boldsymbol{a}^{(t)} and linear summations of \boldsymbol{h}^{(t-1)} from the last time step, with recurrent connections. The values of \boldsymbol{h}^{(t)} propagate forward in two ways. One is normal DCL forward propagation to \hat{\boldsymbol{y}} ^{(t)} and \boldsymbol{o}^{(t)}, and the other is recurrent connections to \boldsymbol{h}^{(t+1)} .

These are equations for each step of forward propagation.

  • \boldsymbol{a}^{(t)} = \boldsymbol{b} + \boldsymbol{W} \cdot \boldsymbol{h}^{(t-1)} + \boldsymbol{U} \cdot \boldsymbol{x}^{(t)}
  • \boldsymbol{h}^{(t)}= g(\boldsymbol{a}^{(t)})
  • \boldsymbol{o}^{(t)} = \boldsymbol{c} + \boldsymbol{V} \cdot \boldsymbol{h}^{(t)}
  • \hat{\boldsymbol{y}} ^{(t)} = f(\boldsymbol{o}^{(t)})

*Please forgive me for adding some mathematical equations on this article even though I pledged not to in the first article. You can skip the them, but for some people it is on the contrary more confusing if there are no equations. In case you are allergic to mathematics, I prescribed some treatments below.

*Linear summation is a type of weighted summation of some elements. Concretely, when you have a vector \boldsymbol{x}=(x_0, x_1, x_2), and weights \boldsymbol{w}=(w_0,w_1, w_2), then \boldsymbol{w}^T \cdot \boldsymbol{x} = w_0 \cdot x_0 + w_1 \cdot x_1 +w_2 \cdot x_2 is a linear summation of \boldsymbol{x}, and its weights are \boldsymbol{w}.

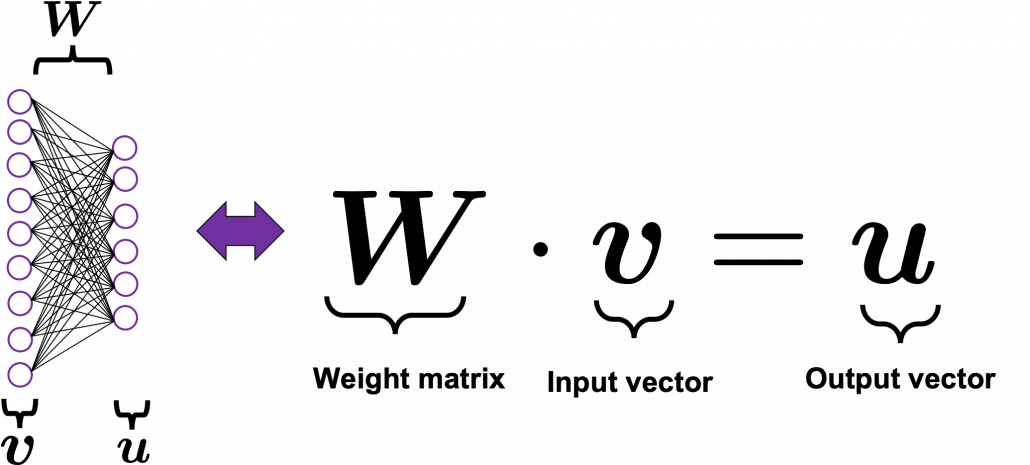
*When you see a product of a matrix and a vector, for example a product of \boldsymbol{W} and \boldsymbol{v}, you should clearly make an image of connections between two layers of a neural network. You can also say each element of \boldsymbol{u}} is a linear summations all the elements of \boldsymbol{v}} , and \boldsymbol{W} gives the weights for the summations.

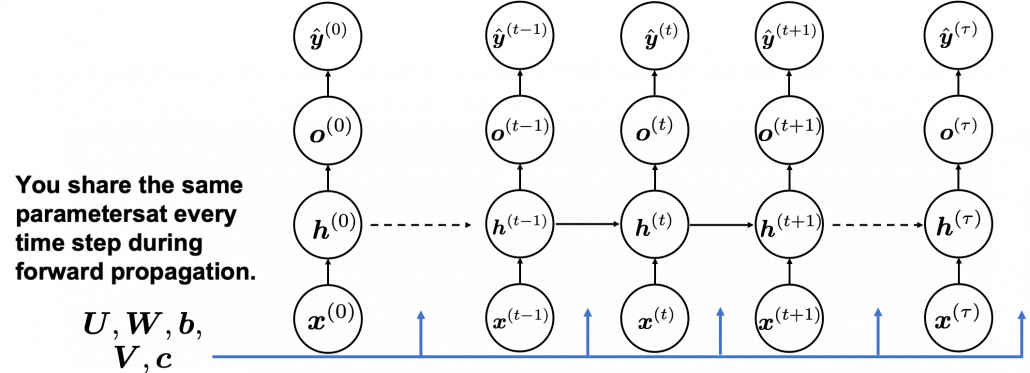
A very important point is that you share the same parameters, in this case \boldsymbol{\theta \in \{\boldsymbol{U}, \boldsymbol{W}, \boldsymbol{b}, \boldsymbol{V}, \boldsymbol{c} \}}, at every time step. 

And you are likely to see this RNN in this blackboxed form.

3, The steps of back propagation of simple RNN

In the last article, I said “I have to say backprop of RNN, especially LSTM (a useful and mainstream type or RNN), is a monster of chain rules.” I did my best to make my PowerPoint on LSTM backprop straightforward. But looking at it again, the LSTM backprop part still looks like an electronic circuit, and it requires some patience from you to understand it. If you want to understand LSTM at a more mathematical level, understanding the flow of simple RNN backprop is indispensable, so I would like you to be patient while understanding this step (and you have to be even more patient while understanding LSTM backprop).

This might be a matter of my literacy, but explanations on RNN backprop are very frustrating for me in the points below.

  • Most explanations just show how to calculate gradients at each time step.
  • Most study materials are visually very poor.
  • Most explanations just emphasize that “errors are back propagating through time,” using tons of arrows, but they lack concrete instructions on how actually you renew parameters with those errors.

If you can relate to the feelings I mentioned above, the instructions from now on could somewhat help you. And with the animated PowerPoint slide I prepared, you would have clear understandings on this topic at a more mathematical level.

Backprop of RNN , as long as you are thinking about simple RNNs, is not so different from that of DCLs. But you have to be careful about the meaning of errors in the context of RNN backprop. Back propagation through time (BPTT) is one of the major methods for RNN backprop, and I am sure most textbooks explain BPTT. But most study materials just emphasize that you need errors from all the time steps, and I think that is very misleading and confusing.
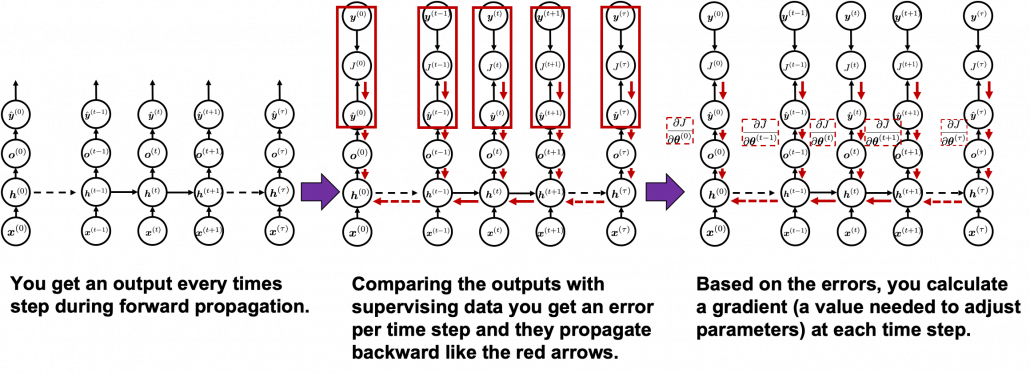
You need all the gradients to adjust parameters, but you do not necessarily need all the errors to calculate those gradients. Gradients in the context of machine learning mean partial derivatives of error functions (in this case J) with respect to certain parameters, and mathematically a gradient of J with respect to \boldsymbol{\theta \in \{\boldsymbol{U}, \boldsymbol{W}, \boldsymbol{b}^{(t)}, \boldsymbol{V}, \boldsymbol{c} \}}is denoted as ( \frac{\partial J}{\partial \boldsymbol{\theta}}  ). And another confusing point in many textbooks, including the MIT one, is that they give an impression that parameters depend on time steps. For example some study materials use notations like \frac{\partial J}{\partial \boldsymbol{\theta}^{(t)}}, and I think this gives an impression that this is a gradient with respect to the parameters at time step (t). In my opinion this gradient rather should be written as ( \frac{\partial J}{\partial \boldsymbol{\theta}} )^{(t)} . But many study materials denote gradients of those errors in the former way, so from now on let me use the notations which you can see in the figures in this article.

In order to calculate the gradient \frac{\partial J}{\partial \boldsymbol{x}^{(t)}} you need errors from time steps s (s \geq t) \quad (as you can see in the figure, in order to calculate a gradient in a colored frame, you need all the errors in the same color).
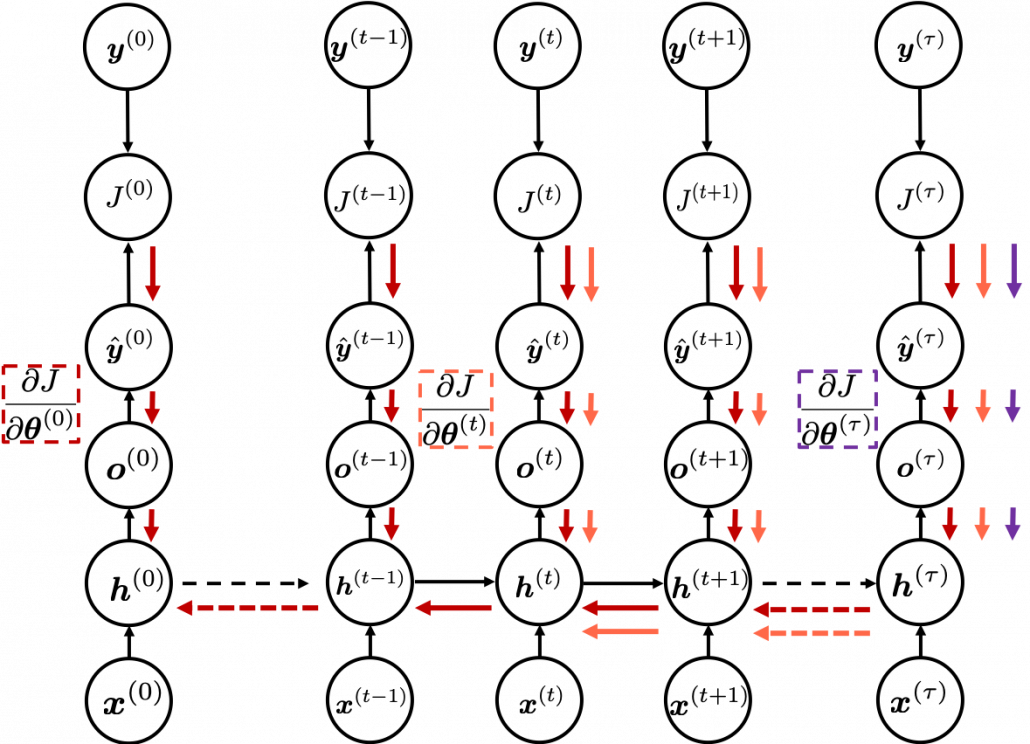
*To be exact, in the figure above I am supposed prepare much more arrows in \tau + 1 different colors  to show the whole process of RNN backprop, but that is not realistic. In the figure I displayed only the flows of errors necessary for calculating each gradient at time step 0, t, \tau.

*Another confusing point is that the \frac{\partial J}{\partial \boldsymbol{\ast ^{(t)}}}, \boldsymbol{\ast} \in \{\boldsymbol{a}^{(t)}, \boldsymbol{h}^{(t)}, \boldsymbol{o}^{(t)}, \dots \} are correct notations, because \boldsymbol{\ast} are values of neurons after forward propagation. They depend on time steps, and these are very values which I have been calling “errors.” That is why parameters do not depend on time steps, whereas errors depend on time steps.

As I mentioned before, you share the same parameters at every time step. Again, please do not assume that parameters are different from time step to time step. It is gradients/errors (you need errors to calculate gradients) which depend on time step. And after calculating errors at every time step, you can finally adjust parameters one time, and that’s why this is called “back propagation through time.” (It is easy to imagine that this method can be very inefficient. If the input is the whole text on a Wikipedia link, you need to input all the sentences in the Wikipedia text to renew parameters one time. To solve this problem there is a backprop method named “truncated BPTT,” with which you renew parameters based on a part of a text. )

And after calculating those gradients \frac{\partial J}{\partial \boldsymbol{\theta}^{(t)}} you can take a summation of them: \frac{\partial J}{\partial \boldsymbol{\theta}}=\sum_{t=0}^{t=\tau}{\frac{\partial J}{\partial \boldsymbol{\theta}^{(t)}}}. With this gradient \frac{\partial J}{\partial \boldsymbol{\theta}} , you can finally renew the value of \boldsymbol{\theta} one time.

At the beginning of this article I mentioned that simple RNNs are no longer for practical uses, and that comes from exploding/vanishing problem of RNN. This problem was one of the reasons for the AI winter which lasted for some 20 years. In the next article I am going to write about LSTM, a fancier type of RNN, in the context of a history of neural network history.

* I make study materials on machine learning, sponsored by DATANOMIQ. I do my best to make my content as straightforward but as precise as possible. I include all of my reference sources. If you notice any mistakes in my materials, including grammatical errors, please let me know (email: yasuto.tamura@datanomiq.de). And if you have any advice for making my materials more understandable to learners, I would appreciate hearing it.

Funktionsweise künstlicher neuronaler Netze

Künstliche neuronale Netze sind ein Spezialbereich des maschinellen Lernens, der sogar einen eigenen Trendbegriff hat: Deep Learning.
Doch wie funktioniert ein künstliches neuronales Netz überhaupt? Und wie wird es in Python realisiert? Dies ist Artikel 2 von 6 der Artikelserie –Einstieg in Deep Learning.

Gleich vorweg, wir beschränken uns hier auf die künstlichen neuronalen Netze des überwachten maschinellen Lernens. Dafür ist es wichtig, dass das Prinzip des Trainings und Testens von überwachten Verfahren verstanden ist. Künstliche neuronale Netze können aber auch zur unüberwachten Dimensionsreduktion und zum Clustering eingesetzt werden. Das bekannteste Verfahren ist das AE-Net (Auto Encoder Network), das hier aus der Betrachtung herausgenommen wird.

Beginnen wir mit einfach künstlichen neuronalen Netzen, die alle auf dem Perzeptron als Kernidee beruhen. Das Vorbild für künstliche neuronale Netze sind natürliche neuronale Netze, wie Sie im menschlichen Gehirn zu finden sind.

Perzeptron

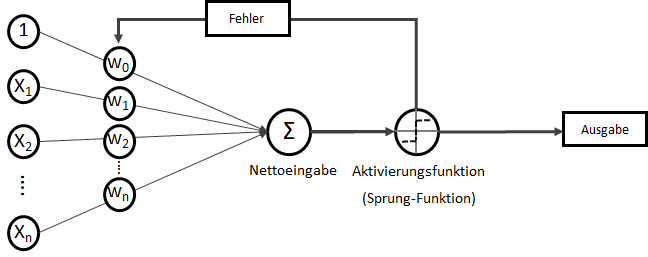
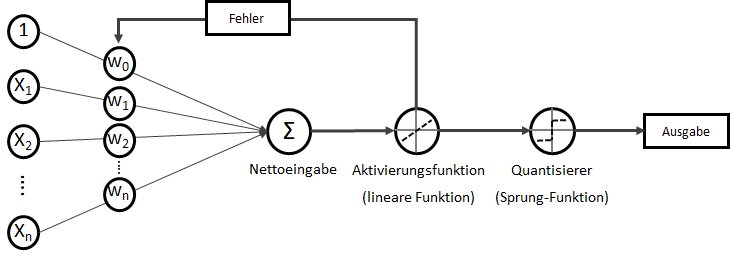
Das Perzeptron (engl. Perceptron) ist ein „Klassiker“ unter den künstlichen neuronalen Netzen. Wenn von einem neuronalen Netz gesprochen wird, ist meistens ein Perzeptron oder eine Variation davon gemeint. Perzeptrons sind mehrschichtige Netze ohne Rückkopplung, mit festen Eingabe- und Ausgabeschichten. Es gibt keine absolut einheitliche Definition eines Perzeptrons, in der Regel ist es jedoch ein reines FeedForward-Netz mit einer Input-Schicht (auch Abtast-Schicht oder Retina genannt) mit statisch oder dynamisch gewichteten Verbindungen zur Ausgabe-Schicht, die (als Single-Layer-Perceptron) aus einem einzigen Neuron besteht. Das eine Neuron setzt sich aus zwei mathematischen Funktionen zusammen: Einer Berechnung der Nettoeingabe und einer Aktivierungsfunktion, die darüber entscheidet, ob die berechnete Nettoeingabe im Brutto nun “feuert” oder nicht. Es ist in seiner Ausgabe folglich binär: Man kann es sich auch als kleines Lämpchen vorstellen, so dass abhängig von den Eingabewerten und den Gewichtungen eine Nettoeingabe (Summe) bildet und eine Sprungfunktion darüber entscheidet, ob am Ende das Lämpchen leuchtet oder nicht. Dieses Konzept der Ausgabeerzeugung wird Forward-Propagation genannt.

Single-Layer-Perceptron

Auch wenn “Netz” für ein einzelnes Perzeptron mit seinem einen Neuron etwas übertrieben wirken mag, ist es doch die Grundlage für viele größere und mehrschichtige Netze.

Betrachten wir nun die Mathematik der Forward-Propagation.

Wir haben eine Menge an Eingabewerten x_0, x_1 \dots x_n. Wobei für x_0 als Bias-Input stets gilt: x_0 = 1,0. Der Bias-Input ist nur ein Platzhalter für das wichtige Bias-Gewicht.

    \[ x = \begin{bmatrix} x_0\\ x_1\\ x_2\\ x_3\\ \vdots\\ x_n \end{bmatrix} \]


Für jede Eingabevariable wird eine Gewichtsvariable benötigt: w_0, w_1 \dots w_n

    \[ w = \begin{bmatrix} w_0\\ w_1\\ w_2\\ w_3\\ \vdots\\ w_n \end{bmatrix} \]

Jedes Produkt aus Eingabewert und Gewichtung soll in Summe die Nettoeingabe z bilden. Hier zeigt sich z als lineare mathematische Funktion, die zwei-dimensional leicht als z = w_0 + w_1 \cdot x_1 mit w_0 als Y-Achsenschnitt wenn x_1 = 0.

    \[ z = w_0 \cdot x_0 + w_1 \cdot x_1 + \dots + w_n \cdot x_n \]

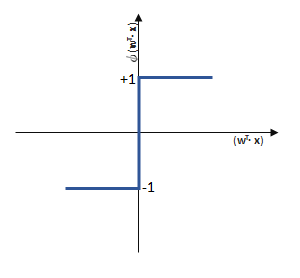
Die lineare Funktion wird nur durch die Sprungfunktion als sogenannte Aktivierungsfunktion zu einer binären Klasseneinteilung (siehe hierzu: Machine Learning – Regression vs Klassifikation), denn wenn z einen festzulegenden Schwellwert \theta überschreitet, liefert die Sprungfunktion \phi mit der Eingabe z einen anderen Wert als wenn dieser Schwellwert nicht überschritten wird.

(1)   \begin{equation*} \phi(z) = \begin{cases} 1 & \text{wenn } z \le \theta \\ -1 & \text{wenn } z < \theta \\ \end{cases} \end{equation*}

Die Definition dieser Aktivierungsfunktion ist der Kern der Klassifikation und viele erweiterte künstliche neuronale Netze unterscheiden sich im Wesentlichen vom Perzeptron dadurch, dass die Aktivierungsfunktion komplexer ist, als eine reine Sprungfunktion, beispielsweise als Sigmoid-Funktion (basierend auf der logistischen Funktion) oder die Tangens hyperbolicus (tanh) -Funktion. Mehr darüber dann im nächsten Artikel dieser Artikelserie, bleiben wir also bei der einfachen Sprungfunktion.

Künstliche neuronale Netze sind im Grunde nichts anderes als viel-dimensionale, mathematische Funktionen, die durch Schaltung als Neuronen nebeneinander (Neuronen einer Schicht) und hintereinander (mehrere Schichten) eine enorme Komplexität erfassen können. Die Gewichtungen sind dabei die Stellschraube, die die Form der mathematischen Funktion gestaltet, aus Geraden und Kurven, um eine Punktwolke zu beschreiben (Regression) oder um Klassengrenzen zu identifizieren (Klassifikation).

Eine andere Sichtweise auf künstliche neuronale ist die des Filters: Ein künstliches neuronales Netz nimmt alle Eingabe-Variablen entgegen (z. B. alle Pixel eines Bildes) und über ein Training werden die Gewichtungen (die Form des Filters) so gestaltet, dass der Filter immer zu richtigen Klasse (im Kontext der Bildklassifikation: die Objektklasse) führt.


Kommen wir nochmal kurz zurück zu der Berechnung der Nettoeingabe z. Da diese Schreibweise…

    \[ z = w_0 \cdot x_0 + w_1 \cdot x_1 + \dots + w_n \cdot x_n \]

… recht anstrengend ist, schreiben Fortgeschrittene der linearen Algebra lieber z = w^T \cdot x.

    \[ z = w^T \cdot x \]

Das hochgestellte T steht dabei für transponieren. Transponieren bedeutet, dass Spalten zu Zeilen werden – oder umgekehrt.

Beispielsweise befüllen wir zwei Vektoren x und w mit beispielhaften Inhalten:

Eingabewerte:

    \[ x = \begin{bmatrix} 5\\ 12\\ 30\\ 2 \end{bmatrix} \]

Gewichtungen:

    \[ w = \begin{bmatrix} 1\\ 2\\ 5\\ 12 \end{bmatrix} \]

Kann nun die Nettoeingabe z berechnet werden, denn der Gewichtungsvektor wird vom Spaltenvektor zum Zeilenvektor. So kann – mathematisch korrekt dargestellt – jedes Element des einen Vektors mit dem zugehörigen Element des anderen Vektors multipliziert werden, die dabei entstehenden Ergebniswerte werden summiert.

    \[ z = w^T \cdot x = \big[1\text{ }2\text{ }5\text{ }12\big] \cdot \begin{bmatrix} 5\\ 12\\ 30\\ 2 \end{bmatrix} = 1 \cdot 5 + 2 \cdot 12 + 5 \cdot 30 + 12 \cdot 2 = 203 \]


Zurück zur eigentlichen Aufgabe des künstlichen neuronalen Netzes: Klassifikation! (Regression, Clustering und Dimensionsreduktion blenden wir ja in diesem Artikel als Aufgabe aus 🙂

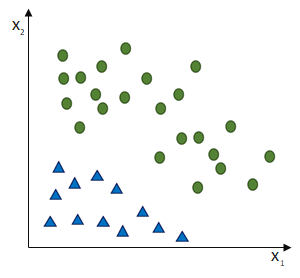
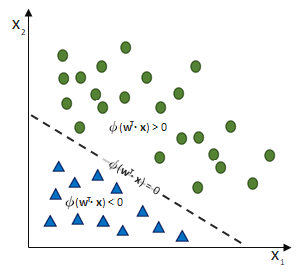
Das Perzeptron soll zwei Klassen trennen. Dafür sollen alle Eingaben richtig gewichtet werden, so dass die entstehende Nettoeingabe z die Sprungfunktion dann aktiviert, wenn der Datensatz nicht für die eine, sondern für die andere Klasse ausweist.

Da wir es mit einer linearen Funktion z zutun haben, ist die Konvergenz (= Passgenauigkeit des Models mit der Realität) eines Single-Layer-Perzeptrons nur für lineare Trennbarkeit möglich!

Training des Perzeptron-Netzes

Die Aufgabe ist nun, die richtigen Gewichte zu finden – und nicht nur irgendwelche richtigen, sondern genau die optimalen. Die Frage, die sich für jedes künstliche neuronale Netz stellt, ist die nach den richtigen Gewichtungen. Das Training eines Perzeptron ist vergleichsweise einfach, gerade weil es binär ist. Denn binär bedeutet auch, dass wenn eine falsche Antwort gegeben wurde, muss das jeweils andere mögliche Ergebnis korrekt sein.

Das Training eines Perzeptrons funktioniert wie folgt:

  1. Setze alle Gewichtungen auf den Wert 0,00
  2. Mit jedem Datensatz des Trainings
    1. Berechne den Ausgabewert \^{y}
    2. Vergleiche den Ausgabewert \^{y} mit dem tatsächlichen Ergebnis y
    3. Aktualisiere die Gewichtungen entgegen des Fehlers: w_i = w_i + \Delta w_i

Wobei die Gewichtsanpassung \Delta w_i entgegen des Fehlers (bzw. hin zur jeweils anderen möglichen Antwort) geschieht:

\Delta w_i = (\^{y}_j - y_j ) \cdot x_i

Anmerkung für die Experten: Die Schrittweite \eta blenden wir hier einfach mal aus. Bitte einfach von \eta = 1.0 ausgehen.

\Delta w_i ist die Differenz aus der Prädiktion und dem tatsächlichen Ergebnis (Klasse). Alle Gewichtungen werden mit jedem Fehler gleichzeitig aktualisiert. Sind alle Gewichtungen aktualisiert, kommt der nächste Durchlauf (erneuter Vergleich zwischen \^{y} und y), nicht zu vergessen ist dabei natürlich die Abhängigkeit von den Eingabewerten x:

\Delta w_0 = (\^{y}_j - y_j ) \cdot x_0

\Delta w_2 = (\^{y}_j - y_j ) \cdot x_1

\Delta w_2 = (\^{y}_j - y_j) \cdot x_2

\Delta w_n = (\^{y}_j - y_j) \cdot x_n

Training eines Perzeptrons

Das Training im überwachten Lernen basiert immer auf der Idee, den Ausgabe-Fehler (die Differenz zwischen Prädiktion und tatsächlich korrektem Ergebnis) zu betrachten und die Klassifikationslogik an den richtigen Stellschrauben (bei neuronalen Netzen sind das die Gewichtungen) entgegen des Fehlers anzupassen.

Richtige Klassifikations-Situationen können True-Positives und True-Negatives darstellen, die zu keiner Gewichtsanpassung führen sollen:

True-Positive -> Klassifikation: 1 | korrekte Klasse: 1

\Delta w_i = (\^{y}_j - y_j) \cdot x_i = (1 - 1) \cdot x_i = 0

True-Negative-> Klassifikation: -1 | korrekte Klasse: -1

\Delta w_i = (\^{y}_j - y_j) \cdot x_i = (-1 - -1) \cdot x_i = 0

Falsche Klassifikationen erzeugen einen Fehler, der zu einer Gewichtsanpassung entgegen des Fehlers führen soll:

False-Positive -> Klassifikation: 1 | korrekte Klasse: -1

\Delta w_i = (\^{y}_j - y_j) \cdot x_i = (1 - -1) \cdot x_i = 2 \cdot x_i

False-Negative -> Klassifikation: -1 | korrekte Klasse: 1

\Delta w_i = (\^{y}_j - y_j) \cdot x_i = (-1 - 1) \cdot x_i = -2 \cdot x_i

Imaginäres Trainingsbeispiel eines Single-Layer-Perzeptrons (SLP)

Nehmen wir an, dass x_1 = 0,5 ist und das SLP irrtümlicherweise die Klasse \^{y_1} = -1 ausgewiesen hat, obwohl die korrekte Klasse y_1 = +1 wäre. (Und die Schrittweite lassen wir bei \eta = 1,0)

Dann passiert folgendes:

\Delta w_1 = (\^{y}_1 - y_1) \cdot x_1 = (-1 - 1) \cdot 0,5 = -2,0 \cdot 0,5 = -1,0

Die Gewichtung w_1 verringert sich entsprechend w_1 = w_1 + \Delta w_1 = w_1 - 1,0 und somit wird die Wahrscheinlichkeit größer, dass wenn bei der nächsten Iteration (j=1) wieder die Klasse +1 korrekt sei,  den Schwellwert \phi(z) zu unterschreiten und auf eben diese korrekte Klasse zu stoßen.

Die Aktualisierung der Gewichtung \Delta w_i ist proportional zu x_i. So würde beispielsweise ein neues x_1=2,0 (bei Iteration j=2) zu einer irrtümlichen Klassifikation \^(y_2) = -1 (y_2 = +1) führen, würde die Entscheidungsgrenze zur korrekten Prädiktion der Klasse beim nächsten Durchlauf (j = 3) an w_1 noch weiter in die gleiche Richtung verschoben werden:

\Delta w_1 = (\^{y}_2 - y_2) \cdot x_1 = (-1 - 1) \cdot 2,0 = -2,0 \cdot 2,0 = -4,0

Mehr zum Training von künstlichen neuronalen Netzen ist im nächsten Artikel dieser Artikelserie zu erfahren.

Single-Layer-Perzeptrons (SLP) – Beispiel mit der boolischen Trennung

Verlassen wir nun das Training des Perzeptrons und gehen einfach mal davon aus, dass die idealen Gewichte schon gefunden wurden und schauen uns nun an, was ein Perzeptron alles (nicht) kann. Denn nicht vergessen, es soll eigentlich Klassen unterscheiden bzw. die dafür nötigen Entscheidungsgrenzen finden.

Boolische Operatoren unterscheiden Fälle nach boolischen Werten. Sie sind ein beliebtes “Hello World” für die Einarbeitung in die lineare Entscheidungslogik eines Perzeptrons. Es gibt drei grundlegende boolische Vergleichsoperatoren: AND, OR und XOR

  x1     x2   AND OR XOR
0 0 0 0 0
0 1 0 1 1
1 0 0 1 1
1 1 1 1 0

Ein Perzeptron zur Lösung dieser Aufgabe bräuchte also zwei Dimensionen (+ Bias): x_1 und x_2
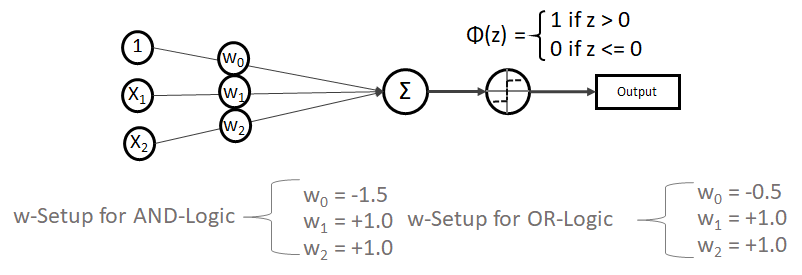
Und es müsste Gewichtungen haben, die dafür sorgen, dass die Vorhersage entsprechend der Logik AND, OR oder XOR mit \^{y} = \phi(z) = \phi (w_0 \cdot 1 + w_1 \cdot x_1 + w_2 \cdot x_2) funktioniert.

Dabei ist es wichtig, dass wir auch phi \phi als Sprungfunktion definieren. Sie könnte beispielsweise so aussehen, dass sie auf den Wert \phi(z) = 1 springt, wenn z > 0 ist, ansonsten aber \phi(z) = 0 bleibt.

Das Netz und die Gewichtungen (w-Setup) könnten für die AND- und die OR-Logik so aussehen:

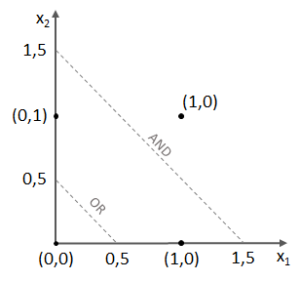
Die Gewichtungen funktionieren beim SLP problemlos, denn wir haben es mit linear trennbaren Problemen zutun:

Kleiner Test gefällig? So nehmen wir uns erstmal die AND-Logik vor:

  • Wenn x1 = 0 und x2 = 0 ist, gilt: z = -1,5 \cdot 1 + 1 \cdot 0 + 1 \cdot 0 = - 1,5,
    wie erhalten als Prädiktion \phi(z) = \phi(-1,5) = 0
  • Wenn x1 = 1 und x2 = 0 ist, gilt: z = -1,5 \cdot 1 + 1 \cdot 1 + 1 \cdot 0 = - 0,5,
    wie erhalten als Prädiktion \phi(z) = \phi(-0,5) = 0
  • Wenn x1 = 1 und x2 = 1 ist, gilt: z = -1,5 \cdot 1 + 1 \cdot 1 + 1 \cdot 1 = + 0,5,
    wie erhalten als Prädiktion \phi(z) = \phi(0,5) = 1

Scheint zu funktionieren!

Und dann die OR-Logik mit

  • Wenn x1 = 0 und x2 = 0 ist, gilt: z = -0,5 \cdot 1 + 1 \cdot 0 + 1 \cdot 0 = - 0,5,
    wie erhalten als Prädiktion \phi(z) = \phi(-0,5) = 0
  • Wenn x1 = 1 und x2 = 0 ist, gilt: z = -0,5 \cdot 1 + 1 \cdot 1 + 1 \cdot 0 = + 0,5,
    wie erhalten als Prädiktion \phi(z) = \phi(0,5) = 1
  • Wenn x1 = 1 und x2 = 1 ist, gilt: z = -0,5 \cdot 1 + 1 \cdot 1 + 1 \cdot 1 = + 1,5,
    wie erhalten als Prädiktion \phi(z) = \phi(1,5) = 1

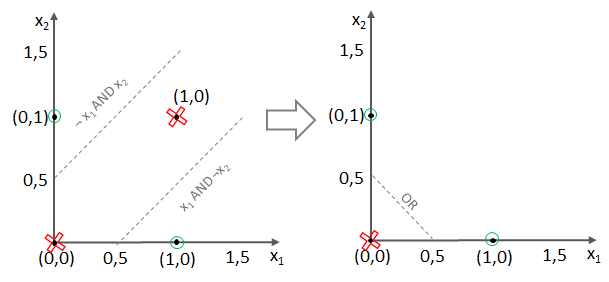
Super! Jedoch stellt sich nun die Frage, wie das XOR-Problem zu lösen ist, denn das bedingt sowohl die Grenzen von AND als auch jene des OR-Operators.

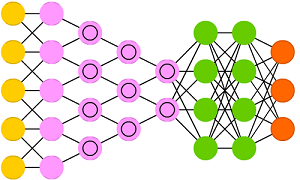
Multi-Layer-Perzeptron (MLP) bzw. (Deep) Feed Forward (FF) Net

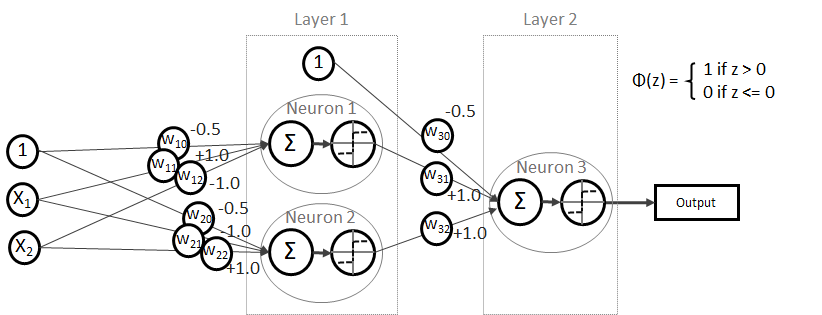
Denn ein XOR kann mathematisch auch so korrekt beschrieben werden: x_1 \text{ xor } x_2 = (x_1 \text{ and } \neg x_2) \text{ or } (\neg x_1 \text{ and } x_2)

Testen wir es aus!

  • Wenn x1 = 0 und x2 = 0 ist, gilt:
    z_1 = w_{10} \cdot 1 + w_{11} \cdot x1 + w_{12} \cdot  x2 = -0.5 \cdot 1 + 1,0 \cdot 0 - 1,0 \cdot 0 = -0,5 und somit \phi(z_1) = \phi(-0,5) = 0
    z_2 = w_{20} \cdot 1 + w_{21} \cdot x1 + w_{22} \cdot  x2 = -0.5 \cdot 1 - 1,0 \cdot 0 + 1,0 \cdot 0 = -0,5 und somit \phi(z_2) = \phi(-0,5) = 0
    z_3 = w_{30} \cdot 1 + w_{31} \cdot \phi(z_1) + w_{32} \cdot \phi(z_2) = -0,5 \cdot 1 + 1,0 \cdot 0 + 1,0 \cdot 0 = -0,5 und somit \phi(z_3) = \phi(-0,5) = 0
  • Wenn x1 = 1 und x2 = 0 ist, gilt:
    z_1 = w_{10} \cdot 1 + w_{11} \cdot x1 + w_{12} \cdot  x2 = -0.5 \cdot 1 + 1,0 \cdot 1 - 1,0 \cdot 0 = 0,5 und somit \phi(z_1) = \phi(0,5) = 1
    z_2 = w_{20} \cdot 1 + w_{21} \cdot x1 + w_{22} \cdot  x2 = -0.5 \cdot 1 - 1,0 \cdot 1 + 1,0 \cdot 0 = -1,5 und somit \phi(z_2) = \phi(-1,5) = 0
    z_3 = w_{30} \cdot 1 + w_{31} \cdot \phi(z_1) + w_{32} \cdot \phi(z_2) = -0,5 \cdot 1 + 1,0 \cdot 1 + 1,0 \cdot 0 = 0,5 und somit \phi(z_3) = \phi(0,5) = 1
  • Wenn x1 = 0 und x2 = 1 ist, gilt:
    z_1 = w_{10} \cdot 1 + w_{11} \cdot x1 + w_{12} \cdot  x2 = -0.5 \cdot 1 + 1,0 \cdot 0 - 1,0 \cdot 1 = -1,5 und somit \phi(z_1) = \phi(-1,5) = 0
    z_2 = w_{20} \cdot 1 + w_{21} \cdot x1 + w_{22} \cdot  x2 = -0.5 \cdot 1 - 1,0 \cdot 0 + 1,0 \cdot 1 = 0,5 und somit \phi(z_2) = \phi(0,5) = 1
    z_3 = w_{30} \cdot 1 + w_{31} \cdot \phi(z_1) + w_{32} \cdot \phi(z_2) = -0,5 \cdot 1 + 1,0 \cdot 0 + 1,0 \cdot 1 = 0,5 und somit \phi(z_3) = \phi(0,5) = 1
  • Wenn x1 = 1 und x2 = 1 ist, gilt:
    z_1 = w_{10} \cdot 1 + w_{11} \cdot x1 + w_{12} \cdot  x2 = -0.5 \cdot 1 + 1,0 \cdot 1 - 1,0 \cdot 1 = -1,5 und somit \phi(z_1) = \phi(-0,5) = 0
    z_2 = w_{20} \cdot 1 + w_{21} \cdot x1 + w_{22} \cdot  x2 = -0.5 \cdot 1 - 1,0 \cdot 1 + 1,0 \cdot 1 = 0,5 und somit \phi(z_2) = \phi(-0,5) = 0
    z_3 = w_{30} \cdot 1 + w_{31} \cdot \phi(z_1) + w_{32} \cdot \phi(z_2) = -0,5 \cdot 1 + 1,0 \cdot 0 + 1,0 \cdot 0 = -0,5 und somit \phi(z_3) = \phi(-0,5) = 0

Es funktioniert!

Mehrfachklassifikation mit dem Perzeptron

Ein Perzeptron-Netz klassifiziert binär, die Ausgabe beschränkt sich auf 1 oder -1 bzw. 0 oder 1.

Jedoch wird in der Praxis oftmals eine One-vs-All (OvA) bzw. One-vs-Rest (OvR) Klassifikation implementiert. In diesem Fall steht die 1 für die Erkennung einer konkreten Klasse, während alle anderen übrigen Klassen als negativ betrachtet werden.

Um jede Klasse erkennen zu können, werden n Klassifizierer (= n Perzeptron-Netze) benötigt. Jedes Perzeptron-Netz ist auf die Erkennung einer bestimmten Klasse trainiert.

Adaline – Oder: die Limitation des Perzeptrons

Das Perzeptron wird nur über eine Sprungfunktion aktiviert. Das schränkt die Feinabstimmung des Trainings enorm ein. Besser sind Aktivierungen über stetige Funktionen, die dann nämlich differenzierbar (ableitbar) sind. Das ergibt eine konvexe Fehlerfunktion mit einem eindeutigen Minimum. Der Adaline-Algorithmus (ADAptive Linear NEuron) erweitert die Idee des Perzeptrons um genau diese Idee. Der wesentliche Fortschritt der Adaline-Regel gegenüber der des Perzeptrons ist demnach, dass die Aktualisierung der Gewichtungen nicht wie beim Perzeptron auf einer einfachen Sprungfunktion, sondern auf einer linearen, stetigen Aktivierungsfunktion beruht.

Single-Layer-Adaline

Wie ein künstliches neuronales Netz mit der Kategorie Adaline trainiert werden kann, wird im nächsten Artikel dieser Artikelserie erläutert.

Weiterführende Netz-Konzepte (CNN und RNN)

Wer bereits mit Frameworks wie TensorFlow in das Deep Learning eingestiegen ist, hat möglicherweise schon erweiterte Konzepte der künstlichen neuronalen Netze kennen gelernt. Die CNNs (Convolutional Neuronal Network) sind im Moment die Wahl für die Verarbeitung von hochdimensionalen Aufgaben, beispielsweise die Bilderkennung (Computer Vision) und Texterkennung (NLP). Das CNN erweitert die Möglichkeiten mit neuronalen Netzen deutlich, indem ein Netz zur Dimensionsreduktion vorgeschaltet wird, im Kern steckt jedoch weiterhin die Idee der MLPs. Beim Einsatz in der Bilderkennung funktionieren CNNs vereinfacht gesprochen so, dass der vorgeschaltete Netzbereich die Millionen Bildpixel sektorweise ausliest (Convolution, Faltung durch Auslesen über Sektoren, die sich gegenseitig überlappen), verdichtet (Pooling, beispielsweise über nicht-lineare Funktionen wie max()) und dann – nach diesem Prozedere – ähnlich eim MLP klassifiziert.


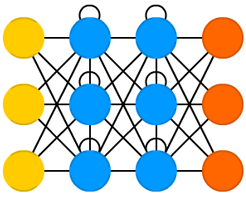
Eine andere erweiterte Form sind RNNs (Recurrent Neuronal Network), die ebenfalls auf der Idee des MLPs basieren, dieses Konzept jedoch dank Rückverbindungen (Neuronen senden an vorherige Schichten) und Selbstverbindungen (Neuronen senden an sich selbst) wiederum auf den Kopf stellen.


Dennoch ist es für das tiefere Verständnis von CNNs und RNNs essenziell, dass vorher das Konzept des MLPs verstanden ist. Es ist die einfachste Form der auch heute noch am meisten eingesetzten und sehr mächtigen Netz-Topologien.

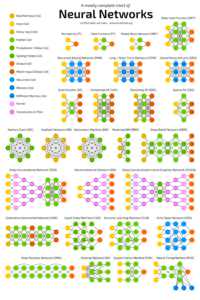
Im Jahr 2016 hatte Fjodor van Veen von asimovinstitute.org hatte – dankenswerterweise – mal eine Zusammenstellung von Netz-Topologien erstellt, auf die ich heute noch immer mal wieder einen Blick werfe:

Künstliche neuronale Netze – Topologie-Übersicht von Fjodor van Veen

Buchempfehlungen

Die folgenden Bücher nutze ich für mein Selbststudium von Machine Learning und Deep Learning und sind teilweise Gedankenvorlagen auch für diesen Artikel gewesen:


Machine Learning mit Python und Scikit-Learn und TensorFlow: Das umfassende Praxis-Handbuch für Data Science, Predictive Analytics und Deep Learning (mitp Professional) Deep Learning mit Python und Keras: Das Praxis-Handbuch vom Entwickler der Keras-Bibliothek(mitp Professional)


ID3-Algorithmus: Ein Rechenbeispiel

Dieser Artikel ist Teil 3 von 4 der Artikelserie Maschinelles Lernen mit Entscheidungsbaumverfahren und nun wollen wir einen Entscheidungsbaum aus Daten herleiten, jedoch ohne Programmierung, sondern direkt auf Papier (bzw. HTML :-).

Folgender Datensatz sei gegeben:

Zeile Kundenart Zahlungsgeschwindigkeit Kauffrequenz Herkunft Zahlungsmittel: Rechnung?
 1  Neukunde  niedrig  niedrig  Inland  false
 2  Neukunde  niedrig  niedrig  Ausland  false
 3  Stammkunde  niedrig  niedrig  Inland  true
 4  Normalkunde  mittel  niedrig  Inland  true
 5  Normalkunde  hoch  hoch  Inland  true
 6  Normalkunde  hoch  hoch  Ausland  false
 7  Stammkunde  hoch  hoch  Ausland  true
 8  Neukunde  mittel  niedrig  Inland  false
 9  Neukunde  hoch  hoch  Inland  true
 10  Normalkunde  mittel  hoch  Inland  true
 11  Neukunde  mittel  hoch  Ausland  true
 12  Stammkunde  mittel  niedrig  Ausland  true
 13  Stammkunde  niedrig  hoch  Inland  true
 14  Normalkunde  mittel  niedrig  Ausland  false

Gleich vorweg ein Disclaimer: Der Datensatz ist natürlich überaus klein, ja gerade zu winzig. Dafür würden wir in der Praxis niemals einen Machine Learning Algorithmus einsetzen. Dennoch bleiben wir besser übersichtlich und nachvollziehbar mit diesen 14 Zeilen. Das Lernziel dieser Übung ist es, ein Gefühl für die Erstellung von Entscheidungsbäumen zu erhalten.
Zu beachten ist ferner, dass dieser Datensatz bereits aggregiert ist, denn eigentlich nummerisch abbildbare Daten wurden in Klassen zusammengefasst.

Das Ziel:

Der Datensatz spielt wieder, welchem Kunden (ID) bisher die Zahlung per Rechnung erlaubt und nicht widerrufen wurde. Das Ziel soll sein, eine Vorhersage darüber zu machen zu können, wann ein Kunde per Rechnung zahlen darf und wann nicht (dann per Vorkasse).

Der Algorithmus:

Wir verwenden den ID3-Algorithmus in seiner Reinform. Der ID3-Algorithmus ist der gängigste Algorithmus zum Aufbau datengetriebener Entscheidungsbäume und es gibt mehrere Abwandlungen. Die Vorgehensweise des Algorithmus wird in dem Teil 2 der Artikelserie Entscheidungsbaum-Algorithmus ID3 erläutert.

1. Schritt: Auswählen des Attributes mit dem höchsten Informationsgewinn

Der Informationsgewinn eines Attributes (A) im Sinne des ID3-Algorithmus ist die Differenz aus der Entropie (E(S)) (siehe Teil 1 der Artikelserie Entropie, ein Maß für die Unreinheit in Daten) des gesamten Datensatzes (S) und der Summe aus den gewichteten Entropien des Attributes für jeden einzelnen Wert (Value i), der im Attribut vorkommt:
IG(S, A) = H(S) - \sum_{i=1}^n \frac{\bigl|S_i\bigl|}{\bigl|S\bigl|} \cdot H(S_i)

1.1 Gesamt-Entropie des Datensatzes berechnen

Erstmal schauen wir uns die Entropie des gesamten Datensatzes an. Die Entropie bezieht sich dabei auf das gewünschte Klassifikationsergebnis, also ist die Zahlung via Rechnung erlaubt oder nicht? Diese Frage wird entweder mit true oder false beantwortet.

H(S) = - \frac{9}{14} \cdot \log_2(\frac{9}{14}) - \frac{5}{14} \cdot \log_2(\frac{5}{14})  = 0.94

1.2 Berechnung der Informationsgewinne aller Attribute

Berechnen wir nun also die Informationsgewinne über alle Spalten.

Attribut Subset Count(true) Count(false)
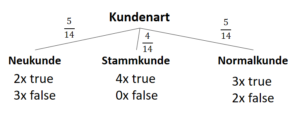
Kundenart “Neukunde” 2 3
“Stammkunde” 4 0
“Normalkunde” 3 2

Wir zerlegen den gesamten Datensatz gedanklich in drei Kategorien der Kundenart und berechnen die Entropie bezogen auf das Klassifikationsziel:

H(S_{Neukunde}) = - \frac{2}{5} \cdot \log_2(\frac{2}{5}) - \frac{3}{5} \cdot \log_2(\frac{3}{5})  = 0.97

H(S_{Stammkunde}) = - \frac{4}{4} \cdot \log_2(\frac{4}{4}) - \frac{0}{4} \cdot \log_2(\frac{0}{4})  = 0.00

H(S_{Normalkunde}) = - \frac{3}{5} \cdot \log_2(\frac{3}{5}) - \frac{2}{5} \cdot \log_2(\frac{2}{5})  = 0.97

Zur Erinnerung, der Informationsgewinn (Information Gain) wird wie folgt berechnet:

    \[ IG(S, A_{Kundenart}) =  - \sum_{i=1}^n \frac{\bigl|S_i\bigl|}{\bigl|S\bigl|} \cdot H(S_i) \]

Angewendet auf das Attribut “Kundenart”…

    \[ IG(S, A_{Kundenart}) =  H(S) - \frac{\bigl|S_{Neukunde}\bigl|}{\bigl|S\bigl|} \cdot H(S_{Neukunde}) - \frac{\bigl|S_{Stammkunde}\bigl|}{\bigl|S\bigl|} \cdot H(S_{Stammkunde}) - \frac{\bigl|S_{Normalkunde}\bigl|}{\bigl|S\bigl|} \cdot H(S_{Normalkunde}) \]

… erhalten wir der Formal nach folgenden Informationsgewinn:

    \[ IG(S, A_{Kundenart}) =  0.94 - \frac{5}{14} \cdot 0.97 - \frac{4}{14} \cdot 0.00 - \frac{5}{14} \cdot 0.97 = 0.247 \]

Nun für die weiteren Spalten:

Attribut Subset Count(true) Count(false)
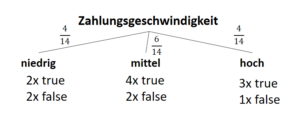
Zahlungsgeschwindigkeit “niedrig” 2 2
“mittel” 4 2
“schnell” 3 1

Entropien für die “Zahlungsgeschwindigkeit”:

H(S_{niedrig}) = - \frac{2}{4} \cdot \log_2(\frac{2}{4}) - \frac{2}{4} \cdot \log_2(\frac{2}{4})  = 1.00

H(S_{mittel}) = - \frac{4}{6} \cdot \log_2(\frac{4}{6}) - \frac{2}{6} \cdot \log_2(\frac{2}{6})  = 0.92

H(S_{schnell}) = - \frac{3}{4} \cdot \log_2(\frac{3}{4}) - \frac{1}{4} \cdot \log_2(\frac{1}{4})  = 0.81

So berechnen wir wieder den Informationsgewinn:

    \[ IG(S, A_{Zahlungsgeschwindigkeit}) =  H(S) - \frac{\bigl|S_{niedrig}\bigl|}{\bigl|S\bigl|} \cdot H(S_{niedrig}) - \frac{\bigl|S_{mittel}\bigl|}{\bigl|S\bigl|} \cdot H(S_{mittel}) - \frac{\bigl|S_{schnell}\bigl|}{\bigl|S\bigl|} \cdot H(S_{schnell}) \]

Einsatzen und ausrechnen:

    \[ IG(S, A_{Zahlungsgeschwindigkeit}) =  0.94 - \frac{4}{14} \cdot 1.00 - \frac{6}{14} \cdot 0.92 - \frac{4}{14} \cdot 0.81 = 0.029 \]

Und nun für die Spalte “Kauffrequenz”:

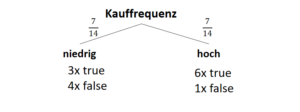
Attribut Subset Count(true) Count(false)
Kauffrequenz “niedrig” 3 4
“hoch” 6 1

Entropien:

H(S_{niedrig}) = - \frac{3}{7} \cdot \log_2(\frac{3}{7}) - \frac{4}{7} \cdot \log_2(\frac{4}{7})  = 0.99

H(S_{hoch}) = - \frac{6}{7} \cdot \log_2(\frac{6}{7}) - \frac{1}{7} \cdot \log_2(\frac{1}{7})  = 0.59

Informationsgewinn:

    \[ IG(S, A_{Kauffrequenz}) =  H(S) - \frac{\bigl|S_{niedrig}\bigl|}{\bigl|S\bigl|} \cdot H(S_{niedrig}) - \frac{\bigl|S_{hoch}\bigl|}{\bigl|S\bigl|} \cdot H(S_{hoch}) \]

Einsetzen und Ausrechnen:

    \[ IG(S, A_{Kauffrequenz}) =  0.94 - \frac{7}{14} \cdot 1.00 - \frac{7}{14} \cdot 0.59 = 0.150 \]

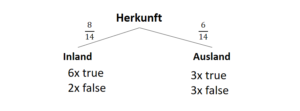
Und last but not least die Spalte “Herkunft”:

Attribut Subset Count(true) Count(false)
Herkunft “Inland” 6 2
“Ausland” 3 3

Entropien:

H(S_{Inland}) = - \frac{6}{8} \cdot \log_2(\frac{6}{8}) - \frac{2}{8} \cdot \log_2(\frac{2}{8})  = 0.81

H(S_{Ausland}) = - \frac{3}{6} \cdot \log_2(\frac{3}{6}) - \frac{3}{6} \cdot \log_2(\frac{3}{6})  = 1.00

Informationsgewinn:

    \[ IG(S, A_{Herkunft}) =  H(S) - \frac{\bigl|S_{Inland}\bigl|}{\bigl|S\bigl|} \cdot H(S_{Inland}) - \frac{\bigl|S_{Ausland}\bigl|}{\bigl|S\bigl|} \cdot H(S_{Ausland}) \]

Einsetzen und Ausrechnen:

    \[ IG(S, A_{Herkunft}) =  0.94 - \frac{8}{14} \cdot 0.81 - \frac{6}{14} \cdot 1.00 = 0.05 \]

2. Schritt: Anlegen des Wurzel-Knotens

Der Informationsgewinn ist für das Attribut “Kundenart” am größten, daher entscheiden wir uns im Sinne des ID3-Algorithmus für dieses Attribut als Wurzel-Knoten.

3. Schritt: Rekursive Wiederholung (!!!)

Nun stellt sich natürlich die Frage: Wie geht es weiter?

Der Algorithmus kann eigentlich nur eines: Einen Wurzelknoten finden. Diesen Vorgang müssen wir nun nur noch rekursiv wiederholen, und das tun wir wie folgt.

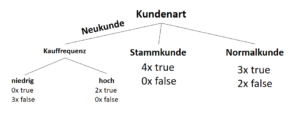
Der Datensatz wurde bereits aufgeteilt in die drei Kundenarten. Für jede Kundenart ergibt sich jeweils ein Subset mit den verbleibenden Attributen. Für alle drei Subsets erstellen wir dann wieder einen Wurzelknoten, so dass ein neuer Ast entsteht.

3.1 Erster Rekursionsschritt

Machen wir also weiter und bestimmen wir das nächste Attribut nach der Kundenart, für die Fälle Kundenart = “Neukunde”:

Zeile Kundenart Zahlungsgeschwindigkeit Kauffrequenz Herkunft Zahlungsmittel: Rechnung?
 1  Neukunde  niedrig  niedrig  Inland  false
 2  Neukunde  niedrig  niedrig  Ausland  false
 8  Neukunde  mittel  niedrig  Inland  false
 9  Neukunde  hoch  hoch  Inland  true
 11  Neukunde  mittel  hoch  Ausland  true

Die Entropie des Gesamtdatensatzes (ja, es ist für diesen Schritt betrachtet der gesamte Datensatz!) ist wie folgt:

H(S_{Neukunde}) = - \frac{2}{5} \cdot \log_2(\frac{2}{5}) - \frac{3}{5} \cdot \log_2(\frac{3}{5})  = 0.97

Die Entropie ist weit weg von einer bestimmten Wahrscheinlichkeit (nahe der Gleichverteilung). Daher müssen wir hier nochmal ansetzen und losrechnen:

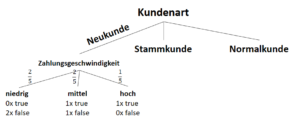
Entropien für “Zahlungsgeschwindigkeit” bei Neukunden:

H(S_{niedrig}) = 0.00

H(S_{mittel}) = 1.00

H(S_{hoch}) = 0.00

Informationsgewinn des Attributes “Zahlungsgeschwindigkeit” bei Neukunden:

    \[ IG(S_{Neukunde},A_{Zahlungsgeschwindigkeit}) = 0.97 - \frac{3}{5} \cdot 0.00 - \frac{2}{5} \cdot 1.00 -  \frac{1}{5} \cdot 0.00 = 0.57 \]

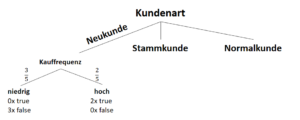
Betrachtung der Spalte “Kauffrequenz” bei Neukunden:

Entropien für “Kauffrequenz” bei Neukunden:

H(S_{niedrig}) = 0.00

H(S_{hoch}) = 0.00

Informationsgewinn des Attributes “Kauffrequenz” bei Neukunden:

    \[ IG(S_{Neukunde},A_{Kauffrequenz}) = 0.97 - \frac{3}{5} \cdot 0.00 - \frac{2}{5} \cdot 0.00 = 0.97 \]

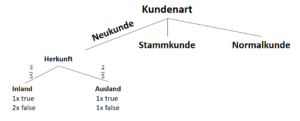
Betrachtung der Spalte “Herkunft” bei Neukunden:

Entropien für “Herkunft” bei Neukunden:

H(S_{Inland}) = 0.92

H(S_{hoch}) = 1.00

Informationsgewinn des Attributes “Herkunft” bei Neukunden:

    \[ IG(S_{Neukunde},A_{Herkunft}) = 0.97 - \frac{3}{5} \cdot 0.92 - \frac{2}{5} \cdot 1.00 = 0.018 \]

Wir entscheiden uns also für das Attribut “Kauffrequenz” als Ast nach der Entscheidung “Neukunde”, denn dieses Attribut bring uns den größten Informationsgewinn und trennt uns die Unterscheidung für oder gegen das Zahlungsmittel “Rechnung” eindeutig auf.

3.1 Zweiter Rekursionsschritt

Was passiert mit der Kundenart “Stammkunde”?

Zeile Kundenart Zahlungsgeschwindigkeit Kauffrequenz Herkunft Zahlungsmittel: Rechnung?
 3  Stammkunde  niedrig  niedrig  Inland  true
 7  Stammkunde  hoch  hoch  Ausland  true
 12  Stammkunde  mittel  niedrig  Ausland  true
 13  Stammkunde  niedrig  hoch  Inland  true

Die Antwort ist einfach: Nichts!
Wer ein Stammkunde ist, dem wurde stets die Zahlung per Rechnung erlaubt.

H(S_{Stammkunde}) = 0.0

3.1 Dritter Rekursionsschritt

Fehlt nun nur noch die Frage nach der Unterscheidung von Normalkunden.

Zeile Kundenart Zahlungsgeschwindigkeit Kauffrequenz Herkunft Zahlungsmittel: Rechnung?
 4  Normalkunde  mittel  niedrig  Inland  true
 5  Normalkunde  hoch  hoch  Inland  true
 6  Normalkunde  hoch  hoch  Ausland  false
 14  Normalkunde  mittel  niedrig  Ausland  false

Zwar ist die Entropie des Subsets der Normalkunden…

H(S_{Normalkunde}) = 1.0

… denkbar schlecht, da maximal. Aber wir können genauso vorgehen, wie wir es bei dem Subset der Neukunden getan haben. Ich nehme es nun aber vorweg: Wenn wir uns den Datensatz näher ansehen, erkennen wir, dass wir diese Gesamtentropie von 1.0 für das Subset “Normalkunde” nicht mit den Attributen “Kauffrequenz” oder “Zahlungsgeschwindigkeit” reduzieren können, da dieses auch für sich betrachtet in Entropien der Größe 1.0 erhalten werden. Das Attribut “Herkunft” hingegen teilt den Datensatz sauber in true und false auf:

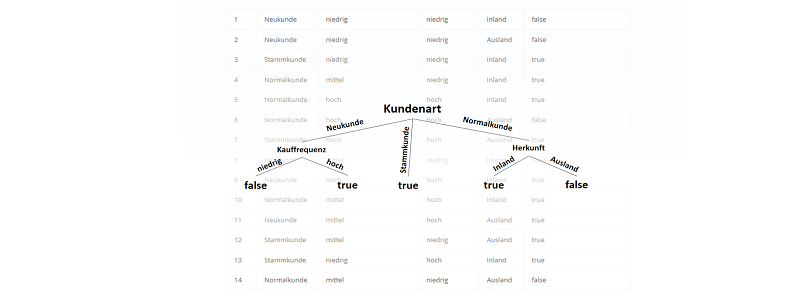
Somit ist der Informationsgewinn für das Attribut “Herkunft” am größten und wir haben unseren Baum komplett und – glücklicherweise – eindeutig bestimmen können!

Ergebnis: Der Entscheidungsbaum

Somit haben wir den Entscheidungsbaum über den ID3-Algorithmus erstellt, der eine Auskunft darüber macht, ob einem Kunden die Zahlung über Rechnung (statt Vorkasse) erlaubt wird:

true = Rechnung als Zahlungsmittel erlaubt
false = Rechnung als Zahlungsmittel nicht erlaubt