Attribution Models
A Business and Statistical Case
INTRODUCTION
A desire to understand the causal effect of campaigns on KPIs
Advertising and marketing costs represent a huge and ever more growing part of the budget of companies. Studies have found out this share is as high as 10% and increases with the size of companies (CMO study by American Marketing Association and Duke University, 2017). Measuring precisely the impact of a specific marketing campaign on the sales of a company is a critical step towards an efficient allocation of this budget. Would the return be higher for an euro spent on a Facebook ad, or should we better spend it on a TV spot? How much should I spend on Twitter ads given the volume of sales this channel is responsible for?
Attribution Models have lately received great attention in Marketing departments to answer these issues. The transition from offline to online marketing methods has indeed permitted the collection of multiple individual data throughout the whole customer journey, and allowed for the development of user-centric attribution models. In short, Attribution Models use the information provided by Tracking technologies such as Google Analytics or Webtrekk to understand customer journeys from the first click on a Facebook ad to the final purchase and adequately ponderate the different marketing campaigns encountered depending on their responsibility in the final conversion.
Issues on Causal Effects
A key question then becomes: how to declare a channel is responsible for a purchase? In other words, how can we isolate the causal effect or incremental value of a campaign ?
1. A/B-Tests
One method to estimate the pure impact of a campaign is the design of randomized experiments, wherein a control and treated groups are compared. A/B tests belong to this broad category of randomized methods. Provided the groups are a priori similar in every aspect except for the treatment received, all subsequent differences may be attributed solely to the treatment. This method is typically used in medical studies to assess the effect of a drug to cure a disease.
Main practical issues regarding Randomized Methods are:
- Assuring that control and treated groups are really similar before treatment. Uually a random assignment (i.e assuring that on a relevant set of observable variables groups are similar) is realized;
- Potential spillover-effects, i.e the possibility that the treatment has an impact on the non-treated group as well (Stable unit treatment Value Assumption, or SUTVA in Rubin’s framework);
- The costs of conducting such an experiment, and especially the costs linked to the deliberate assignment of individuals to a group with potentially lower results;
- The number of such experiments to design if multiple treatments have to be measured;
- Difficulties taking into account the interaction effects between campaigns or the effect of spending levels. Indeed, usually A/B tests are led by cutting off temporarily one campaign entirely and measuring the subsequent impact on KPI’s compared to the situation where this campaign is maintained;
- The dynamical reproduction of experiments if we assume that treatment effects may change over time.
In the marketing context, multiple campaigns must be tested in a dynamical way, and treatment effect is likely to be heterogeneous among customers, leading to practical issues in the lauching of A/B tests to approximate the incremental value of all campaigns. However, sites with a lot of traffic and conversions can highly benefit from A/B testing as it provides a scientific and straightforward way to approximate a causal impact. Leading companies such as Uber, Netflix or Airbnb rely on internal tools for A/B testing automation, which allow them to basically test any decision they are about to make.
References:
Books:
Experiment!: Website conversion rate optimization with A/B and multivariate testing, Colin McFarland, ©2013 | New Riders
A/B testing: the most powerful way to turn clicks into customers. Dan Siroker, Pete Koomen; Wiley, 2013.
Blogs:
https://eng.uber.com/xp
https://medium.com/airbnb-engineering/growing-our-host-community-with-online-marketing-9b2302299324
Study:
https://cmosurvey.org/wp-content/uploads/sites/15/2018/08/The_CMO_Survey-Results_by_Firm_and_Industry_Characteristics-Aug-2018.pdf
2. Attribution models
Attribution Models do not demand to create an experimental setting. They take into account existing data and derive insights from the variability of customer journeys. One key difficulty is then to differentiate correlation and causality in the links observed between the exposition to campaigns and purchases. Indeed, selection effects may bias results as exposure to campaigns is usually dependant on user-characteristics and thus may not be necessarily independant from the customer’s baseline conversion probabilities. For example, customers purchasing from a discount price comparison website may be intrinsically different from customers buying from FB ad and this a priori difference may alone explain post-exposure differences in purchasing bahaviours. This intrinsic weakness must be remembered when interpreting Attribution Models results.
2.1 General Issues
The main issues regarding the implementation of Attribution Models are linked to
- Causality and fallacious reasonning, as most models do not take into account the aforementionned selection biases.
- Their difficult evaluation. Indeed, in almost all attribution models (except for those based on classification, where the accuracy of the model can be computed), the additionnal value brought by the use of a given attribution models cannot be evaluated using existing historical data. This additionnal value can only be approximated by analysing how the implementation of the conclusions of the attribution model have impacted a given KPI.
- Tracking issues, leading to an uncorrect reconstruction of customer journeys
- Cross-device journeys: cross-device issue arises from the use of different devices throughout the customer journeys, making it difficult to link datapoints. For example, if a customer searches for a product on his computer but later orders it on his mobile, the AM would then mistakenly consider it an order without prior campaign exposure. Though difficult to measure perfectly, the proportion of cross-device orders can approximate 20-30%.
- Cookies destruction makes it difficult to track the customer his the whole journey. Both regulations and consumers’ rising concerns about data privacy issues mitigate the reliability and use of cookies.1 – From 2002 on, the EU has enacted directives concerning privacy regulation and the extended use of cookies for commercial targeting purposes, which have highly impacted marketing strategies, such as the ‘Privacy and Electronic Communications Directive’ (2002/58/EC). A research was conducted and found out that the adoption of this ‘Privacy Directive’ had led to 64% decrease in advertising methods compared to the rest of the world (Goldfarb et Tucker (2011)). The effect was stronger for generalized sites (Yahoo) than for specialized sites.2 – Users have grown more and more conscious of data privacy issues and have adopted protective measures concerning data privacy, such as automatic destruction of cookies after a session is ended, or simply giving away less personnal information (Goldfarb et Tucker (2012) ) .Valuable user information may be lost, though tracking technologies evolution have permitted to maintain tracking by other means. This issue may be particularly important in countries highly concerned with data privacy issues such as Germany.
- Offline/Online bridge: an Attribution Model should take into account all campaigns to draw valuable insights. However, the exposure to offline campaigns (TV, newspapers) are difficult to track at the user level. One idea to tackle this issue would be to estimate the proportion of conversions led by offline campaigns through AB testing and deduce this proportion from the credit assigned to the online campaigns accounted for in the Attribution Model.
- Touch point information available: clicks are easy to follow but irrelevant to take into account the influence of purely visual campaigns such as display ads or video.
2.2 Today’s main practices
Two main families of Attribution Models exist:
- Rule-Based Attribution Models, which have been used for in the last decade but from which companies are gradualy switching.
Attribution depends on the individual journeys that have led to a purchase and is solely based on the rank of the campaign in the journey. Some models focus on a single touch points (First Click, Last Click) while others account for multi-touch journeys (Bathtube, Linear). It can be calculated at the customer level and thus doesn’t require large amounts of data points. We can distinguish two sub-groups of rule-based Attribution Models:
- One Touch Attribution Models attribute all credit to a single touch point. The First-Click model attributes all credit for a converion to the first touch point of the customer journey; last touch attributes all credit to the last campaign.
- Multi-touch Rule-Based Attribution Models incorporate information on the whole customer journey are thus an improvement compared to one touch models. To this family belong Linear model where credit is split equally between all channels, Bathtube model where 40% of credit is given to first and last clicks and the remaining 20% is distributed equally between the middle channels, or time-decay models where credit assigned to a click diminishes as the time between the click and the order increases..
The main advantages of rule-based models is their simplicity and cost effectiveness. The main problems are:
– They are a priori known and can thus lead to optimization strategies from competitors
– They do not take into account aggregate intelligence on customer journeys and actual incremental values.
– They tend to bias (depending on the model chosen) channels that are over-represented at the beggining or end of the funnel, according to theoretical assumptions that have no observationnal back-ups.
- Data-Driven Attribution Models
These models take into account the weaknesses of rule-based models and make a relevant use of available data. Being data-driven, following attribution models cannot be computed using single user level data. On the contrary values are calculated through data aggregation and thus require a certain volume of customer journey information.
References:
https://dspace.mit.edu/handle/1721.1/64920
3. Data-Driven Attribution Models in practice
3.1 Issues
Several issues arise in the computation of campaigns individual impact on a given KPI within a data-driven model.
- Selection biases: Exposure to certain types of advertisement is usually highly correlated to non-observable variables which are in turn correlated to consumption practices. Differences in the behaviour of users exposed to different campaigns may thus only be driven by core differences in conversion probabilities between groups whether than by the campaign effect.
- Complementarity: it may be that campaigns A and B only have an effect when combined, so that measuring their individual impact would lead to misleading conclusions. The model could then try to assess the effect of combinations of campaigns on top of the effect of individual campaigns. As the number of possible non-ordered combinations of k campaigns is 2k, it becomes clear that inclusing all possible combinations would however be time-consuming.
- Order-sensitivity: The effect of a campaign A may depend on the place where it appears in the customer journey, meaning the rank of a campaign and not merely its presence could be accounted for in the model.
- Relative Order-sensitivity: it may be that campaigns A and B only have an effect when one is exposed to campaign A before campaign B. If so, it could be useful to assess the effect of given combinations of campaigns as well. And this for all campaigns, leading to tremendous numbers of possible combinations.
- All previous phenomenon may be present, increasing even more the potential complexity of a comprehensive Attribution Model. The number of all possible ordered combination of k campaigns is indeed :

3.2 Main models
A) Logistic Regression and Classification models
If non converting journeys are available, Attribition Model can be shaped as a simple classification issue. Campaign types or campaigns combination and volume of campaign types can be included in the model along with customer or time variables. As we are interested in inference (on campaigns effect) whether than prediction, a parametric model should be used, such as Logistic Regression. Non paramatric models such as Random Forests or Neural Networks can also be used though the interpretation of campaigns value would be more difficult to derive from the model results.
A common pitfall is the usual issue of spurious correlations on one hand and the correct interpretation of coefficients in business terms.
An advantage if the possibility to evaluate the relevance of the model using common model validation methods to evaluate its predictive power (validation set \ AUC \pseudo R squared).
B) Shapley Value
Theory
The Shapley Value is based on a Game Theory framework and is named after its creator, the Nobel Price Laureate Lloyd Shapley. Initially meant to calculate the marginal contribution of players in cooperative games, the model has received much attention in research and industry and has lately been applied to marketing issues. This model is typically used by Google Adords and other ad bidding vendors. Campaigns or marketing channels are in this model seen as compementary players looking forward to increasing a given KPI.
Contrarily to Logistic Regressions, it is a non-parametric model. Contrarily to Markov Chains, all results are built using existing journeys, and not simulated ones.
Channels are considered to enter the game sequentially under a certain joining order. Shapley value try to The Shapley value of channel i is the weighted sum of the marginal values that channel i adds to all possible coalitions that don’t contain channel i.
In other words, the main logic is to analyse the difference of gains when a channel i is added after a coalition Ck of k channels, k<=n. We then sum all the marginal contributions over all possible ordered combination Ck of all campaigns excluding i, with k<=n-1.
Subsets framework
A first an most usual way to compute the Shapley Vaue is to consider that when a channel enters coalition, its additionnal value is the same irrelevant of the order in which previous channels have appeared. In other words, journeys (A>B>C) and (B>A>C) trigger the same gains.
Shapley value is computed as the gains associated to adding a channel i to a subset of channels, weighted by the number of (ordered) sequences that the (unordered) subset represents, summed up on all possible subsets of the total set of campaigns where the channel i is not present.
The Shapley value of the channel ???????? is then:

where |S| is the number of campaigns of a coalition S and the sum extends over all subsets S that do not not contain channel j. ????(????) is the value of the coalition S and ????(???? ∪ {????????}) the value of the coalition formed by adding ???????? to coalition S. ????(???? ∪ {????????}) − ????(????) is thus the marginal contribution of channel ???????? to the coalition S.
The formula can be rewritten and understood as:

This method is convenient when data on the gains of on all possible permutations of all unordered k subsets of the n campaigns are available. It is also more convenient if the order of campaigns prior to the introduction of a campaign is thought to have no impact.
Ordered sequences
Let us define ????((A>B)) as the value of the sequence A then B. What is we let ????((A>B)) be different from ????((B>A)) ?
This time we would need to sum over all possible permutation of the S campaigns present before ???????? and the N-(S+1) campaigns after ????????. Doing so we will sum over all possible orderings (i.e all permutations of the n campaigns of the grand coalition containing all campaigns) and we can remove the permutation coefficient s!(p-s+1)!.
This method is convenient when the order of channels prior to and after the introduction of another channel is assumed to have an impact. It is also necessary to possess data for all possible permutations of all k subsets of the n campaigns, and not only on all (unordered) k-subsets of the n campaigns, k<=n. In other words, one must know the gains of A, B, C, A>B, B>A, etc. to compute the Shapley Value.
Differences between the two approaches
We simulate an ordered case where the value for each ordered sequence k for k<=3 is known. We compare it to the usual Shapley value calculated based on known gains of unordered subsets of campaigns. So as to compare relevant values, we have built the gains matrix so that the gains of a subset A, B i.e ????({B,A}) is the average of the gains of ordered sequences made up with A and B (assuming the number of journeys where A>B equals the number of journeys where B>A, we have ????({B,A})=0.5( ????((A>B)) + ????((B>A)) ). We let the value of the grand coalition be different depending on the order of campaigns-keeping the constraints that it averages to the value used for the unordered case.
Note: mvA refers to the marginal value of A in a given sequence.
With traditionnal unordered coalitions:

With ordered sequences used to compute the marginal values:
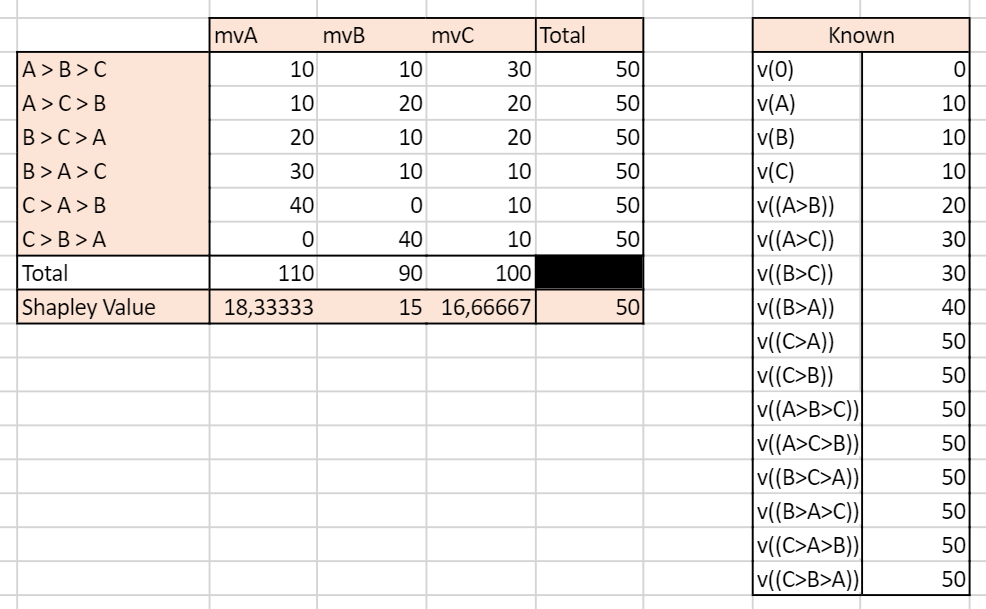
We can see that the two approaches yield very different results. In the unordered case, the Shapley Value campaign C is the highest, culminating at 20, while A and B have the same Shapley Value mvA=mvB=15. In the ordered case, campaign A has the highest Shapley Value and all campaigns have different Shapley Values.
This example illustrates the inherent differences between the set and sequences approach to Shapley values. Real life data is more likely to resemble the ordered case as conversion probabilities may for any given set of campaigns be influenced by the order through which the campaigns appear.
Advantages
Shapley value has become popular in allocation problems in cooperative games because it is the unique allocation which satisfies different axioms:
- Efficiency: Shaple Values of all channels add up to the total gains (here, orders) observed.
- Symmetry: if channels A and B bring the same contribution to any coalition of campaigns, then their Shapley Value i sthe same
- Null player: if a channel brings no additionnal gains to all coalitions, then its Shapley Value is zero
- Strong monotony: the Shapley Value of a player increases weakly if all its marginal contributions increase weakly
These properties make the Shapley Value close to what we intuitively define as a fair attribution.
Issues
- The Shapley Value is based on combinatory mathematics, and the number of possible coalitions and ordered sequences becomes huge when the number of campaigns increases.
- If unordered, the Shapley Value assumes the contribution of campaign A is the same if followed by campaign B or by C.
- If ordered, the number of combinations for which data must be available and sufficient is huge.
- Channels rarely present or present in long journeys will be played down.
- Generally, gains are supposed to grow with the number of players in the game. However, it is plausible that in the marketing context a journey with a high number of channels will not necessarily bring more orders than a journey with less channels involved.
References:
R package: GameTheoryAllocation
Article:
Zhao & al, 2018 “Shapley Value Methods for Attribution Modeling in Online Advertising “
https://link.springer.com/content/pdf/10.1007/s13278-017-0480-z.pdf
Courses: https://www.lamsade.dauphine.fr/~airiau/Teaching/CoopGames/2011/coopgames-7%5b8up%5d.pdf
Blogs: https://towardsdatascience.com/one-feature-attribution-method-to-supposedly-rule-them-all-shapley-values-f3e04534983d
B) Markov Chains
Markov Chains are used to model random processes, i.e events that occur in a sequential manner and in such a way that the probability to move to a certain state only depends on the past steps. The number of previous steps that are taken into account to model the transition probability is called the memory parameter of the sequence, and for the model to have a solution must be comprised between 0 and 4. A Markov Chain process is thus defined entirely by its Transition Matrix and its initial vector (i.e the starting point of the process).
Markov Chains are applied in many scientific fields. Typically, they are used in weather forecasting, with the sequence of Sunny and Rainy days following a Markov Process of memory parameter 0, so that for each given day the probability that the next day will be rainy or sunny only depends on the weather of the current day. Other applications can be found in sociology to understand the dynamics of social classes intergenerational reproduction. To get more both mathematical and applied illustration, I recommend the reading of this course.
In the marketing context, Markov Chains are an interesting way to model the conversion funnel. To go from the from the Markov Model to the Attribution logic, we calculate the Removal Effect of each channel, i.e the difference in conversions that happen if the channel is removed. Please read below for an introduction to the methodology.
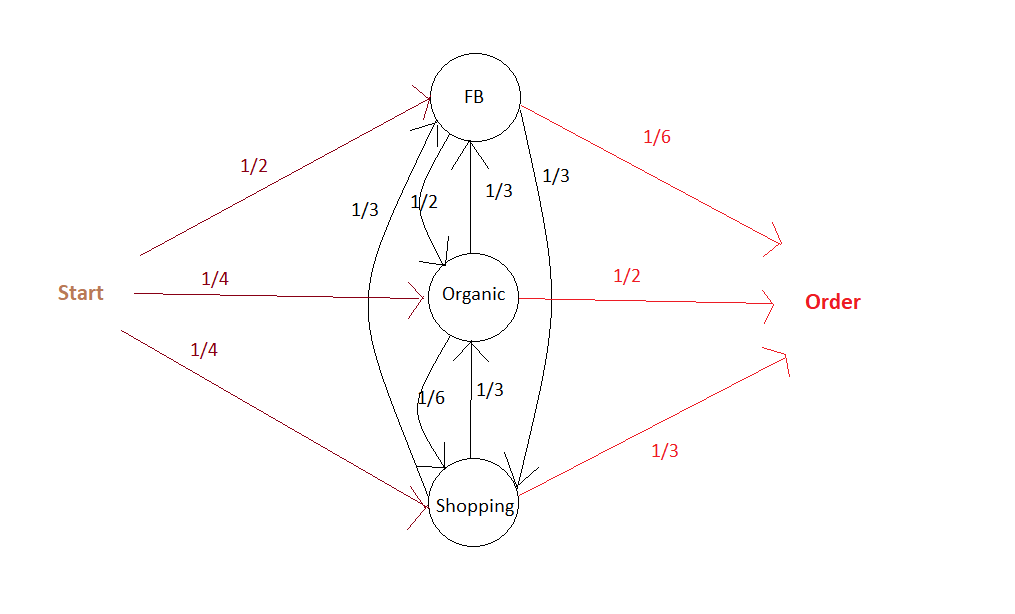
The first step in a Markov Chains Attribution Model is to build the transition matrix that captures the transition probabilities between the campaigns accross existing customer journeys. This Matrix is to be read as a “From state A to state B” table, from the left to the right. A first difficulty is finding the right memory parameter to use. A large memory parameter would allow to take more into account interraction effects within the conversion funnel but would lead to increased computationnal time, a non-readable transition matrix, and be more sensitive to noisy data. Please note that this transition matrix provides useful information on the conversion funnel and on the relationships between campaigns and can be used as such as an analytical tool. I suggest the clear and easily R code which can be found here or here.
Here is an illustration of a Markov Chain with memory Parameter of 0: the probability to go to a certain campaign B in the next step only depend on the campaign we are currently at:
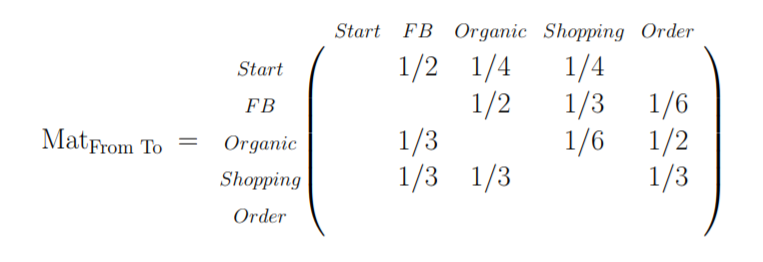
The associated Transition Matrix is then (with null probabilities left as Blank):
The second step is to compute the actual responsibility of a channel in total conversions. As mentionned above, the main philosophy to do so is to calculate the Removal Effect of each channel, i.e the changes in the number of conversions when a channel is entirely removed. All customer journeys which went through this channel are settled out to be unsuccessful. This calculation is done by applying the transition matrix with and without the removed channels to an initial vector that contains the number of desired simulations.
Building on our current example, we can then settle an initial vector with the desired number of simulations, e.g 10 000:

It is possible at this stage to add a constraint on the maximum number of times the matrix is applied to the data, i.e on the maximal number of campaigns a simulated journey is allowed to have.
Advantages
- The dynamic journey is taken into account, as well as the transition between two states. The funnel is not assumed to be linear.
- It is possile to build a conversion graph that maps the customer journey provides valuable insights.
- It is possible to evaluate partly the accuracy of the Attribution Model based on Markov Chains. It is for example possible to see how well the transition matrix help predict the future by analysing the number of correct predictions at any given step over all sequences.
Disadvantages
- It can be somewhat difficult to set the memory parameter. Complementarity effects between channels are not well taken into account if the memory is low, but a parameter too high will lead to over-sensitivity to noise in the data and be difficult to implement if customer journeys tend to have a number of campaigns below this memory parameter.
- Long journeys with different channels involved will be overweighted, as they will count many times in the Removal Effect. For example, if there are n-1 channels in the customer journey, this journey will be considered as failure for the n-1 channel-RE. If the volume effects (i.e the impact of the overall number of channels in a journey, irrelevant from their type° are important then results may be biased.
References:
R package: ChannelAttribution
Git:
https://github.com/MatCyt/Markov-Chain/blob/master/README.md
Course:
https://www.ssc.wisc.edu/~jmontgom/markovchains.pdf
Article:
“Mapping the Customer Journey: A Graph-Based Framework for Online Attribution Modeling”; Anderl, Eva and Becker, Ingo and Wangenheim, Florian V. and Schumann, Jan Hendrik, 2014. Available at SSRN: https://ssrn.com/abstract=2343077 or http://dx.doi.org/10.2139/ssrn.2343077
“Media Exposure through the Funnel: A Model of Multi-Stage Attribution”, Abhishek & al, 2012
“Multichannel Marketing Attribution Using Markov Chains”, Kakalejčík, L., Bucko, J., Resende, P.A.A. and Ferencova, M. Journal of Applied Management and Investments, Vol. 7 No. 1, pp. 49-60. 2018
Blogs:
https://analyzecore.com/2016/08/03/attribution-model-r-part-1
https://analyzecore.com/2016/08/03/attribution-model-r-part-2
3.3 To go further: Tackling selection biases with Quasi-Experiments
Exposure to certain types of advertisement is usually highly correlated to non-observable variables. Differences in the behaviour of users exposed to different campaigns may thus only be driven by core differences in converison probabilities between groups whether than by the campaign effect. These potential selection effects may bias the results obtained using historical data.
Quasi-Experiments can help correct this selection effect while still using available observationnal data. These methods recreate the settings on a randomized setting. The goal is to come as close as possible to the ideal of comparing two populations that are identical in all respects except for the advertising exposure. However, populations might still differ with respect to some unobserved characteristics.
Common quasi-experimental methods used for instance in Public Policy Evaluation are:
- Discontinuity Regressions
- Matching Methods, such as Exact Matching, Propensity-score matching or k-nearest neighbourghs.
References:
Article:
“Towards a digital Attribution Model: Measuring the impact of display advertising on online consumer behaviour”, Anindya Ghose & al, MIS Quarterly Vol. 40 No. 4, pp. 1-XX, 2016
https://pdfs.semanticscholar.org/4fa6/1c53f281fa63a9f0617fbd794d54911a2f84.pdf
4. First Steps towards a Practical Implementation
Identify key points of interests
- Identify the nature of touchpoints available: is the data based on clicks? If so, is there a way to complement the data with A/B tests to measure the influence of ads without clicks (display, video) ? For example, what happens to sales when display campaign is removed? Analysing this multiplier effect would give the overall responsibility of display on sales, to be deduced from current attribution values given to click-based channels. More interestingly, what is the impact of the removal of display campaign on the occurences of click-based campaigns ? This would give us an idea of the impact of display ads on the exposure to each other campaigns, which would help correct the attribution values more precisely at the campaign level.
- Define the KPI to track. From a pure Marketing perspective, looking at purchases may be sufficient, but from a financial perspective looking at profits, though a bit more difficult to compute, may drive more interesting results.
- Define a customer journey. It may seem obvious, but the notion needs to be clarified at first. Would it be defined by a time limit? If so, which one? Does it end when a conversion is observed? For example, if a customer makes 2 purchases, would the campaigns he’s been exposed to before the first order still be accounted for in the second order? If so, with a time decay?
- Define the research framework: are we interested only in customer journeys which have led to conversions or in all journeys? Keep in mind that successful customer journeys are a non-representative sample of customer journeys. Models built on the analysis of biased samples may be conservative. Take an extreme example: 80% of customers who see campaign A buy the product, VS 1% for campaign B. However, campaign B exposure is great and 100 Million people see it VS only 1M for campaign A. An Attribution Model based on successful journeys will give higher credit to campaign B which is an auguable conclusion. Taking into account costs per campaign (in the case where costs are calculated by clicks) may of course tackle this issue partly, as campaign A could then exhibit higher returns, but a serious fallacious reasonning is at stake here.
Analyse the typical customer journey
- Performing a duration analysis on the data may help you improve the definition of the customer journey to be used by your organization. After which days are converison probabilities null? Should we consider the effect of campaigns disappears after x days without orders? For example, if 99% of orders are placed in the 30 days following a first click, it might be interesting to define the customer journey as a 30 days time frame following the first oder.
- Look at the distribution of the number of campaigns in a typical journey. If you choose to calculate the effect of campaigns interraction in your Attribution Model, it may indeed help you determine the maximum number of campaigns to be included in a combination. Indeed, you may not need to assess the impact of channel combinations with above than 4 different channels if 95% of orders are placed after less then 4 campaigns.
- Transition matrixes: what if a campaign A systematically leads to a campaign B? What happens if we remove A or B? These insights would give clues to ask precise questions for a latter AB test, for example to find out if there is complementarity between channels A and B – (implying none should be removed) or mere substitution (implying one can be given up).
- If conversion rates are available: it can be interesting to perform a survival analysis i.e to analyse the likelihood of conversion based on duration since first click. This could help us excluse potential outliers or individuals who have very low conversion probabilities.
Summary
Attribution is a complex topic which will probably never be definitively solved. Indeed, a main issue is the difficulty, or even impossibility, to evaluate precisely the accuracy of the attribution model that we’ve built. Attribution Models should be seen as a good yet always improvable approximation of the incremental values of campaigns, and be presented with their intrinsinc limits and biases.



 David M. Raab is as a consultant specialized in marketing software and service vendor selection, marketing analytics and marketing technology assessment. Furthermore he is the founder of the Customer Data Platform Institute which is a vendor-neutral educational project to help marketers build a unified customer view that is available to all of their company systems.