Ein Einblick in die Aktienmärkte unter Berücksichtigung von COVID-19

Einleitung

Die COVID-19-Pandemie hat uns alle fest im Griff. Besonders die Wirtschaft leidet stark unter den erforderlichen Maßnahmen, die weltweit angewendet werden. Wir wollen daher die Gelegenheit nutzen einen Blick auf die Aktienkurse zu wagen und analysieren, inwieweit der Virus einen Einfluss auf das Wachstum des Marktes hat.

Rahmenbedingungen

Zuallererst werden wir uns auf die Industrie-, Schwellenländer und Grenzmärkte konzentrieren. Dafür nutzen wir die MSCI Global Investable Market Indizes (kurz GIMI), welche die zuvor genannten Gruppen abbilden. Die MSCI Inc. ist ein US-amerikanischer Finanzdienstleister und vor allem für ihre Aktienindizes bekannt.

Aktienindizes sind Kennzahlen der Entwicklung bzw. Änderung einer Auswahl von Aktienkursen und können repräsentativ für ganze Märkte, spezifische Branchen oder Länder stehen. Der DAX ist zum Beispiel ein Index, welcher die Entwicklung der größten 30 deutschen Unternehmen zusammenfasst.

Leider sind die Daten von MSCI nicht ohne weiteres zugänglich, weshalb wir unsere Analysen mit ETFs (engl.: “Exchange Traded Fund”) durchführen werden. ETFs sind wiederum an Börsen gehandelte Fonds, die von Fondgesellschaften/-verwaltern oder Banken verwaltet werden.

Für unsere erste Analyse sollen folgende ETFs genutzt werden, welche die folgenden Indizes führen:

Index Beschreibung ETF
MSCI World über 1600 Aktienwerte aus 24 Industrieländern iShares MSCI World ETF
MSCI Emerging Markets ca. 1400 Aktienwerte aus 27 Schwellenländern iShares MSCI Emerging Markets ETF
MSCI Frontier Markets Aktienwerte aus ca. 29 Frontier-Ländern iShares MSCI Frontier 100 ETF

Tab.1: MSCI Global Investable Market Indizes mit deren repräsentativen ETFs

Datenquellen

Zur Extraktion der ETF-Börsenkurse nehmen wir die yahoo finance API zur Hilfe. Mit den richtigen Symbolen können wir die historischen Daten unserer ETF-Auswahl ausgeben lassen. Wie unter diesem Link für den iShares MSCI World ETF zu sehen ist, gibt es mehrere Werte in den historischen Daten. Für unsere Analyse nutzen wir den Wert, nachdem die Börse geschlossen hat.

Da die ETFs in ihren Kurswerten Unterschiede haben und uns nur die relative Entwicklung interessiert, werden wir relative Werte für die Analyse nutzen. Der Startzeitpunkt soll mit dem 06.01.2020 festgelegt werden.

Die Daten über bestätigte Infektionen mit COVID-19 entnehmen wir aus der Hochrechnung der Johns Hopkins Universität.

Correlation between confirmed cases and growth of MSCI GIMI
Abb.1: Interaktives Diagramm: Wachstum der Aktienmärkte getrennt in Industrie-, Schwellen-, Frontier-Länder und deren bestätigten COVID-19 Fälle über die Zeit. Die bestätigten Fälle der jeweiligen Märkte basieren auf der Aufsummierung der Länder, welche auch in den Märkten aufzufinden sind und daher kann es zu Unterschieden bei den offiziellen Zahlen kommen.

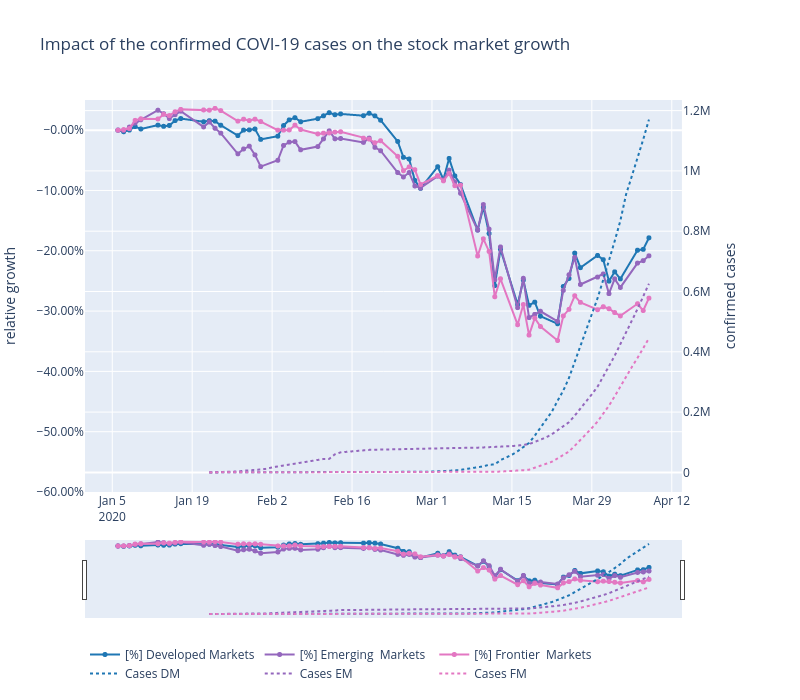
Interpretation des Diagramms

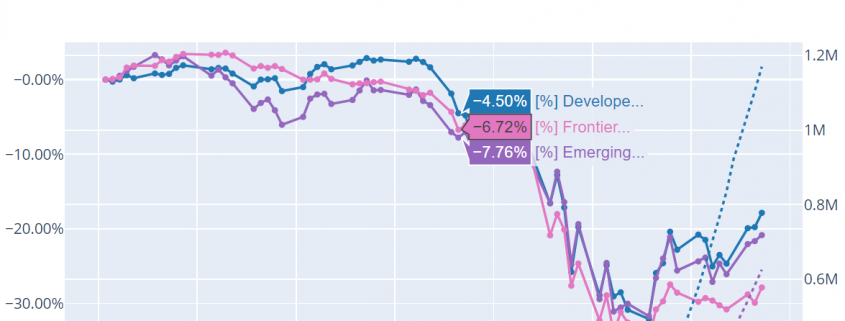
Auf den ersten Blick sieht man deutlich, dass mit steigenden COVID-19 Fällen die Aktienkurse bis zu -31% einbrechen. (Anfangszeitpunkt: 06.01.2020 Endzeitpunkt: 09.04.2020)

Betrachten wir den Anfang des Diagramms so sehen wir einen Einbruch der Emerging Markets, welche eine Gewichtung von 39.69 % (Stand 09.04.20) chinesische Aktien haben. Am 17.01.20 verzeichnen die Emerging Marktes noch ein Plus von 3.15 % gegenüber unserem Startzeitpunkt, wohingegen wir am 01.02.2020 ein Defizit von -6.05 % gegenüber dem Startzeitpunkt haben, was ein Einbruch von -9.20 % zum 17.01.2020 entspricht. Da der Ursprung des COVID-19 Virus auch in China war, könnte man diesen Punkt als Grund des Einbruches interpretieren. Die Industrie- und  Frontier-Länder bleiben hingegen recht stabil und auch deren bestätigten Fälle sind noch sehr niedrig.

Die Industrieländer erreichen ihren Höchststand am 19.02.20 mit einem Plus von 2.80%. Danach brachen alle drei Märkte deutlich ein. Auch in diesem Zeitraum gab es die ersten Todesopfer in Europa und in den USA. Der derzeitige Tiefpunkt, welcher am 23.03.20 zu registrieren ist, beläuft sich für die Industrieländer -32.10 %, Schwellenländer 31.7 % und Frontier-Länder auf -34.88 %.

Interessanterweise steigen die Marktwerte ab diesem Zeitpunkt wieder an. Gründe könnten die Nachrichten aus China sein, welche keine weiteren Neu-Infektionen verzeichnen, die FED dem Markt bis zu 1.5 Billionen Dollar zur Verfügung stellt und/oder die Ankündigung der Europäische Zentralbank Anleihen in Höhe von 750 MRD. Euro zu kaufen. Auch in Deutschland wurden große Hilfspakete angekündigt.

Um detaillierte Aussagen treffen zu können, müssen wir uns die Kurse auf granularer Ebene anschauen. Durch eine gezieltere Betrachtung auf Länderebene könnten Zusammenhänge näher beschrieben werden.

Wenn du dich für interaktive Analysen interessierst und tiefer in die Materie eintauchen möchtest: DATANOMIQ COVID-19 Dashboard

Hier haben wir ein Dashboard speziell für Analysen für die Aktienmärkte, welches stetig verbessert wird. Auch sollen Krypto-Währungen bald implementiert werden. Habt ihr Vorschläge und Verbesserungswünsche, dann lasst gerne ein Kommentar da!

Optimize AI Talent: Perception from Across the Globe

Despite the AI hype, the AI skill gap is turning into some pariah while businesses are accelerating to become demigods.

Reports from the “Global Talent Competitiveness Index (GTCI) 2020” cover multiple parameters both national and organizational to generate insight for further action. This report compiles 70 variables including 132 national economies across the globe – based on all groups of income and at every developmental level.

The sole purpose of the GTCI report is to narrow down the skill gap by delivering the right data inputs. The figures mentioned in the report could be of value to private and public organizations.

GTCI report covered multiple themes that need to be addressed: –

As the race to embrace AI spurs, it is evident to address the challenges faced due to AI and how best these problems can be solved.

The pace at which AI is developing is transforming the way we work, forcing a technology shift, change in the corporate structure, changing the innovation system for AI professionals in every possible way.

There’s more that is needed to be done as AI and automation continue to affect the way we work.

  • Reskilling in workplaces to eliminate dearth of talent

As the role in AI keeps evolving, organizations need a larger workforce, especially to play technology roles such as AI engineers and AI specialists. Looking closely at the statistics you may not fail to notice that the number of AI job roles is on the rise, but there’s scarce talent.

Employers must take on reskilling as a critical measure. Else how will the technology market keep up with changing trends? Reskilling in the form of training or AI certifications should be emphasized. Having an in-house AI talent is an added advantage to the company.

  • Skill gap between growing countries (low performing and high performing) are widening

Based on the GTCI report, it is seen there is a skill gap happening not only across industries but between nations. The report also highlights which country lacks basic digital skills, and this highly gets contributed toward a digital divide between nations.

  • High-level of cooperation needed to embrace AI benefits

As much as the world shows concern toward embracing AI, not much has been done to achieve these transformations. And AI has huge potential to transform society and make it a better place to live. However, to embrace these benefits, corporations must engage in AI regulation.

From a talent acquisition perspective, this simply means employers will need more training and reskilling opportunities.

  • AI to allow nations to skip generations

On a technological front, AI makes it possible to skip generations in developed nations. Although, not common due to structural obstruction.

  • Cities are now competing to become talent magnets and AI hubs

As AI continues to hit the market, organizations are aggressively coming up with newer policies to attract and retain AI professionals.

No doubt, cities are striving to attract the right kind of talent as competition keeps increasing. As such many cities are competing in becoming core AI engines in transforming energy grids, transportation, and many other multiple segments. Cities are now becoming the main test beds for AI-based tools i.e. self-driven vehicles, tele-surveillance, and facial recognition.

  • Sustainable AI comes when the society is equally up for it

With certain communities not adopting and accepting the advent of AI, it is difficult to say whether these communities will not try to distort AI narratives. As a result, it is crucial for multiple stakeholders to embrace AI and developed the AI workforce in parallel.

Not to forget, regulators and policy-makers have an equal role to play to ensure there’s a smooth transition in jobs. As AI-induced transformation skyrockets, educators and leaders need to move quickly as the new generations’ complete focus is entirely based on doing their bit to the society.

Two decades passed ever since McKinsey declared the war for talent – particularly for high-performing employees. As organizations are extensively looking to hire the right talent, it is imperative to retain and attract talent at large.

Despite the unprecedented growth in AI technologies, it is near to being unanimous regarding having hold of organizations to master in AI, forget about retaining talent. They’re not even getting better at it.

Even top tech companies such as Google and Amazon, the demand for top talent outstrips the supply. Although you may find thousands of candidates applying for the same job role, the competition just gets tougher since such employers are tough nuts and pleasing them is not an easy task.

If these tech giants are finding it difficult to hire the right talent, you could imagine the plight of other companies.

Given the optimistic view regarding the technology future, it is much more challenging to convince that the war for talent truly resembles the war on talent.

The good news is organizations that look forward to adopting new technology and reskill their employees will most likely thrive in the competitive edge.

Predictive Analytics World for Industry 4.0

Difficult times call for creative measures

Predictive Analytics World for Industry 4.0 will go virtual and you still have time to join us!

What do you have in store for me?

We will provide a live-streamed virtual version of PAW Industry 4.0 Munich 2020 on 11-12 May, 2020: you will be able to attend sessions and to interact and connect with the speakers and fellow members of the data science community including sponsors and exhibitors from your home or your office.

What about the workshops?

The workshops will also be held virtually on the planned date:
13 May, 2020.

Get a complimentary virtual sneak preview!

If you would like to join us for a virtual sneak preview of the workshop „Data Thinking“ on Thursday, April 16, so you can familiarise yourself with the quality of the virtual edition of both conference and workshops and how the interaction with speakers and attendees works, please send a request to registration@risingmedia.com.

Don’t have a ticket yet?

It‘s not too late to join the data science community.
Register by 10 May to receive access to the livestream and recordings.

REGISTER HERE

We’re looking forward to see you – virtually!

This year Predictive Analytics World for Industry 4.0 runs alongside Deep Learning World and Predictive Analytics World for Healthcare.

Article series: 5 Clean Coding Tips – 3. Take Advantage of the Formatting Tools.

This is the third of the article series “5 tips for clean coding” to follow as soon as you’ve made the first steps into your coding career, in this article series. Read the introduction here, to find out why it is important to write clean code if you missed it.

Unfortunately, no automatic formatting tool will correct the logic in your code, suggest meaningful names of your variables or comment the code for you. Yet. Gmail has lately started suggesting email titles based on email content. AI-powered variable naming can be next, who knows. Anyway, the visual level of the code is much easier to correct and there are tools that will do some of the code formatting on the visual level job for you. Some of them might be already existing in your IDE, you just need to look for them a bit, others need to be installed. One of the most popular formatting tools is pylint[i]. It is worth checking it out and learning to use it in an efficient way.

Beware that as convenient as it may seem to copy and paste your code into a quick online ‘beautifier’ it is not always a good idea. The online tools might store your code. If you are working on something that shouldn’t just freely float in the world wide web, stick to reliable tools like pylint, that will store the data within your working directory.

These tools can become very good friends of yours but also very annoying ones. They will not miss single whitespace and will not keep their mouth shut when your line length jumps from 79 to 80 characters. They will be shouting with an underscoring of some worrying color and/or exclamation marks. You will need to find your way to coexist and retain your sanity. It can be very distracting when you are in a working flow and warnings pop up all the time about formatting details that have nothing to do with what you are trying to solve. Sometimes, it might be better to turn those warnings off while you are in your most concentrated/creative phase of writing and turn them back on while the dust of your genius settles down a little bit. Usually the offer a lot of flexibility, regarding which warnings you want to be ignored and other features. The good thing is, they also teach you what are mistakes that you are making and after some time you will just stop making them in the first place.

References:

[i] https://www.pylint.org/

Top 7 MBA Programs to Target for Business Analytics 

Business Analytics refers to the science of collecting, analysing, sorting, processing and compiling various available data pertaining to different areas and facets of business. It also includes studying and scrutinising the information for useful and deep insights into the functioning of a business which can be used smartly for making important business-related decisions and changes to the existing system of operations. This is especially helpful in identifying all loopholes and correcting them.

The job of a business analyst is spread across every domain and industry. It is one of the highest paying jobs in the present world due to the sheer shortage of people with great analytical minds and abilities. According to a report published by Ernst & Young in 2019, there is a 50% rise in how firms and enterprises use analytics to drive decision making at a broad level. Another reason behind the high demand is the fact that nowadays a huge amount of data is generated by all companies, large or small and it usually requires a big team of analysts to reach any successful conclusion. Also, the nature and high importance of the role compels every organisation and firm to look for highly qualified and educated professionals whose prestigious degrees usually speak for them.

An MBA in Business Analytics, which happens to be a branch of Business Intelligence, also prepares one for a successful career as a management, data or market research analyst among many others. Below, we list the top 7 graduate school programs in Business Analytics in the world that would make any candidate ideal for this high paying job.

1 New York University – Stern School of Business

Location: New York City, United States

Tuition Fees: $74,184 per year

Duration:  2 years (full time)

With a graduate acceptance rate of 23%, the NYU Stern School makes it to this list due to the diversity of the course structure that it offers in its MBA program in Business Analytics. One can specialise and learn the science behind econometrics, data mining, forecasting, risk management and trading strategies by being a part of this program. The School prepares its students and offers employability in fields of investment banking, marketing, consulting, public finance and strategic planning. Along with opportunities to study abroad for small durations, the school also offers its students ample chances to network with industry leaders by means of summer internships and career workshops. It is a STEM designated two-year, full time degree program.

2 University of Pennsylvania – Wharton School Business 

Location: Philadelphia, United States

Tuition fees: $81,378 per year

Duration: 20 months (full time, including internship)

The only Ivy-League school in the list with one of the best Business Analytics MBA programs in the world, Wharton has an acceptance rate of 19% only. The tough competition here is also characterised by the high range of GMAT scores that most successful applicants have – it lies between 540 and 790, averaging at a very high threshold of 732. Most of Wharton’s graduating class finds employment in a wide range of sectors including consulting, financial services, technology, real estate and health care among many others. The long list of Wharton’s alumni includes some of the biggest business entities in the world, them being – Warren Buffet, Elon Musk, Sundar Pichai, Ronald Perelman and John Scully.

The best part about Wharton’s program structure is its focus on building leadership and a strong sense of teamwork in every student.

3 Carnegie Mellon University – Tepper School of Business

Location: Pittsburgh, United States

Tuition Fees: $67,575

Duration: 18 months (online)

The Tepper School of Business in Carnegie Mellon University is the only graduate school in the list that offers an online Master of Science program in Business Analytics. The primary objectives of the program is to equip students with creative problem solving expertise and deep analytic skills. The highlights of the program include machine learning, programming in Python and R, corporate communication and the knowledge of various business domains like marketing, finance, accounting and operations.

The various sub courses offered within the program include statistics, data management, data analytics in finance, data exploration and optimization for prescriptive analytics. There are several special topics offered too, like Ethics in Artificial Intelligence and People Analytics among many others.

4 Massachusetts Institute of Technology – Sloan School of Management

Location: Cambridge, United States

Tuition Fees: $136,480

Duration: 12 months

The Master of Business Analytics program at MIT Sloan is a relatively new program but has made it to this list due to MIT’s promise and commitment of academic and all-rounder excellence. The program is offered in association with MIT’s Operations Research Centre and is customised for students who wish to pursue a career in the industry of data sciences. The program is easily comprehensible for students from any educational background. It is a STEM designated program and the curriculum includes several modules like machine learning, usage of analytics software tools like Python, R, SQL and Julia. It also includes courses on ethics, data privacy and a capstone project.

5 University of Chicago – Graham School

Location: Chicago, United States

Tuition Fees: $4,640 per course

Duration: 12 months (full time) or 4 years (part time)

The Graham School in the University of Chicago is mainly interested in candidates who show love and passion for analytics. An incoming class at Graham usually consists of graduates in science or social science, professionals in an early career who wish to climb higher in the job ladder and mid-career professionals who wish to better their analytical skills and enhance their decision-making prowess.

The curriculum at Graham includes introduction to statistics, basic levels of programming in analytics, linear and matrix algebra, machine learning, time series analysis and a compulsory core course in leadership skills. The acceptance rate of the program is relatively higher than the previous listed universities at 34%.

6 University of Warwick – Warwick Business School

Location: Coventry, United Kingdom

Tuition Fees: $34,500

Duration: 12 months (full time)

The only school to make it to this list from the United Kingdom and the only one outside of the United States, the Warwick Business School is ranked 7th in the world by the QS World Rankings for their Master of Science degree in Business Analytics. The course aims to build strong and impeccable quantitative consultancy skills in its candidates. One can also look forward to improving their business acumen, communication skills and commercial research experience after graduating out of this program.

The school has links with big corporates like British Airways, IBM, Proctor and Gamble, Tesco, Virgin Media and Capgemini among others where it offers employment for its students.

7 Columbia University – School of Professional Studies

Location: New York City, United States 

Tuition Fees: $2,182 per point

Duration: 1.5 years full time (three terms)

The Master of Sciences program in Applied Analytics at Columbia University is aimed for all decision makers and also favours candidates with strong critical thinking and logical reasoning abilities. The curriculum is not very heavy on pure stats and data sciences but it allows students to learn from extremely practical and real-life experiences and examples. The program is a blend of several online and on-campus classes with several week-long courses also. A large number of industry experts and guest lectures take regular classes, conduct workshops and seminars for exposing the students to the real-world scenario of Business Analytics. This also gives the students a solid platform to network and broaden their perspective.

Several interesting courses within the paradigm of the program includes storytelling with data, research design, data management and a capstone project.

The admission to every school listed above is extremely competitive and with very limited intake. However, as it is rightly said, hard work is the key to success, one can rest guaranteed that their career will never be the same if they make it into any of these programs.

Krisenerkennung und -bewältigung mit Daten und KI

Wie COVID-19 unser Verständnis für Daten und KI verändert

Personenbezogene Daten und darauf angewendete KI galten hierzulande als ein ganz großes Pfui. Die Virus-Krise ändert das – Zurecht und mit großem Potenzial auch für die Wirtschaft.

Aber vorab, wie hängen Daten und Künstliche Intelligenz (KI) eigentlich zusammen? Dies lässt sich einfach und bildlich erläutern, denn Daten sind sowas wie der Rohstoff für die KI als Motor. Und dieser Motor ist nicht nur als Metapher zu verstehen, denn KI bewegt tatsächlich etwas, z. B. automatisierte Prozesse in Marketing, Vertrieb, Fertigung, Logistik und Qualitätssicherung. KI schützt vor Betrugsszenarien im Finanzwesen oder Ausfallszenarien in der produzierenden Industrie.

KI schützt jeden Einzelnen aber auch vor fehlenden oder falschen Diagnosen in der Medizin und unsere Gesellschaft vor ganzen Pandemien. Das mag gerade im Falle des SARS-COV-2 in 2019 in der VR China und 2020 in der ganzen Welt noch nicht wirklich geklappt zu haben, aber es ist der Auslöser und die Probe für die nun vermehrten und vor allem den verstärkten Einsatz von KI als Spezial- und Allgemein-Mediziner.

KI stellt spezielle Diagnosen bereits besser als menschliche Gehirne es tun

Menschliche Gehirne sind wahre Allrounder, sie können nicht nur Mathematik verstehen und Sprachen entwickeln und anwenden, sondern auch Emotionen lesen und vielfältige kreative Leistungen vollbringen. Künstliche Gehirne bestehen aus programmierbaren Schaltkreisen, die wir über mehrere Abstraktionen mit Software steuern und unter Einsatz von mathematischen Methoden aus dem maschinellen Lernen gewissermaßen auf die Mustererkennung abrichten können. Diese gerichteten Intelligenzen können sehr viel komplexere Muster in sehr viel mehr und heterogenen Daten erkennen, die für den Menschen nicht zugänglich wären. Diesen Vorteil der gerichteten künstlichen Intelligenz werden wir Menschen nutzen – und tun es teilweise schon heute – um COVID-19 automatisiert und sehr viel genauer anhand von Röntgen-Bildern zu erkennen.

Dies funktioniert in speziellen Einsätzen auch für die Erkennung von verschiedenen anderen Lungen-Erkrankungen sowie von Knochenbrüchen und anderen Verletzungen sowie natürlich von Krebs und Geschwüren.

Die Voraussetzung dafür, dass dieser Motor der automatisierten und akkuraten Erkennung funktioniert, ist die Freigabe von vielen Daten, damit die KI das Muster zur Diagnose erlernen kann.

KI wird Pandemien vorhersagen

Die Politik in Europa steht viel in der Kritik, möglicherweise nicht richtig und rechtzeitig auf die Pandemie reagiert zu haben. Ein Grund dafür mögen politische Grundprinzipien sein, ein anderer ist sicherlich das verlässliche Vorhersage- und Empfehlungssystem für drohende Pandemien. Big Data ist der Treibstoff, der diese Vorhersage-Systeme mit Mustern versorgt, die durch Verfahren des Deep Learnings erkannt und systematisch zur Generalisierung erlernt werden können.

Um viele Menschenleben und darüber hinaus auch berufliche Existenzen zu retten, darf der Datenschutz schon mal Abstriche machen. So werden beispielsweise anonymisierte Standort-Daten von persönlichen Mobilgeräten an das Robert-Koch-Institut übermittelt, um die Corona-Pandemie besser eindämmen zu können. Hier haben wir es tatsächlich mit Big Data zutun und die KI-Systeme werden besser, kämen auch noch weitere Daten zur medizinischen Versorgung, Diagnosen oder Verkehrsdaten hinzu. Die Pandemie wäre transparenter als je zuvor und Virologen wie Alexander Kekulé von der Martin-Luther-Universität in Halle-Wittenberg haben die mathematische Vorhersagbarkeit schon häufig thematisiert. Es fehlten Daten und die Musterkennung durch die maschinellen Lernverfahren, die heute dank aktiver Forschung in Software und Hardware (Speicher- und Rechenkapazität) produktiv eingesetzt werden können.

Übrigens darf auch hier nicht zu kurz gedacht werden: Auch ganz andere Krisen werden früher oder später Realität werden, beispielsweise Energiekrisen. Was früher die Öl-Krise war, könnten zukünftig Zusammenbrüche der Stromnetze sein. Es braucht nicht viel Fantasie, dass KI auch hier helfen wird, Krisen frühzeitig zu erkennen, zu verhindern oder zumindest abzumildern.

KI macht unseren privaten und beruflichen Alltag komfortabler und sicherer

Auch an anderer Front kämpfen wir mit künstlicher Intelligenz gegen Pandemien sozusagen als Nebeneffekt: Die Automatisierung von Prozessen ist eine Kombination der Digitalisierung und der Nutzung der durch die digitalen Produkte genierten Daten. So werden autonome Drohnen oder autonome Fahrzeuge vor allem im Krisenfall wichtige Lieferungen übernehmen und auch Bezahlsysteme bedingen keinen nahen menschlichen Kontakt mehr. Und auch Unternehmen werden weniger Personal physisch vor Ort am Arbeitsplatz benötigen, nicht nur dank besserer Telekommunikationssysteme, sondern auch, weil Dokumente nur noch digital vorliegen und operative Prozesse datenbasiert entschieden und dadurch automatisiert ablaufen.

So blüht uns also eine schöne neue Welt ohne Menschen? Nein, denn diese werden ihre Zeit für andere Dinge und Berufe einsetzen. Menschen werden weniger zur roboter-haften Arbeitskraft am Fließband, an der Kasse oder vor dem Steuer eines Fahrzeuges, sondern sie werden menschlicher, denn sie werden sich entweder mehr mit Technologie befassen oder sich noch sozialere Tätigkeiten erlauben können. Im Krisenfall jedoch, werden wir die dann unangenehmeren Tätigkeiten vor allem der KI überlassen.

Einführung in die Welt der Autoencoder

An wen ist der Artikel gerichtet?

In diesem Artikel wollen wir uns näher mit dem neuronalen Netz namens Autoencoder beschäftigen und wollen einen Einblick in die Grundprinzipien bekommen, die wir dann mit einem vereinfachten Programmierbeispiel festigen. Kenntnisse in Python, Tensorflow und neuronalen Netzen sind dabei sehr hilfreich.

Funktionsweise des Autoencoders

Ein Autoencoder ist ein neuronales Netz, welches versucht die Eingangsinformationen zu komprimieren und mit den reduzierten Informationen im Ausgang wieder korrekt nachzubilden.

Die Komprimierung und die Rekonstruktion der Eingangsinformationen laufen im Autoencoder nacheinander ab, weshalb wir das neuronale Netz auch in zwei Abschnitten betrachten können.


Der Encoder

Der Encoder oder auch Kodierer hat die Aufgabe, die Dimensionen der Eingangsinformationen zu reduzieren, man spricht auch von Dimensionsreduktion. Durch diese Reduktion werden die Informationen komprimiert und es werden nur die wichtigsten bzw. der Durchschnitt der Informationen weitergeleitet. Diese Methode hat wie viele andere Arten der Komprimierung auch einen Verlust.

In einem neuronalen Netz wird dies durch versteckte Schichten realisiert. Durch die Reduzierung von Knotenpunkten in den kommenden versteckten Schichten werden die Kodierung bewerkstelligt.

Der Decoder

Nachdem das Eingangssignal kodiert ist, kommt der Decoder bzw. Dekodierer zum Einsatz. Er hat die Aufgabe mit den komprimierten Informationen die ursprünglichen Daten zu rekonstruieren. Durch Fehlerrückführung werden die Gewichte des Netzes angepasst.

Ein bisschen Mathematik

Das Hauptziel des Autoencoders ist, dass das Ausgangssignal dem Eingangssignal gleicht, was bedeutet, dass wir eine Loss Funktion haben, die L(x , y) entspricht.

L(x, \hat{x})

Unser Eingang soll mit x gekennzeichnet werden. Unsere versteckte Schicht soll h sein. Damit hat unser Encoder folgenden Zusammenhang h = f(x).

Die Rekonstruktion im Decoder kann mit r = g(h) beschrieben werden. Bei unserem einfachen Autoencoder handelt es sich um ein Feed-Forward Netz ohne rückkoppelten Anteil und wird durch Backpropagation oder zu deutsch Fehlerrückführung optimiert.

Formelzeichen Bedeutung
\mathbf{x}, \hat{\mathbf{x}} Eingangs-, Ausgangssignal
\mathbf{W}, \hat{\mathbf{W}} Gewichte für En- und Decoder
\mathbf{B}, \hat{\mathbf{B}} Bias für En- und Decoder
\sigma, \hat{\sigma} Aktivierungsfunktion für En- und Decoder
L Verlustfunktion

Unsere versteckte Schicht soll mit \latex h 
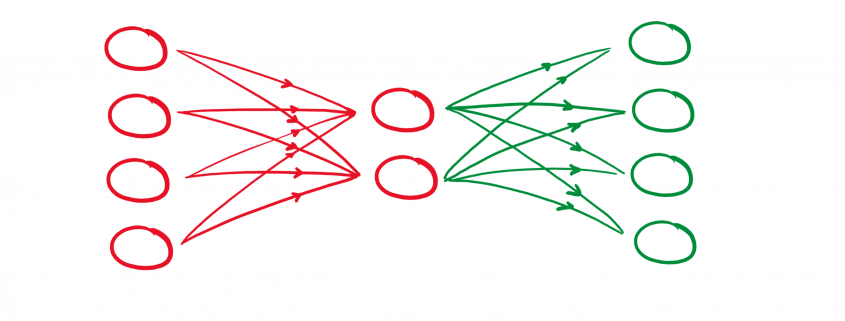
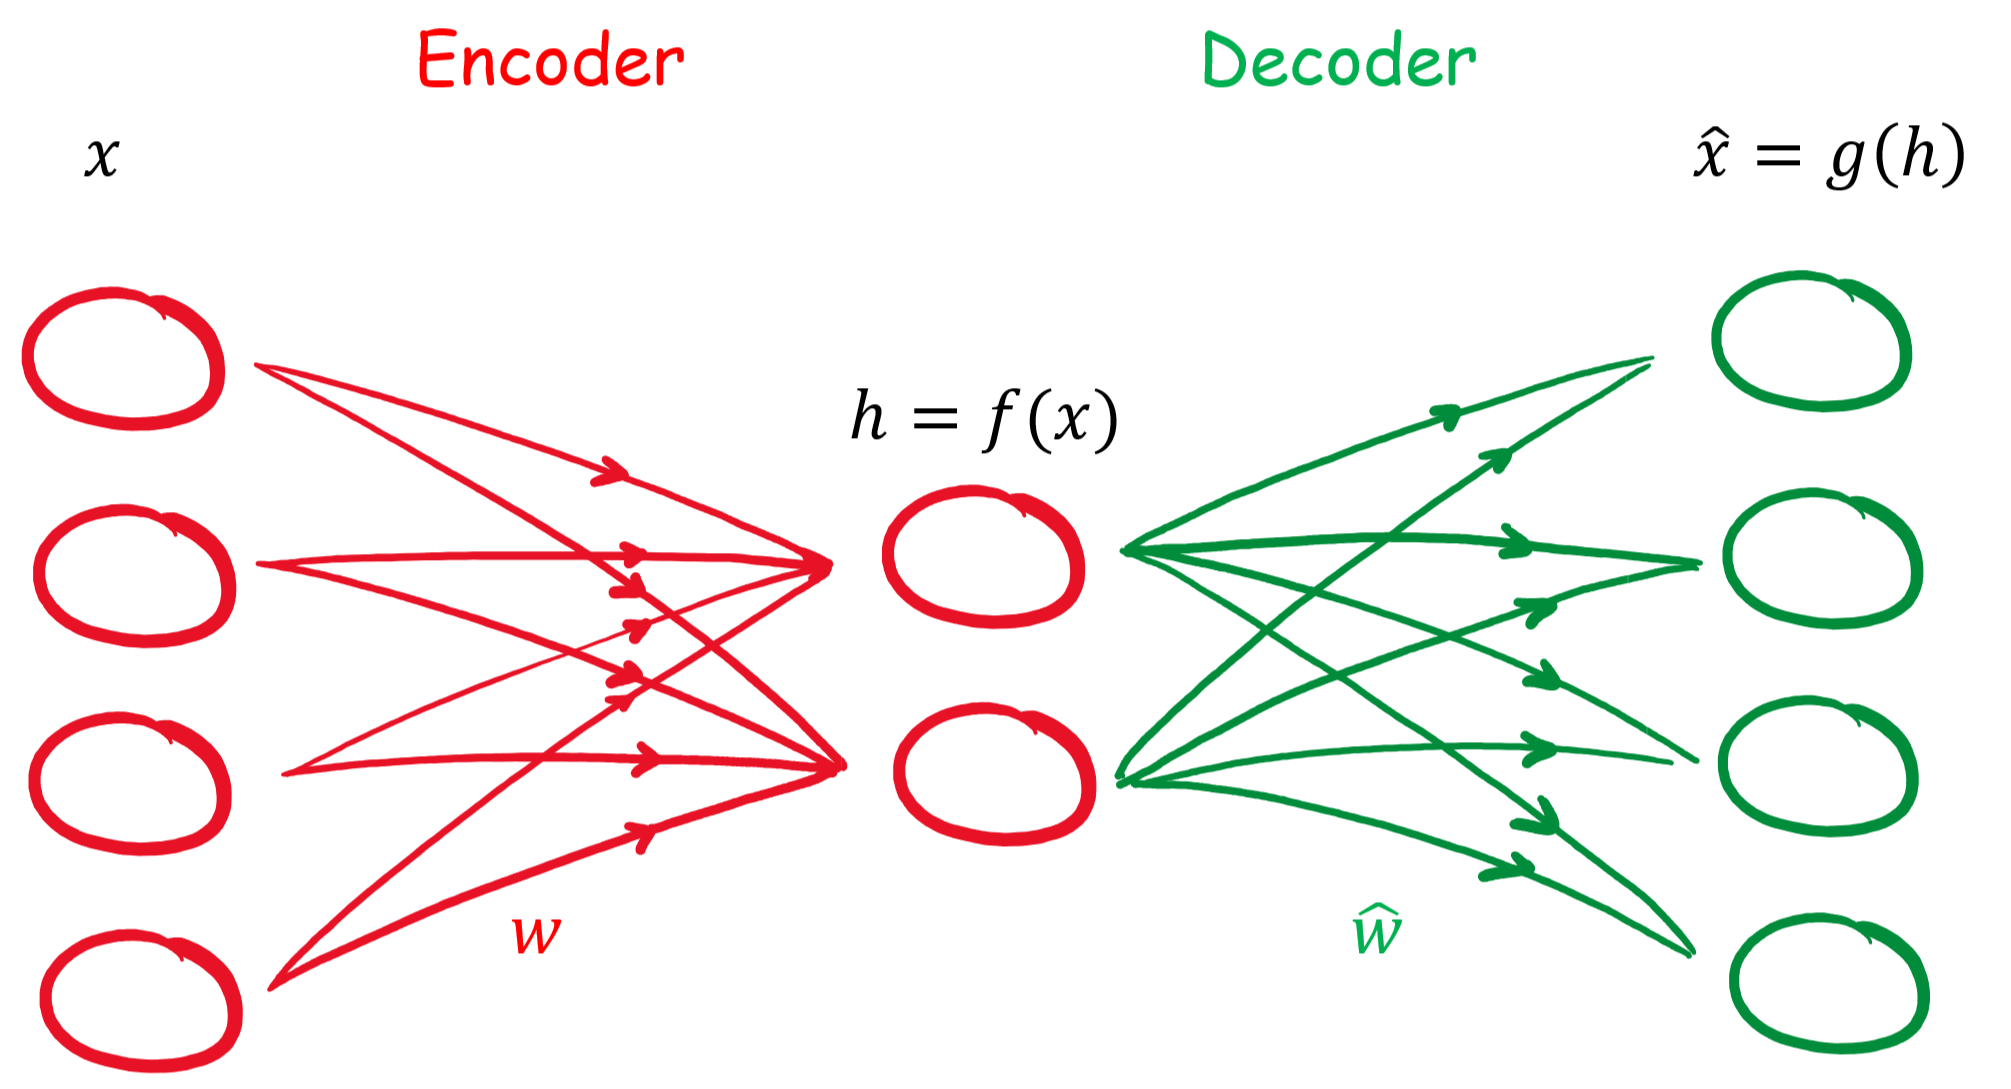
gekennzeichnet werden. Damit besteht der Zusammenhang:

(1)   \begin{align*} \mathbf{h} &= f(\mathbf{x}) = \sigma(\mathbf{W}\mathbf{x} + \mathbf{B}) \\ \hat{\mathbf{x}} &= g(\mathbf{h}) = \hat{\sigma}(\hat{\mathbf{W}} \mathbf{h} + \hat{\mathbf{B}}) \\ \hat{\mathbf{x}} &= \hat{\sigma} \{ \hat{\mathbf{W}} \left[\sigma ( \mathbf{W}\mathbf{x} + \mathbf{B} )\right]  + \hat{\mathbf{B}} \}\\ \end{align*}

Für eine Optimierung mit der mittleren quadratischen Abweichung (MSE) könnte die Verlustfunktion wie folgt aussehen:

(2)   \begin{align*} L(\mathbf{x}, \hat{\mathbf{x}}) &= \mathbf{MSE}(\mathbf{x}, \hat{\mathbf{x}}) = \|  \mathbf{x} - \hat{\mathbf{x}} \| ^2 &=  \| \mathbf{x} - \hat{\sigma} \{ \hat{\mathbf{W}} \left[\sigma ( \mathbf{W}\mathbf{x} + \mathbf{B} )\right]  + \hat{\mathbf{B}} \} \| ^2 \end{align*}


Wir haben die Theorie und Mathematik eines Autoencoder in seiner Ursprungsform kennengelernt und wollen jetzt diese in einem (sehr) einfachen Beispiel anwenden, um zu schauen, ob der Autoencoder so funktioniert wie die Theorie es besagt.

Dazu nehmen wir einen One Hot (1 aus n) kodierten Datensatz, welcher die Zahlen von 0 bis 3 entspricht.

    \begin{align*} [1, 0, 0, 0] \ \widehat{=}  \ 0 \\ [0, 1, 0, 0] \ \widehat{=}  \ 1 \\ [0, 0, 1, 0] \ \widehat{=}  \ 2 \\ [0, 0, 0, 1] \ \widehat{=} \  3\\ \end{align*}

Diesen Datensatz könnte wie folgt kodiert werden:

    \begin{align*} [1, 0, 0, 0] \ \widehat{=}  \ 0 \ \widehat{=}  \ [0, 0] \\ [0, 1, 0, 0] \ \widehat{=}  \ 1 \ \widehat{=}  \  [0, 1] \\ [0, 0, 1, 0] \ \widehat{=}  \ 2 \ \widehat{=}  \ [1, 0] \\ [0, 0, 0, 1] \ \widehat{=} \  3 \ \widehat{=}  \ [1, 1] \\ \end{align*}

Damit hätten wir eine Dimensionsreduktion von vier auf zwei Merkmalen vorgenommen und genau diesen Vorgang wollen wir bei unserem Beispiel erreichen.

Programmierung eines einfachen Autoencoders


Typische Einsatzgebiete des Autoencoders sind neben der Dimensionsreduktion auch Bildaufarbeitung (z.B. Komprimierung, Entrauschen), Anomalie-Erkennung, Sequenz-to-Sequenz Analysen, etc.

Ausblick

Wir haben mit einem einfachen Beispiel die Funktionsweise des Autoencoders festigen können. Im nächsten Schritt wollen wir anhand realer Datensätze tiefer in gehen. Auch soll in kommenden Artikeln Variationen vom Autoencoder in verschiedenen Einsatzgebieten gezeigt werden.