Posts

Data Science in Engineering Process - Product Lifecycle Management

How to develop digital products and solutions for industrial environments?

The Data Science and Engineering Process in PLM.

Huge opportunities for digital products are accompanied by huge risks

Digitalization is about to profoundly change the way we live and work. The increasing availability of data combined with growing storage capacities and computing power make it possible to create data-based products, services, and customer specific solutions to create insight with value for the business. Successful implementation requires systematic procedures for managing and analyzing data, but today such procedures are not covered in the PLM processes.

From our experience in industrial settings, organizations start processing the data that happens to be available. This data often does not fully cover the situation of interest, typically has poor quality, and in turn the results of data analysis are misleading. In industrial environments, the reliability and accuracy of results are crucial. Therefore, an enormous responsibility comes with the development of digital products and solutions. Unless there are systematic procedures in place to guide data management and data analysis in the development lifecycle, many promising digital products will not meet expectations.

Various methodologies exist but no comprehensive framework

Over the last decades, various methodologies focusing on specific aspects of how to deal with data were promoted across industries and academia. Examples are Six Sigma, CRISP-DM, JDM standard, DMM model, and KDD process. These methodologies aim at introducing principles for systematic data management and data analysis. Each methodology makes an important contribution to the overall picture of how to deal with data, but none provides a comprehensive framework covering all the necessary tasks and activities for the development of digital products. We should take these approaches as valuable input and integrate their strengths into a comprehensive Data Science and Engineering framework.

In fact, we believe it is time to establish an independent discipline to address the specific challenges of developing digital products, services and customer specific solutions. We need the same kind of professionalism in dealing with data that has been achieved in the established branches of engineering.

Data Science and Engineering as new discipline

Whereas the implementation of software algorithms is adequately guided by software engineering practices, there is currently no established engineering discipline covering the important tasks that focus on the data and how to develop causal models that capture the real world. We believe the development of industrial grade digital products and services requires an additional process area comprising best practices for data management and data analysis. This process area addresses the specific roles, skills, tasks, methods, tools, and management that are needed to succeed.
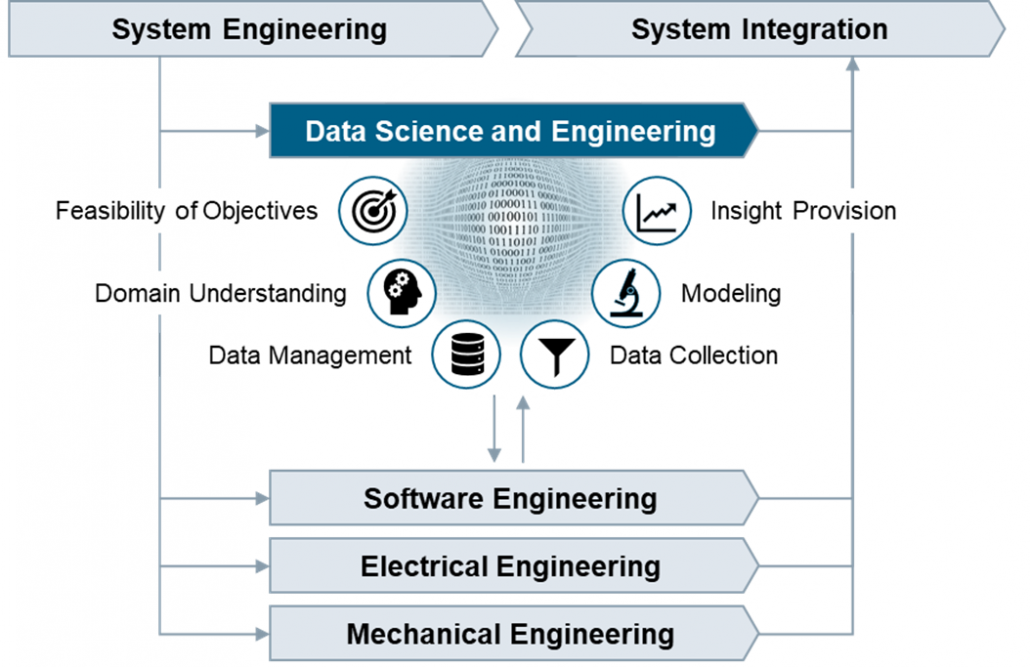
Figure: Data Science and Engineering as new engineering discipline

More than in other engineering disciplines, the outputs of Data Science and Engineering are created in repetitions of tasks in iterative cycles. The tasks are therefore organized into workflows with distinct objectives that clearly overlap along the phases of the PLM process.

Feasibility of Objectives
  Understand the business situation, confirm the feasibility of the product idea, clarify the data infrastructure needs, and create transparency on opportunities and risks related to the product idea from the data perspective.
Domain Understanding
  Establish an understanding of the causal context of the application domain, identify the influencing factors with impact on the outcomes in the operational scenarios where the digital product or service is going to be used.
Data Management
  Develop the data management strategy, define policies on data lifecycle management, design the specific solution architecture, and validate the technical solution after implementation.
Data Collection
  Define, implement and execute operational procedures for selecting, pre-processing, and transforming data as basis for further analysis. Ensure data quality by performing measurement system analysis and data integrity checks.
Modeling
  Select suitable modeling techniques and create a calibrated prediction model, which includes fitting the parameters or training the model and verifying the accuracy and precision of the prediction model.
Insight Provision
  Incorporate the prediction model into a digital product or solution, provide suitable visualizations to address the information needs, evaluate the accuracy of the prediction results, and establish feedback loops.

Real business value will be generated only if the prediction model at the core of the digital product reliably and accurately reflects the real world, and the results allow to derive not only correct but also helpful conclusions. Now is the time to embrace the unique chances by establishing professionalism in data science and engineering.

Authors

Peter Louis                               

Peter Louis is working at Siemens Advanta Consulting as Senior Key Expert. He has 25 years’ experience in Project Management, Quality Management, Software Engineering, Statistical Process Control, and various process frameworks (Lean, Agile, CMMI). He is an expert on SPC, KPI systems, data analytics, prediction modelling, and Six Sigma Black Belt.


Ralf Russ    

Ralf Russ works as a Principal Key Expert at Siemens Advanta Consulting. He has more than two decades experience rolling out frameworks for development of industrial-grade high quality products, services, and solutions. He is Six Sigma Master Black Belt and passionate about process transparency, optimization, anomaly detection, and prediction modelling using statistics and data analytics.4

Six properties of modern Business Intelligence

Regardless of the industry in which you operate, you need information systems that evaluate your business data in order to provide you with a basis for decision-making. These systems are commonly referred to as so-called business intelligence (BI). In fact, most BI systems suffer from deficiencies that can be eliminated. In addition, modern BI can partially automate decisions and enable comprehensive analyzes with a high degree of flexibility in use.


Read this article in German:
“Sechs Eigenschaften einer modernen Business Intelligence“


Let us discuss the six characteristics that distinguish modern business intelligence, which mean taking technical tricks into account in detail, but always in the context of a great vision for your own company BI:

1. Uniform database of high quality

Every managing director certainly knows the situation that his managers do not agree on how many costs and revenues actually arise in detail and what the margins per category look like. And if they do, this information is often only available months too late.

Every company has to make hundreds or even thousands of decisions at the operational level every day, which can be made much more well-founded if there is good information and thus increase sales and save costs. However, there are many source systems from the company’s internal IT system landscape as well as other external data sources. The gathering and consolidation of information often takes up entire groups of employees and offers plenty of room for human error.

A system that provides at least the most relevant data for business management at the right time and in good quality in a trusted data zone as a single source of truth (SPOT). SPOT is the core of modern business intelligence.

In addition, other data on BI may also be made available which can be useful for qualified analysts and data scientists. For all decision-makers, the particularly trustworthy zone is the one through which all decision-makers across the company can synchronize.

2. Flexible use by different stakeholders

Even if all employees across the company should be able to access central, trustworthy data, with a clever architecture this does not exclude that each department receives its own views of this data. Many BI systems fail due to company-wide inacceptance because certain departments or technically defined employee groups are largely excluded from BI.

Modern BI systems enable views and the necessary data integration for all stakeholders in the company who rely on information and benefit equally from the SPOT approach.

3. Efficient ways to expand (time to market)

The core users of a BI system are particularly dissatisfied when the expansion or partial redesign of the information system requires too much of patience. Historically grown, incorrectly designed and not particularly adaptable BI systems often employ a whole team of IT staff and tickets with requests for change requests.

Good BI is a service for stakeholders with a short time to market. The correct design, selection of software and the implementation of data flows / models ensures significantly shorter development and implementation times for improvements and new features.

Furthermore, it is not only the technology that is decisive, but also the choice of organizational form, including the design of roles and responsibilities – from the technical system connection to data preparation, pre-analysis and support for the end users.

4. Integrated skills for Data Science and AI

Business intelligence and data science are often viewed and managed separately from each other. Firstly, because data scientists are often unmotivated to work with – from their point of view – boring data models and prepared data. On the other hand, because BI is usually already established as a traditional system in the company, despite the many problems that BI still has today.

Data science, often referred to as advanced analytics, deals with deep immersion in data using exploratory statistics and methods of data mining (unsupervised machine learning) as well as predictive analytics (supervised machine learning). Deep learning is a sub-area of ​​machine learning and is used for data mining or predictive analytics. Machine learning is a sub-area of ​​artificial intelligence (AI).

In the future, BI and data science or AI will continue to grow together, because at the latest after going live, the prediction models flow back into business intelligence. BI will probably develop into ABI (Artificial Business Intelligence). However, many companies are already using data mining and predictive analytics in the company, using uniform or different platforms with or without BI integration.

Modern BI systems also offer data scientists a platform to access high-quality and more granular raw data.

5. Sufficiently high performance

Most readers of these six points will probably have had experience with slow BI before. It takes several minutes to load a daily report to be used in many classic BI systems. If loading a dashboard can be combined with a little coffee break, it may still be acceptable for certain reports from time to time. At the latest, however, with frequent use, long loading times and unreliable reports are no longer acceptable.

One reason for poor performance is the hardware, which can be almost linearly scaled to higher data volumes and more analysis complexity using cloud systems. The use of cloud also enables the modular separation of storage and computing power from data and applications and is therefore generally recommended, but not necessarily the right choice for all companies.

In fact, performance is not only dependent on the hardware, the right choice of software and the right choice of design for data models and data flows also play a crucial role. Because while hardware can be changed or upgraded relatively easily, changing the architecture is associated with much more effort and BI competence. Unsuitable data models or data flows will certainly bring the latest hardware to its knees in its maximum configuration.

6. Cost-effective use and conclusion

Professional cloud systems that can be used for BI systems offer total cost calculators, such as Microsoft Azure, Amazon Web Services and Google Cloud. With these computers – with instruction from an experienced BI expert – not only can costs for the use of hardware be estimated, but ideas for cost optimization can also be calculated. Nevertheless, the cloud is still not the right solution for every company and classic calculations for on-premise solutions are necessary.

Incidentally, cost efficiency can also be increased with a good selection of the right software. Because proprietary solutions are tied to different license models and can only be compared using application scenarios. Apart from that, there are also good open source solutions that can be used largely free of charge and can be used for many applications without compromises.

However, it is wrong to assess the cost of a BI only according to its hardware and software costs. A significant part of cost efficiency is complementary to the aspects for the performance of the BI system, because suboptimal architectures work wastefully and require more expensive hardware than neatly coordinated architectures. The production of the central data supply in adequate quality can save many unnecessary processes of data preparation and many flexible analysis options also make redundant systems unnecessary and lead to indirect savings.

In any case, a BI for companies with many operational processes is always cheaper than no BI. However, if you take a closer look with BI expertise, cost efficiency is often possible.

The Inside Out of ML Based Prescriptive Analytics

With the constantly growing number of data, more and more companies are shifting towards analytic solutions. Analytic solutions help in extracting the meaning from the huge amount of data available. Thus, improving decision making.

Decision making is an important aspect of businesses, and technologies like Machine Learning are enhancing it further. The growing use of Machine Learning has changed the way of prescriptive analytics. In order to optimize the efforts, companies need to be more accurate with the historical and present data. This is because the historical and present data are the essentials of analytics. This article helps describe the inside out of Machine Learning-based prescriptive analytics.

Phases of business analytics

Descriptive analytics, predictive analytics, and prescriptive analytics are the three phases of business analytics. Descriptive analytics, being the first one, deals with past performance. Historical data is mined to understand past performance. This serves as a way to look for the reasons behind past success and failure. It is a kind of post-mortem analysis and most management reporting like sales, marketing, operations, and finance etc. make use of this.

The second one is a predictive analysis which answers the question of what is likely to happen. The historical data is now combined with rules, algorithms etc. to determine the possible future outcome or likelihood of a situation occurring.

The final phase, well known to everyone, is prescriptive analytics. It can continually take in new data and re-predict and re-prescribe. This improves the accuracy of the prediction and prescribes better decision options.  Professional services or technology or their combination can be chosen to perform all the three analytics.

More about prescriptive analytics

The analysis of business activities goes through many phases. Prescriptive analytics is one such. It is known to be the third phase of business analytics and comes after descriptive and predictive analytics. It entails the application of mathematical and computational sciences. It makes use of the results obtained from descriptive and predictive analysis to suggest decision options. It goes beyond predicting future outcomes and suggests actions to benefit from the predictions. It shows the implications of each decision option. It anticipates on what will happen when it will happen as well as why it will happen.

ML-based prescriptive analytics

Being just before the prescriptive analytics, predictive analytics is often confused with it. What actually happens is predictive analysis leads to prescriptive analysis. Thus, a Machine Learning based prescriptive analytics goes through an ML-based predictive analysis first. Therefore, it becomes necessary to consider the ML-based predictive analysis first.

ML-based predictive analytics:

A lot of things prevent businesses from achieving predictive analysis capabilities.  Machine Learning can be a great help in boosting Predictive analytics. Use of Machine Learning and Artificial Intelligence algorithms helps businesses in optimizing and uncovering the new statistical patterns. These statistical patterns form the backbone of predictive analysis. E-commerce, marketing, customer service, medical diagnosis etc. are some of the prospective use cases for Machine Learning based predictive analytics.

In E-commerce, machine learning can help in predicting the usual choices of the customer. Thus, presenting him/her according to his/her likes and dislikes. It can also help in predicting fraudulent transaction. Similarly, B2B marketing also makes good use of Machine learning based predictive analytics. Customer services and medical diagnosis also benefit from predictive analytics. Thus, a prediction and a prescription based on machine learning can boost various business functions.

Organizations and software development companies are making more and more use of machine learning based predictive analytics. The advancements like neural networks and deep learning algorithms are able to uncover hidden information. This all requires a well-researched approach. Big data and progressive IT systems also act as important factors in this.

Data Science and Predictive Analytics in Healthcare

Doing data science in a healthcare company can save lives. Whether it’s by predicting which patients have a tumor on an MRI, are at risk of re-admission, or have misclassified diagnoses in electronic medical records are all examples of how predictive models can lead to better health outcomes and improve the quality of life of patients.  Nevertheless, the healthcare industry presents many unique challenges and opportunities for data scientists.

The impact of data science in healthcare

Healthcare providers have a plethora of important but sensitive data. Medical records include a diverse set of data such as basic demographics, diagnosed illnesses, and a wealth of clinical information such as lab test results. For patients with chronic diseases, there could be a long and detailed history of data available on a number of health indicators due to the frequency of visits to a healthcare provider. Information from medical records can often be combined with outside data as well. For example, a patient’s address can be combined with other publicly available information to determine the number of surgeons that practice near a patient or other relevant information about the type of area that patients reside in.

With this rich data about a patient as well as their surroundings, models can be built and trained to predict many outcomes of interest. One important area of interest is models predicting disease progression, which can be used for disease management and planning. For example, at Fresenius Medical Care (where we primarily care for patients with chronic conditions such as kidney disease), we use a Chronic Kidney Disease progression model that can predict the trajectory of a patient’s condition to help clinicians decide whether and when to proceed to the next stage in their medical care. Predictive models can also notify clinicians about patients who may require interventions to reduce risk of negative outcomes. For instance, we use models to predict which patients are at risk for hospitalization or missing a dialysis treatment. These predictions, along with the key factors driving the prediction, are presented to clinicians who can decide if certain interventions might help reduce the patient’s risk.

Challenges of data science in healthcare

One challenge is that the healthcare industry is far behind other sectors in terms of adopting the latest technology and analytics tools. This does present some challenges, and data scientists should be aware that the data infrastructure and development environment at many healthcare companies will not be at the bleeding edge of the field. However it also means there are a lot of opportunities for improvement, and even small simple models can yield vast improvements over current methods.

Another challenge in the healthcare sector arises from the sensitive nature of medical information. Due to concerns over data privacy, it can often be difficult to obtain access to data that the company has. For this reason, data scientists considering a position at a healthcare company should be aware of whether there is already an established protocol for data professionals to get access to the data. If there isn’t, be aware that simply getting access to the data may be a major effort in itself.

Finally, it is important to keep in mind the end-use of any predictive model. In many cases, there are very different costs to false-negatives and false-positives. A false-negative may be detrimental to a patient’s health, while too many false-positives may lead to many costly and unnecessary treatments (also to the detriment of patients’ health for certain treatments as well as economy overall). Education about the proper use of predictive models and their limitations is essential for end-users. Finally, making sure the output of a predictive model is actionable is important. Predicting that a patient is at high-risk is only useful if the model outputs is interpretable enough to explain what factors are putting that patient at risk. Furthermore, if the model is being used to plan interventions, the factors that can be changed need to be highlighted in some way – telling a clinician that a patient is at risk because of their age is not useful if the point of the prediction is to lower risk through intervention.

The future of data science in the healthcare sector

The future holds a lot of promise for data science in healthcare. Wearable devices that track all kinds of activity and biometric data are becoming more sophisticated and more common. Streaming data coming from either wearables or devices providing treatment (such as dialysis machines) could eventually be used to provide real-time alerts to patients or clinicians about health events outside of the hospital.

Currently, a major issue facing medical providers is that patients’ data tends to exist in silos. There is little integration across electronic medical record systems (both between and within medical providers), which can lead to fragmented care. This can lead to clinicians receiving out of date or incomplete information about a patient, or to duplication of treatments. Through a major data engineering effort, these systems could (and should) be integrated. This would vastly increase the potential of data scientists and data engineers, who could then provide analytics services that took into account the whole patients’ history to provide a level of consistency across care providers. Data workers could use such an integrated record to alert clinicians to duplications of procedures or dangerous prescription drug combinations.

Data scientists have a lot to offer in the healthcare industry. The advances of machine learning and data science can and should be adopted in a space where the health of individuals can be improved. The opportunities for data scientists in this sector are nearly endless, and the potential for good is enormous.

Neural Nets: Time Series Prediction

Artificial neural networks are very strong universal approximators. Google recently defeated the worlds strongest Go (“chinese chess”) player with two neural nets, which captured the game board as a picture. Aside from these classification tasks, neural nets can be used to predict future values, behaviors or patterns solely based on learned history. In the machine learning literature, this is often referred to as time series prediction, because, you know, values over time need to be predicted. Hah! To illustrate the concept, we will train a neural net to learn the shape of a sinusoidal wave, so it can continue to draw the shape without any help. We will do this with Scala. Scala is a great lang, because it is strongly typed but feels easy like Python. Throughout this article, I will use the library NeuroFlow, which is a simple, lightweight library I wrote to build and train nets. Because Open Source is the way to go, feel free to check (and contribute to? :-)) the code on GitHub.

Introduction of the shape

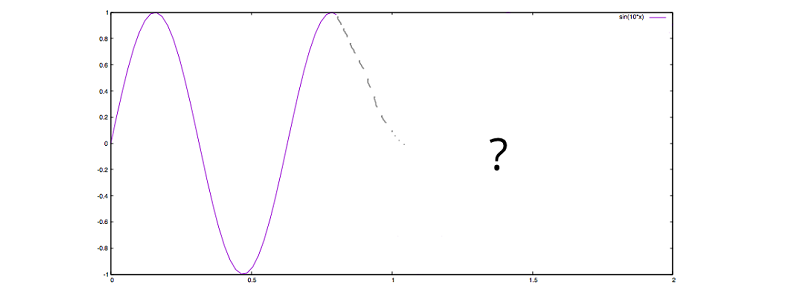
If we, as humans, want to predict the future based on historic observations, we would have no other chance but to be guided by the shape drawn so far. Let’s study the plot below, asking ourselves: How would a human continue the plot?

sinuspredictdr
f(x) = sin(10*x)

Intuitively, we would keep on oscillating up and down, just like the grey dotted line tries to rough out. To us, the continuation of the shape is reasonably easy to understand, but a machine does not have a gut feeling to ask for a good guess. However, we can summon a Frankenstein, which will be able to learn and continue the shape based on numbers. In order to do so, let’s have a look at the raw, discrete data of our sinusoidal wave:

x f(x)
0.0 0.0
0.05 0.479425538604203
0.10 0.8414709848078965
0.15 0.9974949866040544
0.20 0.9092974268256817
0.25 0.5984721441039564
0.30 0.1411200080598672
0.35 -0.35078322768961984
0.75 0.9379999767747389

Ranging from 0.0 until 0.75, these discrete values drawn from our function with step size 0.05 will be the basis for training. Now, one could come up with the idea to just memorize all values, so a sufficiently reasonable value can be picked based on comparison. For instance, to continue at the point 0.75 in our plot, we could simply examine the area close to 0.15, noticing a similar value close to 1, and hence go downwards. Well, of course this is cheating, but if a good cheat is a superior solution, why not cheat? Being hackers, we wouldn’t care. What’s really limiting here is the fact that the whole data set needs to be kept in memory, which can be infeasible for large sets, plus for more complex shapes, this approach would quickly result in a lot of weird rules and exceptions to be made in order to find comprehensible predictions.

Net to the rescue

Let’s go back to our table and see if a neural net can learn the shape, instead of simply memorizing it. Here, we want our net architecture to be of kind [3, 5, 3, 1]. Three input neurons, two hidden layers with five and three neurons respectively, as well as one neuron for the output layer will capture the data shown in the table.

sinuspredictnet

A supervised training mode means, that we want to train our net with three discrete steps as input and the fourth step as the supervised training element. So we will train a, b, c -> d and e, f, g -> h et cetera, hoping that this way our net will capture the slope pattern of our sinusoidal wave. Let’s code this in Scala:

import neuroflow.core.Activator.Tanh 
import neuroflow.core.WeightProvider.randomWeights 
import neuroflow.nets.DynamicNetwork.constructor

First, we want a Tanh activation function, because the domain of our sinusoidal wave is [-1, 1], just like the hyperbolic tangent. This way we can be sure that we are not comparing apples with oranges. Further, we want a dynamic network (adaptive learning rate) and random initial weights. Let’s put this down:

val fn = Tanh.apply
val sets = Settings(true, 10.0, 0.0000001, 500, None, None, Some(Map("τ" -> 0.25, "c" -> 0.25)))
val net = Network(Input(3) :: Hidden(5, fn) :: Hidden(3, fn) :: Output(1, fn) :: Nil, sets)

No surprises here. After some experiments, we can pick values for the settings instance, which will promise good convergence during training. Now, let’s prepare our discrete steps drawn from the sinus function:

val group = 4
val sinusoidal = Range.Double(0.0, 0.8, 0.05).grouped(group).toList.map(i => i.map(k => (k, Math.sin(10 * k))))
val xsys = sinusoidal.map(s => (s.dropRight(1).map(_._2), s.takeRight(1).map(_._2)))
val xs = xsys.map(_._1)
val ys = xsys.map(_._2)
net.train(xs, ys)

We will draw samples from the range with step size 0.05. After this, we will construct our training values xs as well as our supervised output values ys. Here, a group consists of 4 steps, with 3 steps as input and the last step as the supervised value.

[INFO] [25.01.2016 14:07:51:677] [run-main-5] Taking step 499 - error: 1.4395661497489177E-4  , error per sample: 3.598915374372294E-5
[INFO] [25.01.2016 14:07:51:681] [run-main-5] Took 500 iterations of 500 with error 1.4304189739640242E-4  
[success] Total time: 4 s, completed 25.01.2016 14:20:56

After a pretty short time, we will see good news. Now, how can we check if our net can successfully predict the sinusoidal wave? We can’t simply call our net like a sinus function to map from one input value to one output value, e. g. something like net(0.75) == sin(0.75). Our net does not care about any x values, because it was trained purely based on the function values f(x), or the slope pattern in general. We need to feed our net with a three-dimensional input vector holding the first three, original function values to predict the fourth step, then drop the first original step and append the recently predicted step to predict the fifth step, et cetera. In other words, we need to traverse the net. Let’s code this:

val initial = Range.Double(0.0, 0.15, 0.05).zipWithIndex.map(p => (p._1, xs.head(p._2)))
val result = predict(net, xs.head, 0.15, initial)
result.foreach(r => println(s"${r._1}, ${r._2}"))

with

@tailrec def predict(net: Network, last: Seq[Double], i: Double, results: Seq[(Double, Double)]): Seq[(Double, Double)] = {
  if (i < 4.0) {
    val score = net.evaluate(last).head
    predict(net, last.drop(1) :+ score, i + 0.05, results :+ (i, score))
  } else results
}

So, basically we don’t just continue to draw the sinusoidal shape at the point 0.75, we draw the entire shape right from the start until 4.0 – solely based on our trained net! Now, let’s see how our Frankenstein will complete the sinusoidal shape from 0.75 on:

sinuspredictfintwo

I’d say, pretty neat? Keep in mind, here, the discrete predictions are connected through splines. Another interesting property of our trained net is its prediction compared to the original sinus function when taking the limit towards 4.0. Let’s plot both:

sinuspredictfin

The purple line is the original sinusoidal wave, whereas the green line is the prediction of our net. The first steps show great consistency, but slowly the curves diverge a little over time, as uncertainties will add up. To keep this divergence rather low, one could fine tune settings, for instance numeric precision. However, if one is taking the limit towards infinity, a perfect fit is illusory.

Final thoughts

That’s it! We have trained our net to learn and continue the sinusoidal shape. Now, I know that this is a rather academic example, but to train a neural net to learn more complex shapes is straightforward from here.

Thanks for reading!