Posts

How is automation changing data science and machine learning?

We have come a long way since the introduction of data science and machine learning. The recent study has found that the volume of business data doubles in less than 14 months. Today, the collection of data is no longer a problem, but the filtration, analysis, and maintenance of relevant information is a bigger issue.

We need to hire data science professionals, and they demand over $100k annually. Paying that sort of money for a professional is not feasible for every single organization, especially small and middle-sized companies. Google recently announced that it is going to make machine learning technology possible for every business.

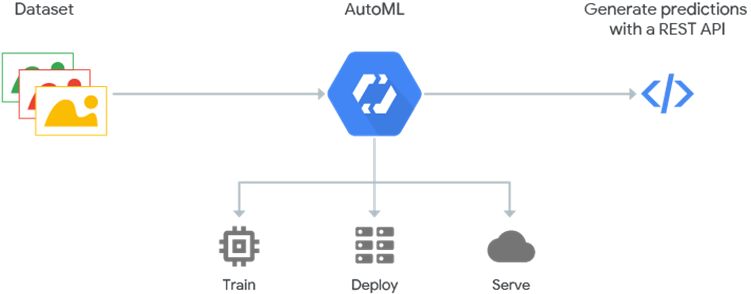
The access to machine learning technology is now possible, even for small businesses due to automation. Google, Microsoft, and other companies have come up with automated machine learning tools that enable small businesses to use machine learning technology to enhance their business performance and profit.

Image Source: Google Cloud

With that said, the world still needs a lot of machine learning professionals. Many machine learning professionals prefer Python for machine learning due to its features and a wide range of libraries.

According to the Gartner report, around 40% of data science tasks will be automated by 2020. The data science tools can automate some parts of data science processes, but it is not complete automation.

With that said, it has been helping a lot to accelerate the tasks. We still need data science professionals to deal with real-world problems. The algorithms are not yet able to handle messy data. The significant chunk of data science professionals often prefers performing with data science with Python for sophisticated tasks.

Automation in Data Science

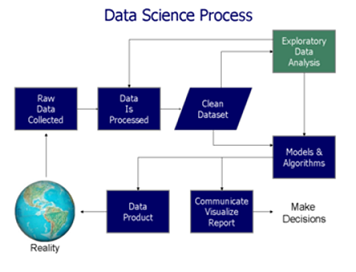
Let me show you the figure right at the beginning before moving forward.

Image Source: Wikipedia

If I had to use only one word to describe the entire data science process, I would use the word “headache.” According to the recent report, the median salary of data scientists easily surpasses $100k annually. The pay will be higher in the time to come.

One needs to pay a lot of money and invest a lot of time to get insights from the collected data. The data scientists need to spend almost 50-60% of their time in data processing and the rest of their time in modeling and deployment.

The cloud platforms like Amazon Web Services, Google, Microsoft Azure, and so on make the job more comfortable, but there is still a lot of work to maintain and extract useful insights from the collected data.

The data science process has lots of inefficiencies. At first, they need to spend over 50% of their total time on processing messy real-world data. After that, there could be a need to customize models, according to specific problems.

The significant contribution of automation is making a significant portion of data processing parts automated. Secondly, the automated platforms can make tracking of various models easier from multiple parameters. The time needed to launch the algorithm is minimal.

One example of an extensive tool to handle a data science project is Alteryx. IT has come up with powerful automated solutions that can drastically reduce the data processing and model development time for smoothening the entire data science workflow. The data science platform, Alteryx, is so amazing that its share price doubled in a span of little more than a year.

Some other great tools that can help you in data science automation are Rapidminer, H20.ai, KNIME, and so on. However, the lack of skilled data scientists can create a problem despite these tools. It is where the role of automated machine learning pops in.

How is Machine Learning Transformed with the entrance of Automation?

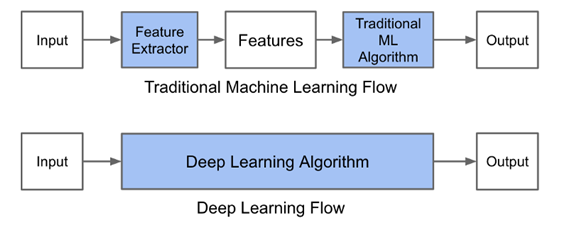
The traditional machine learning process was too complicated. One requires to have a lot of expensive machine learning professionals working for months to come up with models to process machine learning tasks.

Image Source: Medium

To make traditional machine learning work, one needs to gather data, standardize data, process features, create and train the machine learning model from problems, validate the models, and deploy the models at last.

You must have heard of how machine learning is only for corporations in the past. But, that has drastically changed in recent time, and it is all due to automation. Keep in mind that the above machine learning model is a simple one. There is a lot of extra works for complicated models. Even for the simple ones, you need to spend a lot of time and money, which makes it impossible for small and medium companies.

The automation in machine learning is all about automating the entire process to make machine learning easier. The only thing you need to do is feed data to the system (not a massive volume of data). You do not need even to cross the three-figure number of images to continue with automated machine learning platforms.

Microsoft has its automl platform along with Google. Other automl platforms can do the trick for you. Using those platforms do not cost you an arm and a leg. If you check out the price, you will be surprised.

There is no need for you to create or deploy models or even test the models. The algorithm will do the job for you. It takes examples and models of historical models to process the data and use a machine learning algorithm.

Even non-statistician can implement machine learning technology with limited data, thanks to automation in machine learning. You can make use of predictive analytics and can get easy solutions for simple prediction problems without scratching your head. Numerous libraries can assist you in the automated generation of machine learning pipelines.

How are the jobs of data scientists simplified by the introduction of automation in machine learning and data science?

It is true that the introduction of automation has drastically reduced the time for completing the tasks for data scientists. They no longer have to spend their valuable time in time-consuming, monotonous works that are necessary but do not provide a lot of value.

However, the need for skilled data scientists still exist, and it will always be there in the time to come. There are challenging works for data scientists that we cannot replace with machines, such as listening to clients, figuring out the root cause of business issues, development and selection of the right solution for the specific business problem.

Just like in other types of jobs, the advancement of automation technologies will modify the tasks that data scientists need to perform. They will be able to allocate more time on things that matter rather than monotonous tasks.

Final Verdict

The automation of machine learning and data science are in the beginning stage. However, they are already making a massive impact on the business world. The huge corporations are investing in Big Data and Machine Learning technologies. We can expect a considerable improvement in these technologies shortly.

Sooner, the competitive advantage of a business will depend on how well they can use the technologies, instead of access to machine learning or Big Data technologies.  I hope this article was valuable to you. If you want to add something or express your thoughts, feel free to leave a comment. I will gladly read and reply to your comment.

A common trap when it comes to sampling from a population that intrinsically includes outliers

I will discuss a common fallacy concerning the conclusions drawn from calculating a sample mean and a sample standard deviation and more importantly how to avoid it.

Suppose you draw a random sample x_1, x_2, … x_N of size N and compute the ordinary (arithmetic) sample mean  x_m and a sample standard deviation sd from it.  Now if (and only if) the (true) population mean µ (first moment) and population variance (second moment) obtained from the actual underlying PDF  are finite, the numbers x_m and sd make the usual sense otherwise they are misleading as will be shown by an example.

By the way: The common correlation coefficient will also be undefined (or in practice always point to zero) in the presence of infinite population variances. Hopefully I will create an article discussing this related fallacy in the near future where a suitable generalization to Lévy-stable variables will be proposed.

 Drawing a random sample from a heavy tailed distribution and discussing certain measures

As an example suppose you have a one dimensional random walker whose step length is distributed by a symmetric standard Cauchy distribution (Lorentz-profile) with heavy tails, i.e. an alpha-stable distribution with alpha being equal to one. The PDF of an individual independent step is given by p(x) = \frac{\pi^{-1}}{(1 + x^2)} , thus neither the first nor the second moment exist whereby the first exists and vanishes at least in the sense of a principal value due to symmetry.

Still let us generate N = 3000 (pseudo) standard Cauchy random numbers in R* to analyze the behavior of their sample mean and standard deviation sd as a function of the reduced sample size n \leq N.

*The R-code is shown at the end of the article.

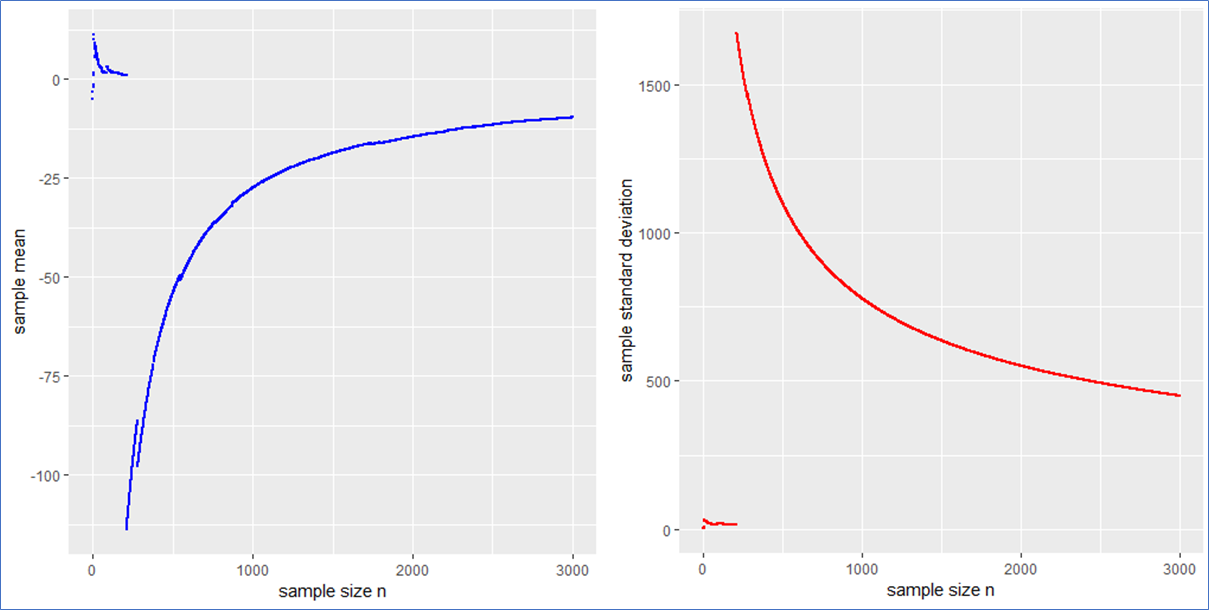
Here are the piecewise sample mean (in blue) and standard deviation (in red) for the mentioned Cauchy sampling. We see that both the sample mean and sd include jumps and do not converge.

Especially the mean deviates relatively largely from zero even after 3000 observations. The sample sd has no target due to the population variance being infinite.

If the data is new and no prior distribution is known, computing the sample mean and sd will be misleading. Astonishingly enough the sample mean itself will have the (formally exact) same distribution as the single step length p(x). This means that the sample mean is also standard Cauchy distributed implying that with a different Cauchy sample one could have easily observed different sample means far of the presented values in blue.

What sense does it make to present the usual interval x_m \pm sd / \sqrt{N} in such a case? What to do?

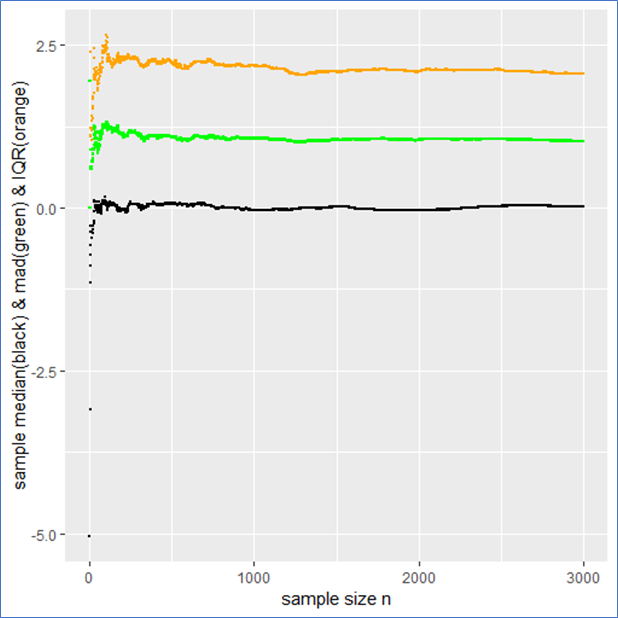
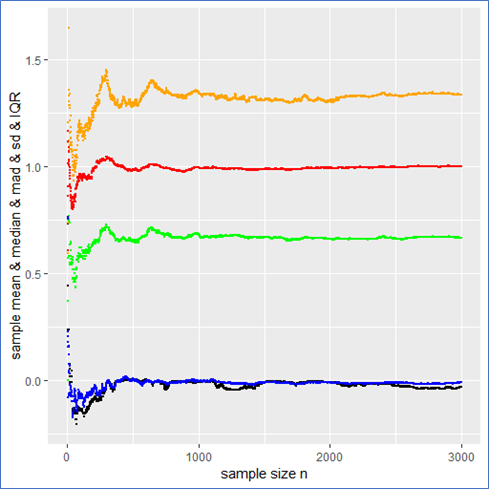
The sample median, median absolute difference (mad) and Inter-Quantile-Range (IQR) are more appropriate to describe such a data set including outliers intrinsically. To make this plausible I present the following plot, whereby the median is shown in black, the mad in green and the IQR in orange.

This example shows that the median, mad and IQR converge quickly against their assumed values and contain no major jumps. These quantities do an obviously better job in describing the sample. Even in the presence of outliers they remain robust, whereby the mad converges more quickly than the IQR. Note that a standard Cauchy sample will contain half of its sample in the interval median \pm mad meaning that the IQR is twice the mad.

Drawing a random sample from a PDF that has finite moments

Just for comparison I also show the above quantities for a standard normal (pseudo) sample labeled with the same color as before as a counter example. In this case not only do both the sample mean and median but also the sd and mad converge towards their expected values (see plot below). Here all the quantities describe the data set properly and there is no trap since there are no intrinsic outliers. The sample mean itself follows a standard normal, so that the sd in deed makes sense and one could calculate a standard error \frac{sd}{\sqrt{N}} from it to present the usual stochastic confidence intervals for the sample mean.

A careful observation shows that in contrast to the Cauchy case here the sampled mean and sd converge more quickly than the sample median and the IQR. However still the sampled mad performs about as well as the sd. Again the mad is twice the IQR.

And here are the graphs of the prementioned quantities for a pseudo normal sample:

The take-home-message:

Just be careful when you observe outliers and calculate sample quantities right away, you might miss something. At best one carefully observes how the relevant quantities change with sample size as demonstrated in this article.

Such curves should become of broader interest in order to improve transparency in the Data Science process and reduce fallacies as well.

Thank you for reading.

P.S.: Feel free to play with the set random seed in the R-code below and observe how other quantities behave with rising sample size. Of course you can also try different PDFs at the beginning of the code. You can employ a Cauchy, Gaussian, uniform, exponential or Holtsmark (pseudo) random sample.


QUIZ: Which one of the recently mentioned random samples contains a trap** and why?

**in the context of this article


R-code used to generate the data and for producing plots:


#R-script for emphasizing convergence and divergence of sample means

####install and load relevant packages ####

#uncomment these lines if necessary
#install.packages(c('ggplot2',’stabledist’))
#library(ggplot2)
#library(stabledist)

#####drawing random samples #####

#Setting a random seed for being able to reproduce results  
set.seed(1234567)   
N= 2000     #sample size

#Choose a PDF from which a sample shall be drawn
#To do so (un)comment the respective lines of following code

data <- rcauchy(N)    # option1(default): standard Cauchy sampling

#data <- rnorm(N)     #option2: standard Gaussian sampling
                               
#data <- rexp(N)    # option3: standard exponential sampling

#data <- rstable(N,alpha=1.5,beta=0)  # option4: standard symmetric Holtsmark sampling

#data <- runif(N)              #option5: standard uniform sample

#####descriptive statistics####
#preparations/declarations

SUM = vector()
sd =vector()
mean = vector()
SQ =vector()
SQUARES = vector()
median = vector()
mad =vector()
quantiles = data.frame()
sem =vector()

#piecewise calculaion of descrptive quantities

for (k in 1:length(data)){              #mainloop
SUM[k] <- sum(data[1:k])            # sum of sample
mean[k] <- mean(data[1:k])          # arithmetic mean
sd[k] <- sd(data[1:k])              # standard deviation
sem[k] <- sd[k]/(sqrt(k))          #standard error of the sample mean (for finite variances)
mad[k] <- mad(data[1:k],const=1)   # median absolute deviation    

for (j in 1:5){
qq <- quantile(data[1:k],na.rm = T)
quantiles[k,j] <- qq[j]         #quantiles of sample
}
colnames(quantiles) <- c('min','Q1','median','Q3','max')

for (i in 1:length(data[1:k])){
SQUARES[i] <- data[i]*data[i]    
}
SQ[k] <- sum(SQUARES[1:k])    #sum of squares of random sample
}  #end of mainloop

#create table containing all relevant data
TABLE <-  as.data.frame(cbind(quantiles,mean,sd,SQ,SUM,sem))


#####plotting results###
x11()
print(ggplot(TABLE,aes(1:N,median))+
geom_point(size=.5)+xlab('sample size n')+ylab('sample median'))
x11()
print(ggplot(TABLE,aes(1:N,mad))+geom_point(size=.5,color ='green')+
xlab('sample size n')+ylab('sample median absolute difference'))
x11()
print(ggplot(TABLE,aes(1:N,sd))+geom_point(size=.5,color ='red')+
xlab('sample size n')+ylab('sample standard deviation'))
x11()
print(ggplot(TABLE,aes(1:N,mean))+geom_point(size=.5, color ='blue')+
xlab('sample size n')+ylab('sample mean'))
x11()
print(ggplot(TABLE,aes(1:N,Q3-Q1))+geom_point(size=.5, color ='blue')+
xlab('sample size n')+ylab('IQR'))

#uncomment the following lines of code to see further plots

#x11()
#print(ggplot(TABLE,aes(1:N,sem))+geom_point(size=.5)+
#xlab('sample size n')+ylab('sample sum of r.v.'))
#x11()
#print(ggplot(TABLE,aes(1:N,SUM))+geom_point(size=.5)+
#xlab('sample size n')+ylab('sample sum of r.v.'))
#x11()
#print(ggplot(TABLE,aes(1:N,SQ))+geom_point(size=.5)+
#xlab('sample size n')+ylab('sample sum of squares'))


Business Intelligence Organizations

I am often asked how the Business Intelligence department should be set up and how it should interact and collaborate with other departments. First and foremost: There is no magic recipe here, but every company must find the right organization for itself.

Before we can talk about organization of BI, we need to have a clear definition of roles for team members within a BI department.

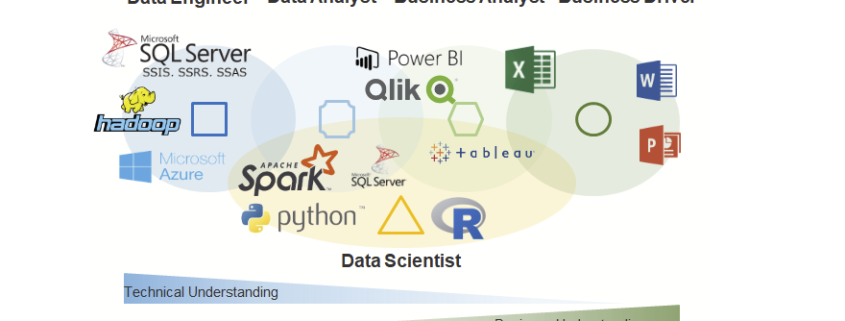
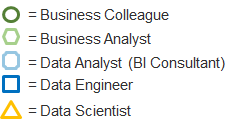
A Data Engineer (also Database Developer) uses databases to save structured, semi-structured and unstructured data. He or she is responsible for data cleaning, data availability, data models and also for the database performance. Furthermore, a good Data Engineer has at least basic knowledge about data security and data privacy. A Data Engineer uses SQL and NoSQL-Technologies.

A Data Analyst (also BI Analyst or BI Consultant) uses the data delivered by the Data Engineer to create or adjust data models and implementing business logic in those data models and BI dashboards. He or she needs to understand the needs of the business. This job requires good communication and consulting skills as well as good developing skills in SQL and BI Tools such like MS Power BI, Tableau or Qlik.

A Business Analyst (also Business Data Analyst) is a person form any business department who has basic knowledge in data analysis. He or she has good knowledge in MS Excel and at least basic knowledge in data analysis and BI Tools. A Business Analyst will not create data models in databases but uses existing data models to create dashboards or to adjust existing data analysis applications. Good Business Analyst have SQL Skills.

A Data Scientist is a Data Analyst with extended skills in statistics and machine learning. He or she can use very specific tools and analytical methods for finding pattern in unknow or big data (Data Mining) or to predict events based on pattern calculated by using historized data (Predictive Analytics). Data Scientists work mostly with Python or R programming.

Organization Type 1 – Central Approach (Data Lab)

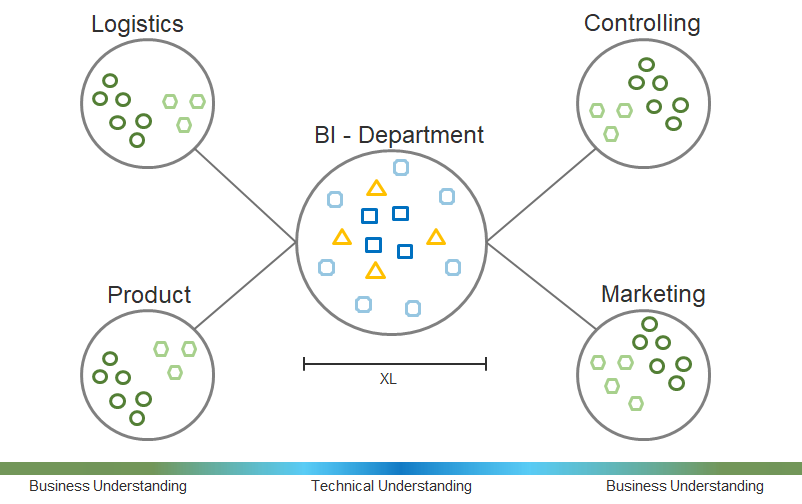
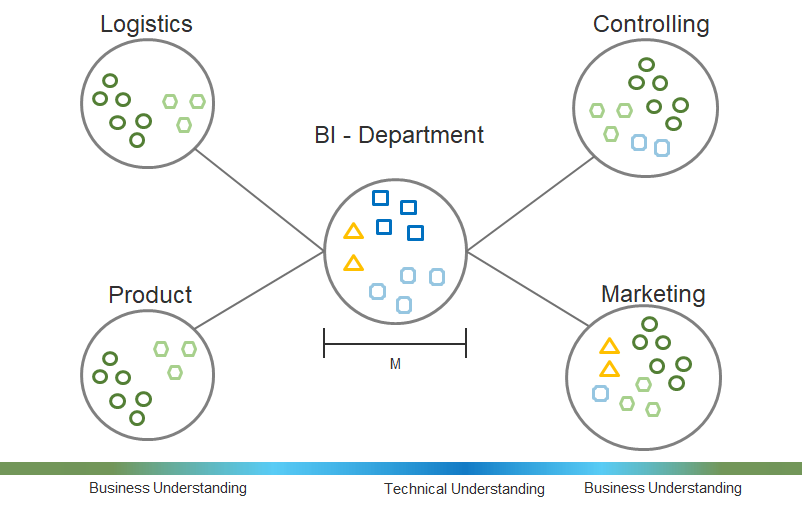
The first type of organization is the data lab approach. This organization form is easy to manage because it’s focused and therefore clear in terms of budgeting. The data delivery is done centrally by experts and their method and technology knowledge. Consequently, the quality expectation of data delivery and data analysis as well as the whole development process is highest here. Also the data governance is simple and the responsibilities clearly adjustable. Not to be underestimated is the aspect of recruiting, because new employees and qualified applicants like to join a central team of experts.

However, this form of organization requires that the company has the right working attitude, especially in the business intelligence department. A centralized business intelligence department acts as a shared service. Accordingly, customer-oriented thinking becomes a prerequisite for the company’s success – and customers here are the other departments that need access to the capacities of those centralized data experts. Communication boundaries must be overcome and ways of simple and effective communication must be found.

Organization Type 2 – Stakeholder Focus Approach

Other companies want to shift more responsibility for data governance, and especially data use and analytics, to those departments where data plays a key role right now. A central business intelligence department manages its own projects, which have a meaning for the entire company. The specialist departments, which have a special need for data analysis, have their own data experts who carry out critical projects for the specialist department. The central Business Intelligence department does not only provide the technical delivery of data, but also through methodical consulting. Although most of the responsibility lies with the Business Intelligence department, some other data-focused departments are at least co-responsible.

The advantage is obvious: There are special data experts who work deeper in the actual departments and feel more connected and responsible to them. The technical-business focus lies on pain points of the company.

However, this form of Ogranization also has decisive disadvantages: The danger of developing isolated solutions that are so special in some specific areas that they will not really work company-wide increases. Typically the company has to deal with asymmetrical growth of data analytics
know-how. Managing data governance is more complex and recruitment is becoming more difficult as the business intelligence department is weakened and smaller, and data professionals for other departments need to have more business focus, which means they are looking for more specialized profiles.

Organization Type 3 – Decentral Approach

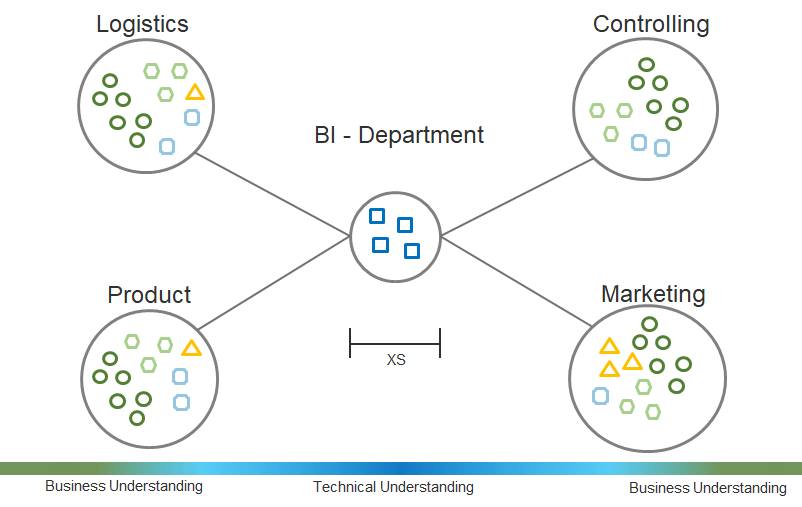
Some companies are also taking a more extreme approach in the other direction. The Business Intelligence department now has only Data Engineers building and maintaining the data warehouse or data lake. As a result, the central department only provides data; it is used and analyzed in all other departments, specifically for the respective applications.

The advantage lies in the personal responsibility of the respective departments as „pain points“ of the company are in focus in belief that business departments know their problems and solutions better than any other department does. Highly specialized data experts can understand colleagues of their own department well and there is no no shared service mindset neccessary, except for the data delivery.

Of course, this organizational form has clear disadvantages since many isolated solutions are unavoidable and the development process of each data-driven solution will be inefficient. These insular solutions may work with luck for your own department, but not for the whole company. There is no one single source of truth. The recruiting process is more difficult as it requires more specialized data experts with more business background. We have to expect an asymmetrical growth of data analytics know-how and a difficult data governance.


Predictive maintenance in Semiconductor Industry: Part 1

The process in the semiconductor industry is highly complicated and is normally under consistent observation via the monitoring of the signals coming from several sensors. Thus, it is important for the organization to detect the fault in the sensor as quickly as possible. There are existing traditional statistical based techniques however modern semiconductor industries have the ability to produce more data which is beyond the capability of the traditional process.

For this article, we will be using SECOM dataset which is available here.  A lot of work has already done on this dataset by different authors and there are also some articles available online. In this article, we will focus on problem definition, data understanding, and data cleaning.

This article is only the first of three parts, in this article we will discuss the business problem in hand and clean the dataset. In second part we will do feature engineering and in the last article we will build some models and evaluate them.

Problem definition

This data which is collected by these sensors not only contains relevant information but also a lot of noise. The dataset contains readings from 590. Among the 1567 examples, there are only 104 fail cases which means that out target variable is imbalanced. We will look at the distribution of the dataset when we look at the python code.

NOTE: For a detailed description regarding this cases study I highly recommend to read the following research papers:

  •  Kerdprasop, K., & Kerdprasop, N. A Data Mining Approach to Automate Fault Detection Model Development in the Semiconductor Manufacturing Process.
  • Munirathinam, S., & Ramadoss, B. Predictive Models for Equipment Fault Detection in the Semiconductor Manufacturing Process.

Data Understanding and Preparation

Let’s start exploring the dataset now. The first step as always is to import the required libraries.

import pandas as pd
import numpy as np

There are several ways to import the dataset, you can always download and then import from your working directory. However, I will directly import using the link. There are two datasets: one contains the readings from the sensors and the other one contains our target variable and a timestamp.

# Load dataset
url = "https://archive.ics.uci.edu/ml/machine-learning-databases/secom/secom.data"
names = ["feature" + str(x) for x in range(1, 591)]
secom_var = pd.read_csv(url, sep=" ", names=names, na_values = "NaN") 


url_l = "https://archive.ics.uci.edu/ml/machine-learning-databases/secom/secom_labels.data"
secom_labels = pd.read_csv(url_l,sep=" ",names = ["classification","date"],parse_dates = ["date"],na_values = "NaN")

The first step before doing the analysis would be to merge the dataset and we will us pandas library to merge the datasets in just one line of code.

#Data cleaning
#1. Combined the two datasets
secom_merged = pd.merge(secom_var, secom_labels,left_index=True,right_index=True)

Now let’s check out the distribution of the target variable

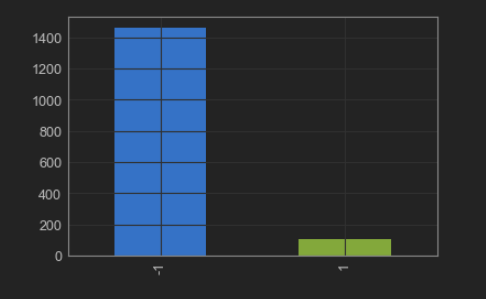
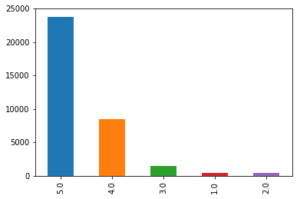
secom_merged.target.value_counts().plot(kind = 'bar')

Figure 1: Distribution of Target Variable

From Figure 1 it can be observed that the target variable is imbalanced and it is highly recommended to deal with this problem before the model building phase to avoid bias model. Xgboost is one of the models which can deal with imbalance classes but one needs to spend a lot of time to tune the hyper-parameters to achieve the best from the model.

The dataset in hand contains a lot of null values and the next step would be to analyse these null values and remove the columns having null values more than a certain percentage. This percentage is calculated based on 95th quantile of null values.

#2. Analyzing nulls
secom_rmNa.isnull().sum().sum()
secom_nulls = secom_rmNa.isnull().sum()/len(secom_rmNa)
secom_nulls.describe()
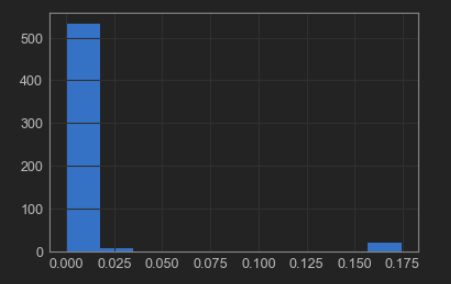
secom_nulls.hist()

Figure 2: Missing percentge in each column

Now we calculate the 95th percentile of the null values.

x = secom_nulls.quantile(0.95)
secom_rmNa = secom_merged[secom_merged.columns[secom_nulls < x]]

Figure 3: Missing percentage after removing columns with more then 45% Na

From figure 3 its visible that there are still missing values in the dataset and can be dealt by using many imputation methods. The most common method is to impute these values by mean, median or mode. There also exist few sophisticated techniques like K-nearest neighbour and interpolation.  We will be applying interpolation technique to our dataset. 

secom_complete = secom_rmNa.interpolate()

To prepare our dataset for analysis we should remove some more unwanted columns like columns with near zero variance. For this we can calulate number of unique values in each column and if there is only one unique value we can delete the column as it holds no information.

df = secom_complete.loc[:,secom_complete.apply(pd.Series.nunique) != 1]

## Let's check the shape of the df
df.shape
(1567, 444)

We have applied few data cleaning techniques and reduced the features from 590 to 444. However, In the next article we will apply some feature engineering techniques and adress problems like the curse of dimensionality and will also try to balance the target variable.

Bleiben Sie dran!!

The Inside Out of ML Based Prescriptive Analytics

With the constantly growing number of data, more and more companies are shifting towards analytic solutions. Analytic solutions help in extracting the meaning from the huge amount of data available. Thus, improving decision making.

Decision making is an important aspect of businesses, and technologies like Machine Learning are enhancing it further. The growing use of Machine Learning has changed the way of prescriptive analytics. In order to optimize the efforts, companies need to be more accurate with the historical and present data. This is because the historical and present data are the essentials of analytics. This article helps describe the inside out of Machine Learning-based prescriptive analytics.

Phases of business analytics

Descriptive analytics, predictive analytics, and prescriptive analytics are the three phases of business analytics. Descriptive analytics, being the first one, deals with past performance. Historical data is mined to understand past performance. This serves as a way to look for the reasons behind past success and failure. It is a kind of post-mortem analysis and most management reporting like sales, marketing, operations, and finance etc. make use of this.

The second one is a predictive analysis which answers the question of what is likely to happen. The historical data is now combined with rules, algorithms etc. to determine the possible future outcome or likelihood of a situation occurring.

The final phase, well known to everyone, is prescriptive analytics. It can continually take in new data and re-predict and re-prescribe. This improves the accuracy of the prediction and prescribes better decision options.  Professional services or technology or their combination can be chosen to perform all the three analytics.

More about prescriptive analytics

The analysis of business activities goes through many phases. Prescriptive analytics is one such. It is known to be the third phase of business analytics and comes after descriptive and predictive analytics. It entails the application of mathematical and computational sciences. It makes use of the results obtained from descriptive and predictive analysis to suggest decision options. It goes beyond predicting future outcomes and suggests actions to benefit from the predictions. It shows the implications of each decision option. It anticipates on what will happen when it will happen as well as why it will happen.

ML-based prescriptive analytics

Being just before the prescriptive analytics, predictive analytics is often confused with it. What actually happens is predictive analysis leads to prescriptive analysis. Thus, a Machine Learning based prescriptive analytics goes through an ML-based predictive analysis first. Therefore, it becomes necessary to consider the ML-based predictive analysis first.

ML-based predictive analytics:

A lot of things prevent businesses from achieving predictive analysis capabilities.  Machine Learning can be a great help in boosting Predictive analytics. Use of Machine Learning and Artificial Intelligence algorithms helps businesses in optimizing and uncovering the new statistical patterns. These statistical patterns form the backbone of predictive analysis. E-commerce, marketing, customer service, medical diagnosis etc. are some of the prospective use cases for Machine Learning based predictive analytics.

In E-commerce, machine learning can help in predicting the usual choices of the customer. Thus, presenting him/her according to his/her likes and dislikes. It can also help in predicting fraudulent transaction. Similarly, B2B marketing also makes good use of Machine learning based predictive analytics. Customer services and medical diagnosis also benefit from predictive analytics. Thus, a prediction and a prescription based on machine learning can boost various business functions.

Organizations and software development companies are making more and more use of machine learning based predictive analytics. The advancements like neural networks and deep learning algorithms are able to uncover hidden information. This all requires a well-researched approach. Big data and progressive IT systems also act as important factors in this.

Language Detecting with sklearn by determining Letter Frequencies

Of course, there are better and more efficient methods to detect the language of a given text than counting its lettes. On the other hand this is a interesting little example to show the impressing ability of todays machine learning algorithms to detect hidden patterns in a given set of data.

For example take the sentence:

“Ceci est une phrase française.”

It’s not to hard to figure out that this sentence is french. But the (lowercase) letters of the same sentence in a random order look like this:

“eeasrsçneticuaicfhenrpaes”

Still sure it’s french? Regarding the fact that this string contains the letter “ç” some people could have remembered long passed french lessons back in school and though might have guessed right. But beside the fact that the french letter “ç” is also present for example in portuguese, turkish, catalan and a few other languages, this is still a easy example just to explain the problem. Just try to guess which language might have generated this:

“ogldviisnntmeyoiiesettpetorotrcitglloeleiengehorntsnraviedeenltseaecithooheinsnstiofwtoienaoaeefiitaeeauobmeeetdmsflteightnttxipecnlgtetgteyhatncdisaceahrfomseehmsindrlttdthoaranthahdgasaebeaturoehtrnnanftxndaeeiposttmnhgttagtsheitistrrcudf”

While this looks simply confusing to the human eye and it seems practically impossible to determine the language it was generated from, this string still contains as set of hidden but well defined patterns from which the language could be predictet with almost complete (ca. 98-99%) certainty.

First of all, we need a set of texts in the languages our model should be able to recognise. Luckily with the package NLTK there comes a big set of example texts which actually are protocolls of the european parliament and therefor are publicly availible in 11 differen languages:

  •  Danish
  •  Dutch
  •  English
  •  Finnish
  •  French
  •  German
  •  Greek
  •  Italian
  •  Portuguese
  •  Spanish
  •  Swedish

Because the greek version is not written with the latin alphabet, the detection of the language greek would just be too simple, so we stay with the other 10 languages availible. To give you a idea of the used texts, here is a little sample:

“Resumption of the session I declare resumed the session of the European Parliament adjourned on Friday 17 December 1999, and I would like once again to wish you a happy new year in the hope that you enjoyed a pleasant festive period.
Although, as you will have seen, the dreaded ‘millennium bug’ failed to materialise, still the people in a number of countries suffered a series of natural disasters that truly were dreadful.”

Train and Test

The following code imports the nessesary modules and reads the sample texts from a set of text files into a pandas.Dataframe object and prints some statistics about the read texts:

from pathlib import Path
import random
from collections import Counter, defaultdict
import numpy as np
import pandas as pd
from sklearn.neighbors import *
from matplotlib import pyplot as plt
from mpl_toolkits import mplot3d
%matplotlib inline


def read(file):
    '''Returns contents of a file'''
    with open(file, 'r', errors='ignore') as f:
        text = f.read()
    return text

def load_eu_texts():
    '''Read texts snipplets in 10 different languages into pd.Dataframe

    load_eu_texts() -> pd.Dataframe
    
    The text snipplets are taken from the nltk-data corpus.
    '''
    basepath = Path('/home/my_username/nltk_data/corpora/europarl_raw/langs/')
    df = pd.DataFrame(columns=['text', 'lang', 'len'])
    languages = [None]
    for lang in basepath.iterdir():
        languages.append(lang.as_posix())
        t = '\n'.join([read(p) for p in lang.glob('*')])
        d = pd.DataFrame()
        d['text'] = ''
        d['text'] = pd.Series(t.split('\n'))
        d['lang'] = lang.name.title()
        df = df.append(d.copy(), ignore_index=True)
    return df

def clean_eutextdf(df):
    '''Preprocesses the texts by doing a set of cleaning steps
    
    clean_eutextdf(df) -> cleaned_df
    '''
    # Cuts of whitespaces a the beginning and and
    df['text'] = [i.strip() for i in df['text']]
    # Generate a lowercase Version of the text column
    df['ltext'] = [i.lower() for i in df['text']]

    # Determining the length of each text
    df['len'] = [len(i) for i in df['text']]
    # Drops all texts that are not at least 200 chars long
    df = df.loc[df['len'] > 200]
    return df

# Execute the above functions to load the texts
df = clean_eutextdf(load_eu_texts())

# Print a few stats of the read texts
textline = 'Number of text snippplets: ' + str(df.shape[0])
print('\n' + textline + '\n' + ''.join(['_' for i in range(len(textline))]))
c = Counter(df['lang'])
for l in c.most_common():
    print('%-25s' % l[0] + str(l[1]))
df.sample(10)
Number of text snippplets: 56481
________________________________
French                   6466
German                   6401
Italian                  6383
Portuguese               6147
Spanish                  6016
Finnish                  5597
Swedish                  4940
Danish                   4914
Dutch                    4826
English                  4791
lang	len	text	ltext
135233	Finnish	346	Vastustan sitä , toisin kuin tämän parlamentin...	vastustan sitä , toisin kuin tämän parlamentin...
170400	Danish	243	Desuden ødelægger det centraliserede europæisk...	desuden ødelægger det centraliserede europæisk...
85466	Italian	220	In primo luogo , gli accordi di Sharm el-Sheik...	in primo luogo , gli accordi di sharm el-sheik...
15926	French	389	Pour ce qui est concrètement du barrage de Ili...	pour ce qui est concrètement du barrage de ili...
195321	English	204	Discretionary powers for national supervisory ...	discretionary powers for national supervisory ...
160557	Danish	304	Det er de spørgmål , som de lande , der udgør ...	det er de spørgmål , som de lande , der udgør ...
196310	English	355	What remains of the concept of what a company ...	what remains of the concept of what a company ...
110163	Portuguese	327	Actualmente , é do conhecimento dos senhores d...	actualmente , é do conhecimento dos senhores d...
151681	Danish	203	Dette er vigtigt for den tillid , som samfunde...	dette er vigtigt for den tillid , som samfunde...
200540	English	257	Therefore , according to proponents , such as ...	therefore , according to proponents , such as ...

Above you see a sample set of random rows of the created Dataframe. After removing very short text snipplets (less than 200 chars) we are left with 56481 snipplets. The function clean_eutextdf() then creates a lower case representation of the texts in the coloum ‘ltext’ to facilitate counting the chars in the next step.
The following code snipplet now extracs the features – in this case the relative frequency of each letter in every text snipplet – that are used for prediction:

def calc_charratios(df):
    '''Calculating ratio of any (alphabetical) char in any text of df for each lyric
    
    calc_charratios(df) -> list, pd.Dataframe
    '''
    CHARS = ''.join({c for c in ''.join(df['ltext']) if c.isalpha()})
    print('Counting Chars:')
    for c in CHARS:
        print(c, end=' ')
        df[c] = [r.count(c) for r in df['ltext']] / df['len']
    return list(CHARS), df

features, df = calc_charratios(df)

Now that we have calculated the features for every text snipplet in our dataset, we can split our data set in a train and test set:

def split_dataset(df, ratio=0.5):
    '''Split the dataset into a train and a test dataset
    
    split_dataset(featuredf, ratio) -> pd.Dataframe, pd.Dataframe
    '''
    df = df.sample(frac=1).reset_index(drop=True)
    traindf = df[:][:int(df.shape[0] * ratio)]
    testdf = df[:][int(df.shape[0] * ratio):]
    return traindf, testdf

featuredf = pd.DataFrame()
featuredf['lang'] = df['lang']
for feature in features:
    featuredf[feature] = df[feature]
traindf, testdf = split_dataset(featuredf, ratio=0.80)

x = np.array([np.array(row[1:]) for index, row in traindf.iterrows()])
y = np.array([l for l in traindf['lang']])
X = np.array([np.array(row[1:]) for index, row in testdf.iterrows()])
Y = np.array([l for l in testdf['lang']])

After doing that, we can train a k-nearest-neigbours classifier and test it to get the percentage of correctly predicted languages in the test data set. Because we do not know what value for k may be the best choice, we just run the training and testing with different values for k in a for loop:

def train_knn(x, y, k):
    '''Returns the trained k nearest neighbors classifier
    
    train_knn(x, y, k) -> sklearn.neighbors.KNeighborsClassifier
    '''
    clf = KNeighborsClassifier(k)
    clf.fit(x, y)
    return clf

def test_knn(clf, X, Y):
    '''Tests a given classifier with a testset and return result
    
    text_knn(clf, X, Y) -> float
    '''
    predictions = clf.predict(X)
    ratio_correct = len([i for i in range(len(Y)) if Y[i] == predictions[i]]) / len(Y)
    return ratio_correct

print('''k\tPercentage of correctly predicted language
__________________________________________________''')
for i in range(1, 16):
    clf = train_knn(x, y, i)
    ratio_correct = test_knn(clf, X, Y)
    print(str(i) + '\t' + str(round(ratio_correct * 100, 3)) + '%')
k	Percentage of correctly predicted language
__________________________________________________
1	97.548%
2	97.38%
3	98.256%
4	98.132%
5	98.221%
6	98.203%
7	98.327%
8	98.247%
9	98.371%
10	98.345%
11	98.327%
12	98.3%
13	98.256%
14	98.274%
15	98.309%

As you can see in the output the reliability of the language classifier is generally very high: It starts at about 97.5% for k = 1, increases for with increasing values of k until it reaches a maximum level of about 98.5% at k ≈ 10.

Using the Classifier to predict languages of texts

Now that we have trained and tested the classifier we want to use it to predict the language of example texts. To do that we need two more functions, shown in the following piece of code. The first one extracts the nessesary features from the sample text and predict_lang() predicts the language of a the texts:

def extract_features(text, features):
    '''Extracts all alphabetic characters and add their ratios as feature
    
    extract_features(text, features) -> np.array
    '''
    textlen = len(text)
    ratios = []
    text = text.lower()
    for feature in features:
        ratios.append(text.count(feature) / textlen)
    return np.array(ratios)

def predict_lang(text, clf=clf):
    '''Predicts the language of a given text and classifier
    
    predict_lang(text, clf) -> str
    '''
    extracted_features = extract_features(text, features)
    return clf.predict(np.array(np.array([extracted_features])))[0]

text_sample = df.sample(10)['text']

for example_text in text_sample:
    print('%-20s'  % predict_lang(example_text, clf) + '\t' + example_text[:60] + '...')
Italian             	Auspico che i progetti riguardanti i programmi possano contr...
English             	When that time comes , when we have used up all our resource...
Portuguese          	Creio que o Parlamento protesta muitas vezes contra este mét...
Spanish             	Sobre la base de esta posición , me parece que se puede enco...
Dutch               	Ik voel mij daardoor aangemoedigd omdat ik een brede consens...
Spanish             	Señor Presidente , Señorías , antes que nada , quisiera pron...
Italian             	Ricordo altresì , signora Presidente , che durante la preced...
Swedish             	Betänkande ( A5-0107 / 1999 ) av Berend för utskottet för re...
English             	This responsibility cannot only be borne by the Commissioner...
Portuguese          	A nossa leitura comum é que esse partido tem uma posição man...

With this classifier it is now also possible to predict the language of the randomized example snipplet from the introduction (which is acutally created from the first paragraph of this article):

example_text = "ogldviisnntmeyoiiesettpetorotrcitglloeleiengehorntsnraviedeenltseaecithooheinsnstiofwtoienaoaeefiitaeeauobmeeetdmsflteightnttxipecnlgtetgteyhatncdisaceahrfomseehmsindrlttdthoaranthahdgasaebeaturoehtrnnanftxndaeeiposttmnhgttagtsheitistrrcudf"
predict_lang(example_text)
'English'

The KNN classifier of sklearn also offers the possibility to predict the propability with which a given classification is made. While the probability distribution for a specific language is relativly clear for long sample texts it decreases noticeably the shorter the texts are.

def dict_invert(dictionary):
    ''' Inverts keys and values of a dictionary
    
    dict_invert(dictionary) -> collections.defaultdict(list)
    '''
    inverse_dict = defaultdict(list)
    for key, value in dictionary.items():
        inverse_dict[value].append(key)
    return inverse_dict

def get_propabilities(text, features=features):
    '''Prints the probability for every language of a given text
    
    get_propabilities(text, features)
    '''
    results = clf.predict_proba(extract_features(text, features=features).reshape(1, -1))
    for result in zip(clf.classes_, results[0]):
        print('%-20s' % result[0] + '%7s %%' % str(round(float(100 * result[1]), 4)))


example_text = 'ogldviisnntmeyoiiesettpetorotrcitglloeleiengehorntsnraviedeenltseaecithooheinsnstiofwtoienaoaeefiitaeeauobmeeetdmsflteightnttxipecnlgtetgteyhatncdisaceahrfomseehmsindrlttdthoaranthahdgasaebeaturoehtrnnanftxndaeeiposttmnhgttagtsheitistrrcudf'
print(example_text)
get_propabilities(example_text + '\n')
print('\n')
example_text2 = 'Dies ist ein kurzer Beispielsatz.'
print(example_text2)
get_propabilities(example_text2 + '\n')
ogldviisnntmeyoiiesettpetorotrcitglloeleiengehorntsnraviedeenltseaecithooheinsnstiofwtoienaoaeefiitaeeauobmeeetdmsflteightnttxipecnlgtetgteyhatncdisaceahrfomseehmsindrlttdthoaranthahdgasaebeaturoehtrnnanftxndaeeiposttmnhgttagtsheitistrrcudf
Danish                  0.0 %
Dutch                   0.0 %
English               100.0 %
Finnish                 0.0 %
French                  0.0 %
German                  0.0 %
Italian                 0.0 %
Portuguese              0.0 %
Spanish                 0.0 %
Swedish                 0.0 %


Dies ist ein kurzer Beispielsatz.
Danish                  0.0 %
Dutch                   0.0 %
English                 0.0 %
Finnish                 0.0 %
French              18.1818 %
German              72.7273 %
Italian              9.0909 %
Portuguese              0.0 %
Spanish                 0.0 %
Swedish                 0.0 %

Background and Insights

Why does a relative simple model like counting letters acutally work? Every language has a specific pattern of letter frequencies which can be used as a kind of fingerprint: While there are almost no y‘s in the german language this letter is quite common in english. In french the letter k is not very common because it is replaced with q in most cases.

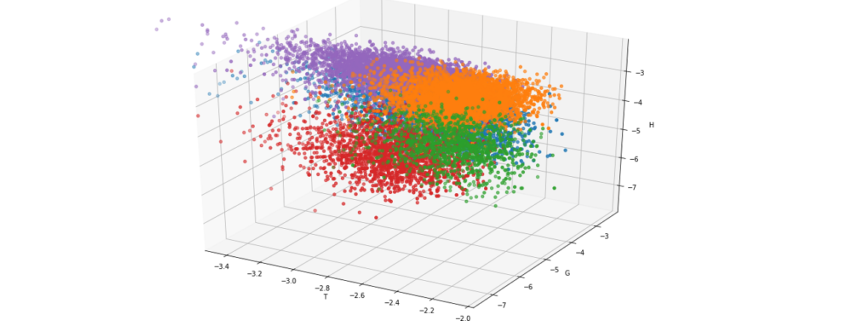
For a better understanding look at the output of the following code snipplet where only three letters already lead to a noticable form of clustering:

projection='3d')
legend = []
X, Y, Z = 'e', 'g', 'h'

def iterlog(ln):
    retvals = []
    for n in ln:
        try:
            retvals.append(np.log(n))
        except:
            retvals.append(None)
    return retvals

for X in ['t']:
    ax = plt.axes(projection='3d')
    ax.xy_viewLim.intervalx = [-3.5, -2]
    legend = []
    for lang in [l for l in df.groupby('lang') if l[0] in {'German', 'English', 'Finnish', 'French', 'Danish'}]:
        sample = lang[1].sample(4000)

        legend.append(lang[0])
        ax.scatter3D(iterlog(sample[X]), iterlog(sample[Y]), iterlog(sample[Z]))

    ax.set_title('log(10) of the Relativ Frequencies of "' + X.upper() + "', '" + Y.upper() + '" and "' + Z.upper() + '"\n\n')
    ax.set_xlabel(X.upper())
    ax.set_ylabel(Y.upper())
    ax.set_zlabel(Z.upper())
    plt.legend(legend)
    plt.show()
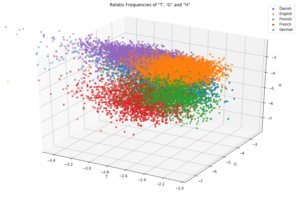
 

Even though every single letter frequency by itself is not a very reliable indicator, the set of frequencies of all present letters in a text is a quite good evidence because it will more or less represent the letter frequency fingerprint of the given language. Since it is quite hard to imagine or visualize the above plot in more than three dimensions, I used a little trick which shows that every language has its own typical fingerprint of letter frequencies:

legend = []
fig = plt.figure(figsize=(15, 10))
plt.axes(yscale='log')
    
langs = defaultdict(list)

for lang in [l for l in df.groupby('lang') if l[0] in set(df['lang'])]:
    for feature in 'abcdefghijklmnopqrstuvwxyz':
        langs[lang[0]].append(lang[1][feature].mean())

mean_frequencies = {feature:df[feature].mean() for feature in 'abcdefghijklmnopqrstuvwxyz'}
for i in langs.items():
    legend.append(i[0])
    j = np.array(i[1]) / np.array([mean_frequencies[c] for c in 'abcdefghijklmnopqrstuvwxyz'])
    plt.plot([c for c in 'abcdefghijklmnopqrstuvwxyz'], j)
plt.title('Log. of relative Frequencies compared to the mean Frequency in all texts')
plt.xlabel('Letters')
plt.ylabel('(log(Lang. Frequencies / Mean Frequency)')
plt.legend(legend)
plt.grid()
plt.show()
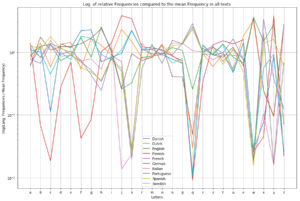
What more?

Beside the fact, that letter frequencies alone, allow us to predict the language of every example text (at least in the 10 languages with latin alphabet we trained for) with almost complete certancy there is even more information hidden in the set of sample texts.

As you might know, most languages in europe belong to either the romanian or the indogermanic language family (which is actually because the romans conquered only half of europe). The border between them could be located in belgium, between france and germany and in swiss. West of this border the romanian languages, which originate from latin, are still spoken, like spanish, portouguese and french. In the middle and northern part of europe the indogermanic languages are very common like german, dutch, swedish ect. If we plot the analysed languages with a different colour sheme this border gets quite clear and allows us to take a look back in history that tells us where our languages originate from:

legend = []
fig = plt.figure(figsize=(15, 10))
plt.axes(yscale='linear')
    
langs = defaultdict(list)
for lang in [l for l in df.groupby('lang') if l[0] in {'German', 'English', 'French', 'Spanish', 'Portuguese', 'Dutch', 'Swedish', 'Danish', 'Italian'}]:
    for feature in 'abcdefghijklmnopqrstuvwxyz':
        langs[lang[0]].append(lang[1][feature].mean())

colordict = {l[0]:l[1] for l in zip([lang for lang in langs], ['brown', 'tomato', 'orangered',
                                                               'green', 'red', 'forestgreen', 'limegreen',
                                                               'darkgreen', 'darkred'])}
mean_frequencies = {feature:df[feature].mean() for feature in 'abcdefghijklmnopqrstuvwxyz'}
for i in langs.items():
    legend.append(i[0])
    j = np.array(i[1]) / np.array([mean_frequencies[c] for c in 'abcdefghijklmnopqrstuvwxyz'])
    plt.plot([c for c in 'abcdefghijklmnopqrstuvwxyz'], j, color=colordict[i[0]])
#     plt.plot([c for c in 'abcdefghijklmnopqrstuvwxyz'], i[1], color=colordict[i[0]])
plt.title('Log. of relative Frequencies compared to the mean Frequency in all texts')
plt.xlabel('Letters')
plt.ylabel('(log(Lang. Frequencies / Mean Frequency)')
plt.legend(legend)
plt.grid()
plt.show()
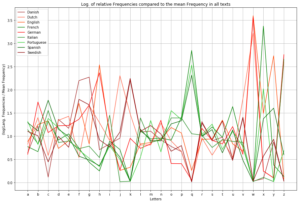
As you can see the more common letters, especially the vocals like a, e, i, o and u have almost the same frequency in all of this languages. Far more interesting are letters like q, k, c and w: While k is quite common in all of the indogermanic languages it is quite rare in romanic languages because the same sound is written with the letters q or c.
As a result it could be said, that even “boring” sets of data (just give it a try and read all the texts of the protocolls of the EU parliament…) could contain quite interesting patterns which – in this case – allows us to predict quite precisely which language a given text sample is written in, without the need of any translation program or to speak the languages. And as an interesting side effect, where certain things in history happend (or not happend): After two thousand years have passed, modern machine learning techniques could easily uncover this history because even though all these different languages developed, they still have a set of hidden but common patterns that since than stayed the same.
Sentiment Analysis using Python

One of the applications of text mining is sentiment analysis. Most of the data is getting generated in textual format and in the past few years, people are talking more about NLP. Improvement is a continuous process many product based companies leverage these text mining techniques to examine the sentiments of the customers to find about what they can improve in the product. This information also helps them to understand the trend and demand of the end user which results in Customer satisfaction.

As text mining is a vast concept, the article is divided into two subchapters. The main focus of this article will be calculating two scores: sentiment polarity and subjectivity using python. The range of polarity is from -1 to 1(negative to positive) and will tell us if the text contains positive or negative feedback. Most companies prefer to stop their analysis here but in our second article, we will try to extend our analysis by creating some labels out of these scores. Finally, a multi-label multi-class classifier can be trained to predict future reviews.

Without any delay let’s deep dive into the code and mine some knowledge from textual data.

There are a few NLP libraries existing in Python such as Spacy, NLTK, gensim, TextBlob, etc. For this particular article, we will be using NLTK for pre-processing and TextBlob to calculate sentiment polarity and subjectivity.

import pandas as pd
import matplotlib.pyplot as plt
%matplotlib inline  
import nltk
from nltk import word_tokenize, sent_tokenize
from nltk.corpus import stopwords
from nltk.stem import LancasterStemmer, WordNetLemmatizer, PorterStemmer
from wordcloud import WordCloud, STOPWORDS
from textblob import TextBlob

The dataset is available here for download and we will be using pandas read_csv function to import the dataset. I would like to share an additional information here which I came to know about recently. Those who have already used python and pandas before they probably know that read_csv is by far one of the most used function. However, it can take a while to upload a big file. Some folks from  RISELab at UC Berkeley created Modin or Pandas on Ray which is a library that speeds up this process by changing a single line of code.

amz_reviews = pd.read_csv("1429_1.csv")

After importing the dataset it is recommended to understand it first and study the structure of the dataset. At this point we are interested to know how many columns are there and what are these columns so I am going to check the shape of the data frame and go through each column name to see if we need them or not.

amz_reviews.shape
(34660, 21)

amz_reviews.columns
Index(['id', 'name', 'asins', 'brand', 'categories', 'keys', 'manufacturer',
       'reviews.date', 'reviews.dateAdded', 'reviews.dateSeen',
       'reviews.didPurchase', 'reviews.doRecommend', 'reviews.id',
       'reviews.numHelpful', 'reviews.rating', 'reviews.sourceURLs',
       'reviews.text', 'reviews.title', 'reviews.userCity',
       'reviews.userProvince', 'reviews.username'],
      dtype='object')


There are so many columns which are not useful for our sentiment analysis and it’s better to remove these columns. There are many ways to do that: either just select the columns which you want to keep or select the columns you want to remove and then use the drop function to remove it from the data frame. I prefer the second option as it allows me to look at each column one more time so I don’t miss any important variable for the analysis.

columns = ['id','name','keys','manufacturer','reviews.dateAdded', 'reviews.date','reviews.didPurchase',
          'reviews.userCity', 'reviews.userProvince', 'reviews.dateSeen', 'reviews.doRecommend','asins',
          'reviews.id', 'reviews.numHelpful', 'reviews.sourceURLs', 'reviews.title']

df = pd.DataFrame(amz_reviews.drop(columns,axis=1,inplace=False))

Now let’s dive deep into the data and try to mine some knowledge from the remaining columns. The first step we would want to follow here is just to look at the distribution of the variables and try to make some notes. First, let’s look at the distribution of the ratings.

df['reviews.rating'].value_counts().plot(kind='bar')

Graphs are powerful and at this point, just by looking at the above bar graph we can conclude that most people are somehow satisfied with the products offered at Amazon. The reason I am saying ‘at’ Amazon is because it is just a platform where anyone can sell their products and the user are giving ratings to the product and not to Amazon. However, if the user is satisfied with the products it also means that Amazon has a lower return rate and lower fraud case (from seller side). The job of a Data Scientist relies not only on how good a model is but also on how useful it is for the business and that’s why these business insights are really important.

Data pre-processing for textual variables

Lowercasing

Before we move forward to calculate the sentiment scores for each review it is important to pre-process the textual data. Lowercasing helps in the process of normalization which is an important step to keep the words in a uniform manner (Welbers, et al., 2017, pp. 245-265).

## Change the reviews type to string
df['reviews.text'] = df['reviews.text'].astype(str)

## Before lowercasing 
df['reviews.text'][2]
'Inexpensive tablet for him to use and learn on, step up from the NABI. He was thrilled with it, learn how to Skype on it 
already...'

## Lowercase all reviews
df['reviews.text'] = df['reviews.text'].apply(lambda x: " ".join(x.lower() for x in x.split()))
df['reviews.text'][2] ## to see the difference
'inexpensive tablet for him to use and learn on, step up from the nabi. he was thrilled with it, learn how to skype on it 
already...'

Special characters

Special characters are non-alphabetic and non-numeric values such as {!,@#$%^ *()~;:/<>|+_-[]?}. Dealing with numbers is straightforward but special characters can be sometimes tricky. During tokenization, special characters create their own tokens and again not helpful for any algorithm, likewise, numbers.

## remove punctuation
df['reviews.text'] = df['reviews.text'].str.replace('[^ws]','')
df['reviews.text'][2]
'inexpensive tablet for him to use and learn on step up from the nabi he was thrilled with it learn how to skype on it already'

Stopwords

Stop-words being most commonly used in the English language; however, these words have no predictive power in reality. Words such as I, me, myself, he, she, they, our, mine, you, yours etc.

stop = stopwords.words('english')
df['reviews.text'] = df['reviews.text'].apply(lambda x: " ".join(x for x in x.split() if x not in stop))
df['reviews.text'][2]
'inexpensive tablet use learn step nabi thrilled learn skype already'

Stemming

Stemming algorithm is very useful in the field of text mining and helps to gain relevant information as it reduces all words with the same roots to a common form by removing suffixes such as -action, ing, -es and -ses. However, there can be problematic where there are spelling errors.

st = PorterStemmer()
df['reviews.text'] = df['reviews.text'].apply(lambda x: " ".join([st.stem(word) for word in x.split()]))
df['reviews.text'][2]
'inexpens tablet use learn step nabi thrill learn skype alreadi'

This step is extremely useful for pre-processing textual data but it also depends on your goal. Here our goal is to calculate sentiment scores and if you look closely to the above code words like ‘inexpensive’ and ‘thrilled’ became ‘inexpens’ and ‘thrill’ after applying this technique. This will help us in text classification to deal with the curse of dimensionality but to calculate the sentiment score this process is not useful.

Sentiment Score

It is now time to calculate sentiment scores of each review and check how these scores look like.

## Define a function which can be applied to calculate the score for the whole dataset

def senti(x):
    return TextBlob(x).sentiment  

df['senti_score'] = df['reviews.text'].apply(senti)

df.senti_score.head()

0                                   (0.3, 0.8)
1                                (0.65, 0.675)
2                                   (0.0, 0.0)
3    (0.29545454545454547, 0.6492424242424243)
4                    (0.5, 0.5827777777777777)
Name: senti_score, dtype: object

As it can be observed there are two scores: the first score is sentiment polarity which tells if the sentiment is positive or negative and the second score is subjectivity score to tell how subjective is the text.

In my next article, we will extend this analysis by creating labels based on these scores and finally we will train a classification model.

Sentiment Analysis using Python

One of the applications of text mining is sentiment analysis. Most of the data is getting generated in textual format and in the past few years, people are talking more about NLP. Improvement is a continuous process and many product based companies leverage these text mining techniques to examine the sentiments of the customers to find about what they can improve in the product. This information also helps them to understand the trend and demand of the end user which results in Customer satisfaction.

As text mining is a vast concept, the article is divided into two subchapters. The main focus of this article will be calculating two scores: sentiment polarity and subjectivity using python. The range of polarity is from -1 to 1(negative to positive) and will tell us if the text contains positive or negative feedback. Most companies prefer to stop their analysis here but in our second article, we will try to extend our analysis by creating some labels out of these scores. Finally, a multi-label multi-class classifier can be trained to predict future reviews.

Without any delay let’s deep dive into the code and mine some knowledge from textual data.

There are a few NLP libraries existing in Python such as Spacy, NLTK, gensim, TextBlob, etc. For this particular article, we will be using NLTK for pre-processing and TextBlob to calculate sentiment polarity and subjectivity.

import pandas as pd
import matplotlib.pyplot as plt
%matplotlib inline  
import nltk
from nltk import word_tokenize, sent_tokenize
from nltk.corpus import stopwords
from nltk.stem import LancasterStemmer, WordNetLemmatizer, PorterStemmer
from wordcloud import WordCloud, STOPWORDS
from textblob import TextBlob

The dataset is available here for download and we will be using pandas read_csv function to import the dataset. I would like to share an additional information here which I came to know about recently. Those who have already used python and pandas before they probably know that read_csv is by far one of the most used function. However, it can take a while to upload a big file. Some folks from  RISELab at UC Berkeley created Modin or Pandas on Ray which is a library that speeds up this process by changing a single line of code.

amz_reviews = pd.read_csv("1429_1.csv")

After importing the dataset it is recommended to understand it first and study the structure of the dataset. At this point we are interested to know how many columns are there and what are these columns so I am going to check the shape of the data frame and go through each column name to see if we need them or not.

amz_reviews.shape
(34660, 21)

amz_reviews.columns
Index(['id', 'name', 'asins', 'brand', 'categories', 'keys', 'manufacturer',
       'reviews.date', 'reviews.dateAdded', 'reviews.dateSeen',
       'reviews.didPurchase', 'reviews.doRecommend', 'reviews.id',
       'reviews.numHelpful', 'reviews.rating', 'reviews.sourceURLs',
       'reviews.text', 'reviews.title', 'reviews.userCity',
       'reviews.userProvince', 'reviews.username'],
      dtype='object')


There are so many columns which are not useful for our sentiment analysis and it’s better to remove these columns. There are many ways to do that: either just select the columns which you want to keep or select the columns you want to remove and then use the drop function to remove it from the data frame. I prefer the second option as it allows me to look at each column one more time so I don’t miss any important variable for the analysis.

columns = ['id','name','keys','manufacturer','reviews.dateAdded', 'reviews.date','reviews.didPurchase',
          'reviews.userCity', 'reviews.userProvince', 'reviews.dateSeen', 'reviews.doRecommend','asins',
          'reviews.id', 'reviews.numHelpful', 'reviews.sourceURLs', 'reviews.title']

df = pd.DataFrame(amz_reviews.drop(columns,axis=1,inplace=False))

Now let’s dive deep into the data and try to mine some knowledge from the remaining columns. The first step we would want to follow here is just to look at the distribution of the variables and try to make some notes. First, let’s look at the distribution of the ratings.

df['reviews.rating'].value_counts().plot(kind='bar')

Graphs are powerful and at this point, just by looking at the above bar graph we can conclude that most people are somehow satisfied with the products offered at Amazon. The reason I am saying ‘at’ Amazon is because it is just a platform where anyone can sell their products and the user are giving ratings to the product and not to Amazon. However, if the user is satisfied with the products it also means that Amazon has a lower return rate and lower fraud case (from seller side). The job of a Data Scientist relies not only on how good a model is but also on how useful it is for the business and that’s why these business insights are really important.

Data pre-processing for textual variables

Lowercasing

Before we move forward to calculate the sentiment scores for each review it is important to pre-process the textual data. Lowercasing helps in the process of normalization which is an important step to keep the words in a uniform manner (Welbers, et al., 2017, pp. 245-265).

## Change the reviews type to string
df['reviews.text'] = df['reviews.text'].astype(str)

## Before lowercasing 
df['reviews.text'][2]
'Inexpensive tablet for him to use and learn on, step up from the NABI. He was thrilled with it, learn how to Skype on it 
already...'

## Lowercase all reviews
df['reviews.text'] = df['reviews.text'].apply(lambda x: " ".join(x.lower() for x in x.split()))
df['reviews.text'][2] ## to see the difference
'inexpensive tablet for him to use and learn on, step up from the nabi. he was thrilled with it, learn how to skype on it 
already...'

Special characters

Special characters are non-alphabetic and non-numeric values such as {!,@#$%^ *()~;:/<>|+_-[]?}. Dealing with numbers is straightforward but special characters can be sometimes tricky. During tokenization, special characters create their own tokens and again not helpful for any algorithm, likewise, numbers.

## remove punctuation
df['reviews.text'] = df['reviews.text'].str.replace('[^ws]','')
df['reviews.text'][2]
'inexpensive tablet for him to use and learn on step up from the nabi he was thrilled with it learn how to skype on it already'

Stopwords

Stop-words being most commonly used in the English language; however, these words have no predictive power in reality. Words such as I, me, myself, he, she, they, our, mine, you, yours etc.

stop = stopwords.words('english')
df['reviews.text'] = df['reviews.text'].apply(lambda x: " ".join(x for x in x.split() if x not in stop))
df['reviews.text'][2]
'inexpensive tablet use learn step nabi thrilled learn skype already'

Stemming

Stemming algorithm is very useful in the field of text mining and helps to gain relevant information as it reduces all words with the same roots to a common form by removing suffixes such as -action, ing, -es and -ses. However, there can be problematic where there are spelling errors.

st = PorterStemmer()
df['reviews.text'] = df['reviews.text'].apply(lambda x: " ".join([st.stem(word) for word in x.split()]))
df['reviews.text'][2]
'inexpens tablet use learn step nabi thrill learn skype alreadi'

This step is extremely useful for pre-processing textual data but it also depends on your goal. Here our goal is to calculate sentiment scores and if you look closely to the above code words like ‘inexpensive’ and ‘thrilled’ became ‘inexpens’ and ‘thrill’ after applying this technique. This will help us in text classification to deal with the curse of dimensionality but to calculate the sentiment score this process is not useful.

Sentiment Score

It is now time to calculate sentiment scores of each review and check how these scores look like.

## Define a function which can be applied to calculate the score for the whole dataset

def senti(x):
    return TextBlob(x).sentiment  

df['senti_score'] = df['reviews.text'].apply(senti)

df.senti_score.head()

0                                   (0.3, 0.8)
1                                (0.65, 0.675)
2                                   (0.0, 0.0)
3    (0.29545454545454547, 0.6492424242424243)
4                    (0.5, 0.5827777777777777)
Name: senti_score, dtype: object

As it can be observed there are two scores: the first score is sentiment polarity which tells if the sentiment is positive or negative and the second score is subjectivity score to tell how subjective is the text. The whole code is available here.

In my next article, we will extend this analysis by creating labels based on these scores and finally we will train a classification model.

Deep Learning and Human Intelligence – Part 1 of 2

Many people are under the impression that the new wave of data science, machine learning and/or digitalization is new, that it did not exist before. But its history is as long as the history of humanity and/or science itself.  The scientific discovery could hardly take place without the necessary data. Even the process of discovering the numbers included elements of machine learning: pattern recognition, comparison between different groups (ranking), clustering, etc. So what differentiates mathematical formulas from machine learning and how does it relate to artificial intelligence?

There is no difference between the two if seen from the perspective of formulas however, such a perspective limits the type of data to which they can be applied. Data stored via tables consist of structured data and are stored in so-called relational databases. The reason for such a data storage is the connection between different fields that assume a well-established structure in advance, such as a company’s sales or balance sheet. However, with the emergence of personal computers, many of the daily activities have been digitalized: music, pictures, movies, and so on. All this information is stored unrelated to other data and therefore called unstructured data.

IEEE International Conference on Computer Vision (ICCV), 2015, DOI: 10.1109/ICCV.2015.428

Copyright: IEEE International Conference on Computer Vision (ICCV), 2015, DOI: 10.1109/ICCV.2015.428

The essence of scientific discoveries was and will be structure. Not surprisingly, the mathematical formulas revolve around relations between variables – information, in general. For example, Galileo derived the law of falling balls from measuring the successive hight of a falling ball. The main difficulty was to obtain measurements at regular time intervals. What about if the data is not structured, which mathematical formula should be applied then? There is a distribution of people’s height, but no distribution for the pictures taken in all holidays for the last year, there is an amplitude for acoustic signals, but no function that detects the similarity between two songs. This is one of the reasons why machine learning focuses heavily on clustering and classification.

Roughly speaking, these simple examples are enough to categorize the difference between scientific discovery and machine learning. Science is about discovering relationships between different variables, Machine Learning tries to automatize processes. Every technical improvement is part of the automation, so why is everything different in this case? Because the current automation deals with human intelligence. The car automates the walking, the kitchen stove the fire, but Machine Learning parts of the human intelligence. There is a difference between the previous automation steps and those of human intelligence. All the previous ones are either outside the human body – such as Fire – or unconsciously executed (once learned) – walking, spinning, etc. The automation induced by Machine Learning affects a part of the human intelligence that we consciously perceive. Of course, today’s machine learning tools are unable to automate all human intelligence, but it is a fascinating step in that direction.

A breakthrough in Machine Learning tasks was achieved in 2012 when the first Deep Learning algorithm for detecting types of images, reached near-human accuracy. It could appreciate the likelihood that the image is a human face, a train, a ball or a fish without having “seen” the picture before. Such an algorithm can be used in various areas:  personally – facial recognition in pictures and/or social media – as tagging of images or videos, medicine – cancer detection, etc. For understanding such cutting-edge issues of classification, one cannot avoid understanding how Deep Learning works. To see the beauty of such algorithms and, at the same time, to be able to comprehend the difficulty of working with them, an example will be the best guide.

The building blocks of Deep Learning are neurons, operational units, which perform mathematical operations or logical operations like AND, OR, etc., and are modelled after the neurons in the brain. Already in the 1950’s two neuroscientist, Hubel and Wiesel, observed that not all neurons in the brain are responding in the same fashion to visual stimuli. Some responded only to horizontal lines, whereas others to vertical lines, with other words, the brain is constructed with specialized neurons. Groups of such neurons are called, in the Machine Learning community, layers. Like in the brain, neurons with different properties are clustered in different layers. This implies that layers have also specific properties and have to be arranged in a specific way, called architecture. It is this architecture which differentiates Deep Learning from Artificial Neuronal Networks (ANN are similar to a layer).

Unfortunately, scientists still haven’t figured out how the brain works, thus to discover how to train Deep Learning from data was not an easy task, and is also the reason why another example is used to explain the training of Deep Learning: the eye. One has always to remember: once it is known how Deep Learning works, it is simple to find example which illustrates the working mechanism.  For such an analogy, it is sufficient for someone without any knowledge about Deep Learning, to keep in mind only the elements that compose such architectures: input data, different layers of neurons, output layers, ReLu’s.

Input data are any type of information, in our example it is light. Of course, that Deep Learning is not limited only to images or videos, but also to sound and/or time series, which would imply that the example would be the ear and sound waves, or the brain and numbers.

Layers can be seen as cells in the eye. It is well known that the eye is formed of different layers connected to each other with each of them having different properties, functionalities. The same is true also for the layers of a Deep Learning architecture: one can see the neurons as cells of the layer as the tissue. While, mathematically, the neurons are nothing more than simple operations, usually linear weight functions, they can be seen as the properties of individual cells. Each layer has one weight matrix, which gives the neuron (and layer) specific properties depending on the data and the task at hand.

It is here that the architecture becomes very important. What Deep Learning offers is a default setting of the layers with unknown weights. One can see this as trying to build an eye knowing that there are different types of cells and different ways how tissues of such cells can be arranged, but not which cell exactly is needed (with what properties) and which arrangement of layers works best. Such an approach has the advantage that one is capable of building any type of organ desired, but the disadvantage is also very obvious: it is time consuming to find the appropriate cell properties and layers arrangements.

Still, the strategy of Deep Learning is a significant departure from the Machine Learning approaches. The performance of Machine Learning methods is as good as the features engineering performed by Data Scientists, and thus depending on the creativity of the Data Scientist. In the case of Deep Learning the engineers of the features is performed automatically as part of the model building. This is a huge improvement, as the only difficult task is to have enough data and computer power to find the right weights matrices. Such an endeavor was performed also by nature for the eye — and is also the reason why one can choose it as an example for Deep Learning — evolution. It is not surprising that Deep Learning is one of the best direction scientists have of Artificial Intelligence today.

The evolution of the eye can be seen, from the perspective of Data Scientists, as the continuous training of a Deep Learning architecture which enables to recognize and track one or more objects. The performance of the evolutional process can be summed up as the fine tuning of the cells which are getting more and more susceptible to light and the adaptation of layers to enable a better vision. Different animals in different environments and different targets — as the hawk and the fly — developed different eyes than humans, but they all work according to the same principle. The tasks that Deep Learning is performing today are similar, for example it can be used to drive cars but there is still a difference:  there is no connection to other organs. Deep Learning is not the approximation of an Artificial Organism, like an android, but a simplified Artificial Organ that can work on its own.

Returning to the working mechanism of the Deep Learning architecture, we can already follow the analogy of what happens if a ray of light is hitting the eye. Once the eye is fully adapted to the task, one can followed how the information enters the Deep Learning architecture (Artificial Eye) by penetrating the input layer. already here arises the question, what kind of eye is the best? One where a small source of light can reach as many neurons as possible, or the one where the light sources reaches only few neurons? In order to take such a decision, a last piece of the puzzle is required: ReLu. One can see them as synapses between neurons (cells) and/or similarly for tissue. By using continuous functions, such as the shape of the latter ‘S’ (called sigmoid), the information from one neuron will be distributed over a large number of other neurons. If one uses the maximum function, then only few neurons are updated with processed information from earlier layers.

Such sparse structures between neurons, was a major improvement in the development of the technique of training Deep Learning architectures. Again, it has a strong evolutionary analogy: energy efficiency. By needing less neurons, the tissues and architecture are both kept to a minimal size which enables flexibility in development and less energy. As the information is process by the different layers, the Artificial Eye is gathering more and more complex (non-linear) structures — the adapted features –, which help to decide, from past experience, what kind of object is detected.

This was part 1 of 2 of the article series. Continue with Part 2.

Interview – Python as productive data science environment

Miroslav Šedivý is a Senior Software Architect at UBIMET GmbH, using Python to make the sun shine and the wind blow. He is an enthusiast of both human and programming languages and found Python as his language of choice to setup very productive environments. Mr. Šedivý was born in Czechoslovakia, studied in France and is now living in Germany. Furthermore, he helps in the organization of the events PyCon.DE and Polyglot Gathering.


On 26th June 2018 he will explain at the Python@DWX conference why “Lifelong Text Hackers Use Vim and Python”. Insert the promotion code PY18science to unlock your 10% discount on all tickets. More info and tickets on python-con.com.


Data Science Blog: Mr. Šedivý, how did you find the way to Python as your favorite programming language?

Apart from traditional languages taught at school (Basic, Pascal, C, Java), some twenty years ago I learned Perl to hack a dynamic web site and used it to automate my daily tasks. Later I used it professionally for scientific calculations in the production. This was later replaced by Python, its newer versions and more advanced libraries. Nowadays Python has almost completely replaced Perl as my principal language and I use Perl just to hack some command line filters and to impress colleagues.

Data Science Blog: Python is one of the most popular programming language for data scientists. This is remarkable as it is originally not designed for doing data science with it. What made it a competitor to languages like R or Julia?

Python is the most powerful programming language that is still legible. This appeals to data scientists who can enter each line interactively, and immediately see what happens, because each line actually does something. They can inspect their data easily and build automating systems to process their data transparently.

Data Science Blog: Is there anything you could do better with another programming language?

Sometimes I’m playing with some functional languages that would allow me to write code that is easier to test and parallelize.

Data Science Blog: Which libraries are the most important ones for your daily business?

The whole Pandas ecosystem with Numpy and Scipy. Matplotlib for plots, PyTables and Psycopg2 for storage. I’m also importing a few async libs for webservices and similar network-based software.

I also enjoy discovering the world of Unicode and Timezones – both of them are the spots where the programmers absolutely have to obey the chaotic reality of the outside world.

Data Science Blog: Which editor do you use? And how to set it up as a productive environment?

I tried several editors and IDEs, but always came back to Vi or Vim. This is an extremely powerful editor that is around since over forty years, which was probably before most of today’s active developers learned to type. I’m using it for all text editing tasks, which I’m actually going to show in my talk at DWX [Lifelong Text Hackers Use Vim and Python]. Steep learning curve is not an argument against a tool you can grok during your entire career.

Data Science Blog: In your opinion: For all developers and data scientists, who are used to Java, Scala, R oder Perl, is Python easy to learn? Could it be too late to switch for somebody?

Python is a great general language that can be learned rapidly to a usable level. It’s different from the aforementioned languages. I remember my switching process from Perl to Python over ten years ago with a book “Perl to Python Migration”, which forced me to switch my way of thinking. From the question “Why do I have to import ‘re’ for regular expressions if Perl uses them natively?” to “Actually, I can solve this problem without regular expressions.”.