Posts

Data Analytics and Mining for Dummies

Data Analytics and Mining is often perceived as an extremely tricky task cut out for Data Analysts and Data Scientists having a thorough knowledge encompassing several different domains such as mathematics, statistics, computer algorithms and programming. However, there are several tools available today that make it possible for novice programmers or people with no absolutely no algorithmic or programming expertise to carry out Data Analytics and Mining. One such tool which is very powerful and provides a graphical user interface and an assembly of nodes for ETL: Extraction, Transformation, Loading, for modeling, data analysis and visualization without, or with only slight programming is the KNIME Analytics Platform.

KNIME, or the Konstanz Information Miner, was developed by the University of Konstanz and is now popular with a large international community of developers. Initially KNIME was originally made for commercial use but now it is available as an open source software and has been used extensively in pharmaceutical research since 2006 and also a powerful data mining tool for the financial data sector. It is also frequently used in the Business Intelligence (BI) sector.

KNIME as a Data Mining Tool

KNIME is also one of the most well-organized tools which enables various methods of machine learning and data mining to be integrated. It is very effective when we are pre-processing data i.e. extracting, transforming, and loading data.

KNIME has a number of good features like quick deployment and scaling efficiency. It employs an assembly of nodes to pre-process data for analytics and visualization. It is also used for discovering patterns among large volumes of data and transforming data into more polished/actionable information.

Some Features of KNIME:

  • Free and open source
  • Graphical and logically designed
  • Very rich in analytics capabilities
  • No limitations on data size, memory usage, or functionalities
  • Compatible with Windows ,OS and Linux
  • Written in Java and edited with Eclipse.

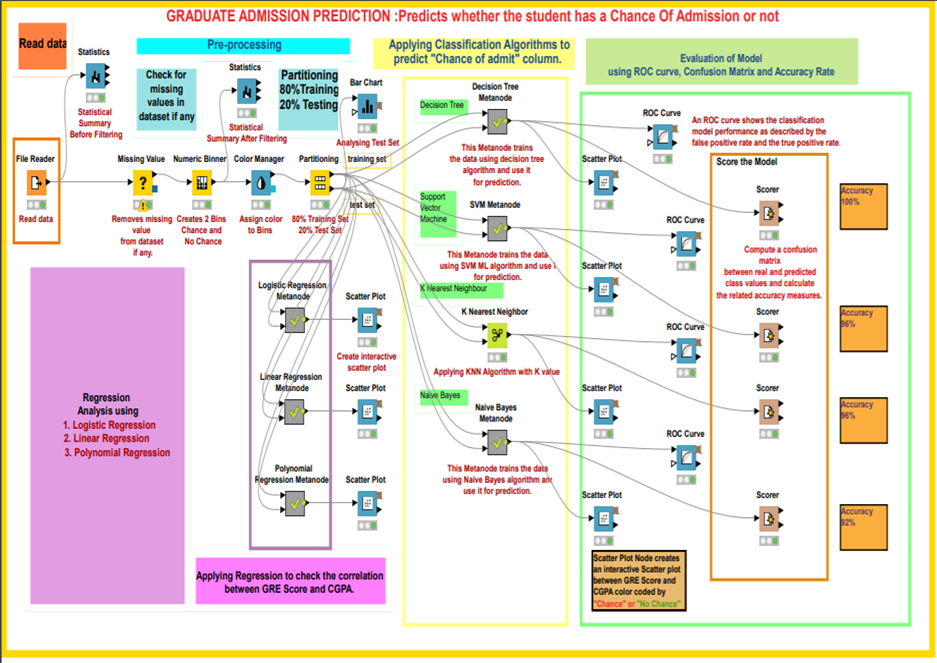
A node is the smallest design unit in KNIME and each node serves a dedicated task. KNIME contains graphical, drag-drop nodes that require no coding. Nodes are connected with one’s output being another’s input, as a workflow. Therefore end-to-end pipelines can be built requiring no coding effort. This makes KNIME stand out, makes it user-friendly and make it accessible for dummies not from a computer science background.

KNIME workflow designed for graduate admission prediction

KNIME workflow designed for graduate admission prediction

KNIME has nodes to carry out Univariate Statistics, Multivariate Statistics, Data Mining, Time Series Analysis, Image Processing, Web Analytics, Text Mining, Network Analysis and Social Media Analysis. The KNIME node repository has a node for every functionality you can possibly think of and need while building a data mining model. One can execute different algorithms such as clustering and classification on a dataset and visualize the results inside the framework itself. It is a framework capable of giving insights on data and the phenomenon that the data represent.

Some commonly used KNIME node groups include:

  • Input-Output or I/O:  Nodes in this group retrieve data from or to write data to external files or data bases.
  • Data Manipulation: Used for data pre-processing tasks. Contains nodes to filter, group, pivot, bin, normalize, aggregate, join, sample, partition, etc.
  • Views: This set of nodes permit users to inspect data and analysis results using multiple views. This gives a means for truly interactive exploration of a data set.
  • Data Mining: In this group, there are nodes that implement certain algorithms (like K-means clustering, Decision Trees, etc.)

Comparison with other tools 

The first version of the KNIME Analytics Platform was released in 2006 whereas Weka and R studio were released in 1997 and 1993 respectively. KNIME is a proper data mining tool whereas Weka and R studio are Machine Learning tools which can also do data mining. KNIME integrates with Weka to add machine learning algorithms to the system. The R project adds statistical functionalities as well. Furthermore, KNIME’s range of functions is impressive, with more than 1,000 modules and ready-made application packages. The modules can be further expanded by additional commercial features.

5 Things You Should Know About Data Mining

The majority of people spend about twenty-four hours online every week. In that time they give out enough information for big data to know a lot about them. Having people collecting and compiling your data might seem scary but it might have been helpful for you in the past.


If you have ever been surprised to find an ad targeted toward something you were talking about earlier or an invention made based on something you were googling, then you already know that data mining can be helpful. Advanced education in data mining can be an awesome resource, so it may pay to have a personal tutor skilled in the area to help you understand. 


It is understandable to be unsure of a system that collects all of the information online so that they can learn more about you. Luckily, so much data is put out every day it is unlikely data mining is focusing on any of your important information. Here are a few statistics you should know about mining.


1. Data Mining Is Used In Crime Scenes

Using a variation of earthquake prediction software and data, the Los Angeles police department and researchers were able to predict crime within five hundred feet. As they learn how to compile and understand more data patterns, crime detecting will become more accurate.


Using their data the Los Angeles police department was able to stop thief activity by thirty-three percent. They were also able to predict violent crime by about twenty-one percent. Those are not perfect numbers, but they are better than before and will get even more impressive as time goes on. 


The fact that data mining is able to pick up on crime statistics and compile all of that data to give an accurate picture of where crime is likely to occur is amazing. It gives a place to look and is able to help stop crime as it starts.


2. Data Mining Helps With Sales

A great story about data mining in sales is the example of Walmart putting beer near the diapers. The story claims that through measuring statistics and mining data it was found that when men purchase diapers they are also likely to buy a pack of beer. Walmart collected that data and put it to good use by putting the beer next to the diapers.


The amount of truth in that story/example is debatable, but it has made data mining popular in most retail stores. Finding which products are often bought together can give insight into where to put products in a store. This practice has increased sales in both items immensely just because people tend to purchase items near one another more than they would if they had to walk to get the second item. 


Putting a lot of stock in the data-gathering teams that big stores build does not always work. There have been plenty of times when data teams failed and sales plummeted. Often, the benefits outweigh the potential failure, however, and many stores now use data mining to make a lot of big decisions about their sales.


3. It’s Helping With Predicting Disease 


In 2009 Google began work to be able to predict the winter flu. Google went through the fifty million most searched words and then compared them with what the CDC was finding during the 2003-2008 flu seasons. With that information google was able to help predict the next winter flu outbreak even down to the states it hit the hardest. 


Since 2009, data mining has gotten much better at predicting disease. Since the internet is a newer invention it is still growing and data mining is still getting better. Hopefully, in the future, we will be able to predict disease breakouts quickly and accurately. 


With new data mining techniques and research in the medical field, there is hope that doctors will be able to narrow down problems in the heart. As the information grows and more data is entered the medical field gets closer to solving problems through data. It is something that is going to help cure diseases more quickly and find the root of a problem.


4. Some Data Mining Gets Ignored

Interestingly, very little of the data that companies collect from you is actually used. “Big data Companies” do not use about eighty-eight percent of the data they have. It is incredibly difficult to use all of the millions of bits of data that go through big data companies every day.


The more people that are used for data mining and the more data companies are actually able to filter through, the better the online experience will be. It might be a bit frightening to think of someone going through what you are doing online, but no one is touching any of the information that you keep private. Big data is using the information you put out into the world and using that data to come to conclusions and make the world a better place.


There is so much information being put onto the internet at all times. Twenty-four hours a week is the average amount of time a single person spends on the internet, but there are plenty of people who spend more time than that. All of that information takes a lot of people to sift through and there are not enough people in the data mining industry to currently actually go through the majority of the data being put online.


5. Too Many Data Mining Jobs

Interestingly, the data industry is booming. In general, there are an amazing amount of careers opening on the internet every day. The industry is growing so quickly that there are not enough people to fill the jobs that are being created.


The lack of talent in the industry means there is plenty of room for new people who want to go into the data mining industry. It was predicted that by 2018 there would be a shortage of 140,000 with deep analytical skills. With the lack of jobs that are being discussed, it is amazing that there is such a shortage in the data industry. 


If big data is only able to wade through less than half of the data being collected then we are wasting a resource. The more people who go into an analytics or computer career the more information we will be able to collect and utilize. There are currently more jobs than there are people in the data mining field and that needs to be corrected.


To Conclude

The data mining industry is making great strides. Big data is trying to use the information they collect to sell more things to you but also to improve the world. Also, there is something very convenient about your computer knowing the type of things you want to buy and showing you them immediately. 


Data mining has been able to help predict crime in Los Angeles and lower crime rates. It has also helped companies know what items are commonly purchased together so that stores can be organized more efficiently. Data mining has even been able to predict the outbreak of disease down to the state.


Even with so much data being ignored and so many jobs left empty, data mining is doing incredible things. The entire internet is constantly growing and the data mining is growing right along with it. As the data mining industry climbs and more people find their careers mining data the more we will learn and the more facts we will find.


Python vs R: Which Language to Choose for Deep Learning?

Data science is increasingly becoming essential for every business to operate efficiently in this modern world. This influences the processes composed together to obtain the required outputs for clients. While machine learning and deep learning sit at the core of data science, the concepts of deep learning become essential to understand as it can help increase the accuracy of final outputs. And when it comes to data science, R and Python are the most popular programming languages used to instruct the machines.

Python and R: Primary Languages Used for Deep Learning

Deep learning and machine learning differentiate based on the input data type they use. While machine learning depends upon the structured data, deep learning uses neural networks to store and process the data during the learning. Deep learning can be described as the subset of machine learning, where the data to be processed is defined in another structure than a normal one.

R is developed specifically to support the concepts and implementation of data science and hence, the support provided by this language is incredible as writing codes become much easier with its simple syntax.

Python is already much popular programming language that can serve more than one development niche without straining even for a bit. The implementation of Python for programming machine learning algorithms is very much popular and the results provided are accurate and faster than any other language. (C or Java). And because of its extended support for data science concept implementation, it becomes a tough competitor for R.

However, if we compare the charts of popularity, Python is obviously more popular among data scientists and developers because of its versatility and easier usage during algorithm implementation. However, R outruns Python when it comes to the packages offered to developers specifically expertise in R over Python. Therefore, to conclude which one of them is the best, let’s take an overview of the features and limits offered by both languages.

Python

Python was first introduced by Guido Van Rossum who developed it as the successor of ABC programming language. Python puts white space at the center while increasing the readability of the developed code. It is a general-purpose programming language that simply extends support for various development needs.

The packages of Python includes support for web development, software development, GUI (Graphical User Interface) development and machine learning also. Using these packages and putting the best development skills forward, excellent solutions can be developed. According to Stackoverflow, Python ranks at the fourth position as the most popular programming language among developers.

Benefits for performing enhanced deep learning using Python are:

  • Concise and Readable Code
  • Extended Support from Large Community of Developers
  • Open-source Programming Language
  • Encourages Collaborative Coding
  • Suitable for small and large-scale products

The latest and stable version of Python has been released as Python 3.8.0 on 14th October 2019. Developing a software solution using Python becomes much easier as the extended support offered through the packages drives better development and answers every need.

R

R is a language specifically used for the development of statistical software and for statistical data analysis. The primary user base of R contains statisticians and data scientists who are analyzing data. Supported by R Foundation for statistical computing, this language is not suitable for the development of websites or applications. R is also an open-source environment that can be used for mining excessive and large amounts of data.

R programming language focuses on the output generation but not the speed. The execution speed of programs written in R is comparatively lesser as producing required outputs is the aim not the speed of the process. To use R in any development or mining tasks, it is required to install its operating system specific binary version before coding to run the program directly into the command line.

R also has its own development environment designed and named RStudio. R also involves several libraries that help in crafting efficient programs to execute mining tasks on the provided data.

The benefits offered by R are pretty common and similar to what Python has to offer:

  • Open-source programming language
  • Supports all operating systems
  • Supports extensions
  • R can be integrated with many of the languages
  • Extended Support for Visual Data Mining

Although R ranks at the 17th position in Stackoverflow’s most popular programming language list, the support offered by this language has no match. After all, the R language is developed by statisticians for statisticians!

Python vs R: Should They be Really Compared?

Even when provided with the best technical support and efficient tools, a developer will not be able to provide quality outputs if he/she doesn’t possess the required skills. The point here is, technical skills rank higher than the resources provided. A comparison of these two programming languages is not advisable as they both hold their own set of advantages. However, the developers considering to use both together are less but they obtain maximum benefit from the process.

Both these languages have some features in common. For example, if a representative comes asking you if you lend technical support for developing an uber clone, you are directly going to decline as Python and R both do not support mobile app development. To benefit the most and develop excellent solutions using both these programming languages, it is advisable to stop comparing and start collaborating!

R and Python: How to Fit Both In a Single Program

Anticipating the future needs of the development industry, there has been a significant development to combine these both excellent programming languages into one. Now, there are two approaches to performing this: either we include R script into Python code or vice versa.

Using the available interfaces, packages and extended support from Python we can include R script into the code and enhance the productivity of Python code. Availability of PypeR, pyRserve and more resources helps run these two programming languages efficiently while efficiently performing the background work.

Either way, using the developed functions and packages made available for integrating Python in R are also effective at providing better results. Available R packages like rJython, rPython, reticulate, PythonInR and more, integrating Python into R language is very easy.

Therefore, using the development skills at their best and maximizing the use of such amazing resources, Python and R can be togetherly used to enhance end results and provide accurate deep learning support.

Conclusion

Python and R both are great in their own names and own places. However, because of the wide applications of Python in almost every operation, the annual packages offered to Python developers are less than the developers skilled in using R. However, this doesn’t justify the usability of R. The ultimate decision of choosing between these two languages depends upon the data scientists or developers and their mining requirements.

And if a developer or data scientist decides to develop skills for both- Python and R-based development, it turns out to be beneficial in the near future. Choosing any one or both to use in your project depends on the project requirements and expert support on hand.

Multi-touch attribution: A data-driven approach

Customers shopping behavior has changed drastically when it comes to online shopping, as nowadays, customer likes to do a thorough market research about a product before making a purchase.

What is Multi-touch attribution?

This makes it really hard for marketers to correctly determine the contribution for each marketing channel to which a customer was exposed to. The path a customer takes from his first search to the purchase is known as a Customer Journey and this path consists of multiple marketing channels or touchpoints. Therefore, it is highly important to distribute the budget between these channels to maximize return. This problem is known as multi-touch attribution problem and the right attribution model helps to steer the marketing budget efficiently. Multi-touch attribution problem is well known among marketers. You might be thinking that if this is a well known problem then there must be an algorithm out there to deal with this. Well, there are some traditional models  but every model has its own limitation which will be discussed in the next section.

Types of attribution models

Most of the eCommerce companies have a performance marketing department to make sure that the marketing budget is spent in an agile way. There are multiple heuristics attribution models pre-existing in google analytics however there are several issues with each one of them. These models are:

Traditional attribution models

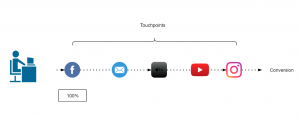
First touch attribution model

100% credit is given to the first channel as it is considered that the first marketing channel was responsible for the purchase.

Figure 1: First touch attribution model

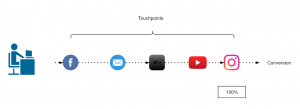
Last touch attribution model

100% credit is given to the last channel as it is considered that the first marketing channel was responsible for the purchase.

Figure 2: Last touch attribution model

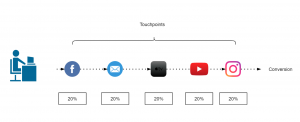
Linear-touch attribution model

In this attribution model, equal credit is given to all the marketing channels present in customer journey as it is considered that each channel is equally responsible for the purchase.

Figure 3: Linear attribution model

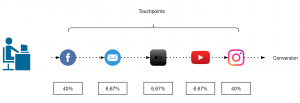
U-shaped or Bath tub attribution model

This is most common in eCommerce companies, this model assigns 40% to first and last touch and 20% is equally distributed among the rest.

Figure 4: Bathtub or U-shape attribution model

Data driven attribution models

Traditional attribution models follows somewhat a naive approach to assign credit to one or all the marketing channels involved. As it is not so easy for all the companies to take one of these models and implement it. There are a lot of challenges that comes with multi-touch attribution problem like customer journey duration, overestimation of branded channels, vouchers and cross-platform issue, etc.

Switching from traditional models to data-driven models gives us more flexibility and more insights as the major part here is defining some rules to prepare the data that fits your business. These rules can be defined by performing an ad hoc analysis of customer journeys. In the next section, I will discuss about Markov chain concept as an attribution model.

Markov chains

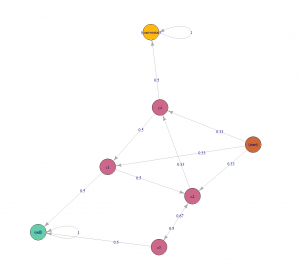
Markov chains concepts revolves around probability. For attribution problem, every customer journey can be seen as a chain(set of marketing channels) which will compute a markov graph as illustrated in figure 5. Every channel here is represented as a vertex and the edges represent the probability of hopping from one channel to another. There will be an another detailed article, explaining the concept behind different data-driven attribution models and how to apply them.

Figure 5: Markov chain example

Challenges during the Implementation

Transitioning from a traditional attribution models to a data-driven one, may sound exciting but the implementation is rather challenging as there are several issues which can not be resolved just by changing the type of model. Before its implementation, the marketers should perform a customer journey analysis to gain some insights about their customers and try to find out/perform:

  1. Length of customer journey.
  2. On an average how many branded and non branded channels (distinct and non-distinct) in a typical customer journey?
  3. Identify most upper funnel and lower funnel channels.
  4. Voucher analysis: within branded and non-branded channels.

When you are done with the analysis and able to answer all of the above questions, the next step would be to define some rules in order to handle the user data according to your business needs. Some of the issues during the implementation are discussed below along with their solution.

Customer journey duration

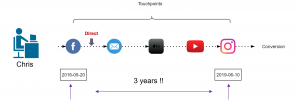
Assuming that you are a retailer, let’s try to understand this issue with an example. In May 2016, your company started a Fb advertising campaign for a particular product category which “attracted” a lot of customers including Chris. He saw your Fb ad while working in the office and clicked on it, which took him to your website. As soon as he registered on your website, his boss called him (probably because he was on Fb while working), he closed everything and went for the meeting. After coming back, he started working and completely forgot about your ad or products. After a few days, he received an email with some offers of your products which also he ignored until he saw an ad again on TV in Jan 2019 (after 3 years). At this moment, he started doing his research about your products and finally bought one of your products from some Instagram campaign. It took Chris almost 3 years to make his first purchase.

Figure 6: Chris journey

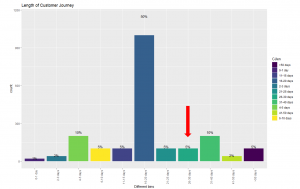
Now, take a minute and think, if you analyse the entire journey of customers like Chris, you would realize that you are still assigning some of the credit to the touchpoints that happened 3 years ago. This can be solved by using an attribution window. Figure 6 illustrates that 83% of the customers are making a purchase within 30 days which means the attribution window here could be 30 days. In simple words, it is safe to remove the touchpoints that happens after 30 days of purchase. This parameter can also be changed to 45 days or 60 days, depending on the use case.

Figure 7: Length of customer journey

Removal of direct marketing channel

A well known issue that every marketing analyst is aware of is, customers who are already aware of the brand usually comes to the website directly. This leads to overestimation of direct channel and branded channels start getting more credit. In this case, you can set a threshold (say 7 days) and remove these branded channels from customer journey.

Figure 8: Removal of branded channels

Cross platform problem

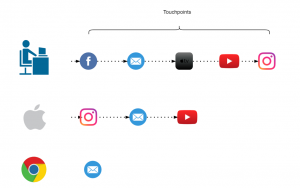
If some of your customers are using different devices to explore your products and you are not able to track them then it will make retargeting really difficult. In a perfect world these customers belong to same journey and if these can’t be combined then, except one, other paths would be considered as “non-converting path”. For attribution problem device could be thought of as a touchpoint to include in the path but to be able to track these customers across all devices would still be challenging. A brief introduction to deterministic and probabilistic ways of cross device tracking can be found here.

Figure 9: Cross platform clash

How to account for Vouchers?

To better account for vouchers, it can be added as a ‘dummy’ touchpoint of the type of voucher (CRM,Social media, Affiliate or Pricing etc.) used. In our case, we tried to add these vouchers as first touchpoint and also as a last touchpoint but no significant difference was found. Also, if the marketing channel of which the voucher was used was already in the path, the dummy touchpoint was not added.

Figure 10: Addition of Voucher as a touchpoint

Data Science Modeling and Featurization

Overview

Data modeling is an essential part of the data science pipeline. This, combined with the fact that it is a very rewarding process, makes it the one that often receives the most attention among data science learners. However, things are not as simple as they may seem, since there is much more to it than applying a function from a particular class of a package and applying it on the data available.

A big part of data science modeling involves evaluating a model, for example, making sure that it is robust and therefore reliable. Also, data science modeling is closely linked to creating an information rich feature set. Moreover, it entails a variety of other processes that ensure that the data at hand is harnessed as much as possible.

What Is a Robust Data Model?

When it comes to robust models, worthy of making it to production, these need to tick several boxes. First of all, they need to have a good performance, based on various metrics. Oftentimes a single metric can be misleading, as how well a model performs has many aspects, especially for classification problems.

In addition, a robust model has good generalization. This means that the model performs well for various datasets, not just the one it has been trained on.

Sensitivity analysis is another aspect of a data science modeling, something essential for thoroughly testing a model to ensure it is robust enough. Sensitivity is a condition whereby a model’s output is bound to change significantly if the inputs change even slightly. This is quite undesirable and needs to be checked since a robust model ought to be stable.

Finally, interpretability is an important aspect too, though it’s not always possible. This has to do with how easy it is to interpret a model’s results. Many modern models, however, are more like black boxes, making it particularly difficult to interpret them. Nevertheless, it is often preferable to opt for an interpretable model, especially if we need to defend its outputs to others.

How Is Featurization Accomplished?

In order for a model to maximize its potential, it needs an information rich set of features. The latter can be created in various ways. Whatever the case, cleaning up the data is a prerequisite. This involves removing or correcting problematic data points, filling in missing values wherever possible, and in some cases removing noisy variables.

Before you can use variables in a model, you need to perform normalization on them. This is usually accomplished through a linear transformation ensuring that the variable’s values are around a certain range. Oftentimes, normalization is sufficient for turning your variables into features, once they are cleaned.

Binning is another process that can aid in featurization. This entails creating nominal (discreet) variables, which can in turn be broken down into binary features, to be used in a data model.

Finally, some dimensionality reduction method (e.g. PCA) can be instrumental in shaping up your feature-set. This has to do with creating linear combinations of features, aka meta-features, which express the same information in fewer dimensions.

Some Useful Considerations

Beyond these basic attributes of data science modeling there several more that every data scientist has in mind in order to create something of value from the available data. Things like in-depth testing using sensitivity analysis, specialized sampling, and various aspects of model performance (as well as tweaking the model to optimize for a particular performance metric) are parts of data science modeling that require meticulous study and ample practice. After all, even though this part of data science is fairly easy to pick up, it takes a while to master, while performing well in it is something that every organization can benefit from.

Resources

To delve more into all this, there are various relevant resources you can leverage, helping you in not just the methodologies involved but also in the mindset behind them. Here are two of the most useful ones.

  1. Data Science Modeling Tutorial on the Safari platform
  2. Data Science Mindset, Methodologies and Misconceptions book (Technics Publications)

Data Science Knowledge Stack – Abstraction of the Data Science Skillset

What must a Data Scientist be able to do? Which skills does as Data Scientist need to have? This question has often been asked and frequently answered by several Data Science Experts. In fact, it is now quite clear what kind of problems a Data Scientist should be able to solve and which skills are necessary for that. I would like to try to bring this consensus into a visual graph: a layer model, similar to the OSI layer model (which any data scientist should know too, by the way).
I’m giving introductory seminars in Data Science for merchants and engineers and in those seminars I always start explaining what we need to work out together in theory and practice-oriented exercises. Against this background, I came up with the idea for this layer model. Because with my seminars the problem already starts: I am giving seminars for Data Science for Business Analytics with Python. So not for medical analyzes and not with R or Julia. So I do not give a general knowledge of Data Science, but a very specific direction.

A Data Scientist must deal with problems at different levels in any Data Science project, for example, the data access does not work as planned or the data has a different structure than expected. A Data Scientist can spend hours debating its own source code or learning the ropes of new DataScience packages for its chosen programming language. Also, the right algorithms for data evaluation must be selected, properly parameterized and tested, sometimes it turns out that the selected methods were not the optimal ones. Ultimately, we are not doing Data Science all day for fun, but for generating value for a department and a data scientist is also faced with special challenges at this level, at least a basic knowledge of the expertise of that department is a must have.


Read this article in German:
“Data Science Knowledge Stack – Was ein Data Scientist können muss“


Data Science Knowledge Stack

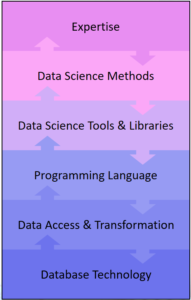
With the Data Science Knowledge Stack, I would like to provide a structured insight into the tasks and challenges a Data Scientist has to face. The layers of the stack also represent a bidirectional flow from top to bottom and from bottom to top, because Data Science as a discipline is also bidirectional: we try to answer questions with data, or we look at the potentials in the data to answer previously unsolicited questions.
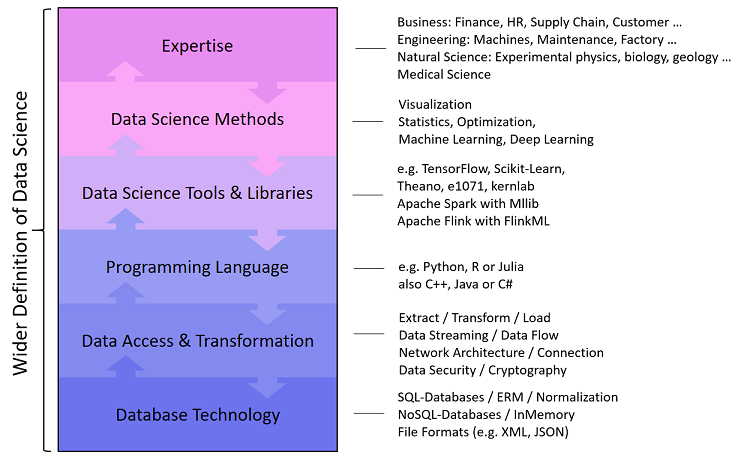
The DataScience Knowledge Stack consists of six layers:

Database Technology Knowledge

A Data Scientist works with data which is rarely directly structured in a CSV file, but usually in one or more databases that are subject to their own rules. In particular, business data, for example from the ERP or CRM system, are available in relational databases, often from Microsoft, Oracle, SAP or an open source alternative. A good Data Scientist is not only familiar with Structured Query Language (SQL), but is also aware of the importance of relational linked data models, so he also knows the principle of data table normalization.

Other types of databases, so-called NoSQL databases (Not only SQL) are based on file formats, column or graph orientation, such as MongoDB, Cassandra or GraphDB. Some of these databases use their own programming languages ​​(for example JavaScript at MongoDB or the graph-oriented database Neo4J has its own language called Cypher). Some of these databases provide alternative access via SQL (such as Hive for Hadoop).

A data scientist has to cope with different database systems and has to master at least SQL – the quasi-standard for data processing.

Data Access & Transformation Knowledge

If data are given in a database, Data Scientists can perform simple (and not so simple) analyzes directly on the database. But how do we get the data into our special analysis tools? To do this, a Data Scientist must know how to export data from the database. For one-time actions, an export can be a CSV file, but which separators and text qualifiers should be used? Possibly, the export is too large, so the file must be split.
If there is a direct and synchronous data connection between the analysis tool and the database, interfaces like REST, ODBC or JDBC come into play. Sometimes a socket connection must also be established and the principle of a client-server architecture should be known. Synchronous and asynchronous encryption methods should also be familiar to a Data Scientist, as confidential data are often used, and a minimum level of security is most important for business applications.

Many datasets are not structured in a database but are so-called unstructured or semi-structured data from documents or from Internet sources. And again we have interfaces, a frequent entry point for Data Scientists is, for example, the Twitter API. Sometimes we want to stream data in near real-time, let it be machine data or social media messages. This can be quite demanding, so the data streaming is almost a discipline with which a Data Scientist can come into contact quickly.

Programming Language Knowledge

Programming languages ​​are tools for Data Scientists to process data and automate processing. Data Scientists are usually no real software developers and they do not have to worry about software security or economy. However, a certain basic knowledge about software architectures often helps because some Data Science programs can be going to be integrated into an IT landscape of the company. The understanding of object-oriented programming and the good knowledge of the syntax of the selected programming languages ​​are essential, especially since not every programming language is the most useful for all projects.

At the level of the programming language, there is already a lot of snares in the programming language that are based on the programming language itself, as each has its own faults and details determine whether an analysis is done correctly or incorrectly: for example, whether data objects are copied or linked as reference, or how NULL/NaN values ​​are treated.

Data Science Tool & Library Knowledge

Once a data scientist has loaded the data into his favorite tool, for example, one of IBM, SAS or an open source alternative such as Octave, the core work just began. However, these tools are not self-explanatory and therefore there is a wide range of certification options for various Data Science tools. Many (if not most) Data Scientists work mostly directly with a programming language, but this alone is not enough to effectively perform statistical data analysis or machine learning: We use Data Science libraries (packages) that provide data structures and methods as a groundwork and thus extend the programming language to a real Data Science toolset. Such a library, for example Scikit-Learn for Python, is a collection of methods implemented in the programming language. The use of such libraries, however, is intended to be learned and therefore requires familiarization and practical experience for reliable application.

When it comes to Big Data Analytics, the analysis of particularly large data, we enter the field of Distributed Computing. Tools (frameworks) such as Apache Hadoop, Apache Spark or Apache Flink allows us to process and analyze data in parallel on multiple servers. These tools also provide their own libraries for machine learning, such as Mahout, MLlib and FlinkML.

Data Science Method Knowledge

A Data Scientist is not simply an operator of tools, he uses the tools to apply his analysis methods to data he has selected for to reach the project targets. These analysis methods are, for example, descriptive statistics, estimation methods or hypothesis tests. Somewhat more mathematical are methods of machine learning for data mining, such as clustering or dimensional reduction, or more toward automated decision making through classification or regression.

Machine learning methods generally do not work immediately, they have to be improved using optimization methods like the gradient method. A Data Scientist must be able to detect under- and overfitting, and he must prove that the prediction results for the planned deployment are accurate enough.

Special applications require special knowledge, which applies, for example, to the fields of image recognition (Visual Computing) or the processing of human language (Natural Language Processiong). At this point, we open the door to deep learning.

Expertise

Data Science is not an end in itself, but a discipline that would like to answer questions from other expertise fields with data. For this reason, Data Science is very diverse. Business economists need data scientists to analyze financial transactions, for example, to identify fraud scenarios or to better understand customer needs, or to optimize supply chains. Natural scientists such as geologists, biologists or experimental physicists also use Data Science to make their observations with the aim of gaining knowledge. Engineers want to better understand the situation and relationships between machinery or vehicles, and medical professionals are interested in better diagnostics and medication for their patients.

In order to support a specific department with his / her knowledge of data, tools and analysis methods, every data scientist needs a minimum of the appropriate skills. Anyone who wants to make analyzes for buyers, engineers, natural scientists, physicians, lawyers or other interested parties must also be able to understand the people’s profession.
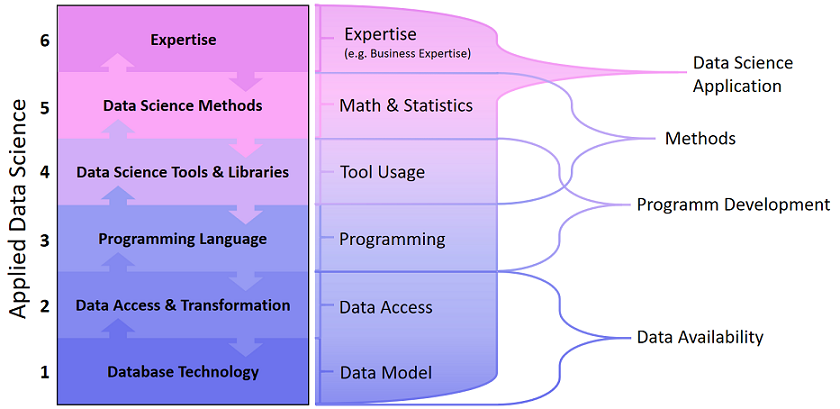
Engere Data Science Definition

While the Data Science pioneers have long established and highly specialized teams, smaller companies are still looking for the Data Science Allrounder, which can take over the full range of tasks from the access to the database to the implementation of the analytical application. However, companies with specialized data experts have long since distinguished Data Scientists, Data Engineers and Business Analysts. Therefore, the definition of Data Science and the delineation of the abilities that a data scientist should have, varies between a broader and a more narrow demarcation.
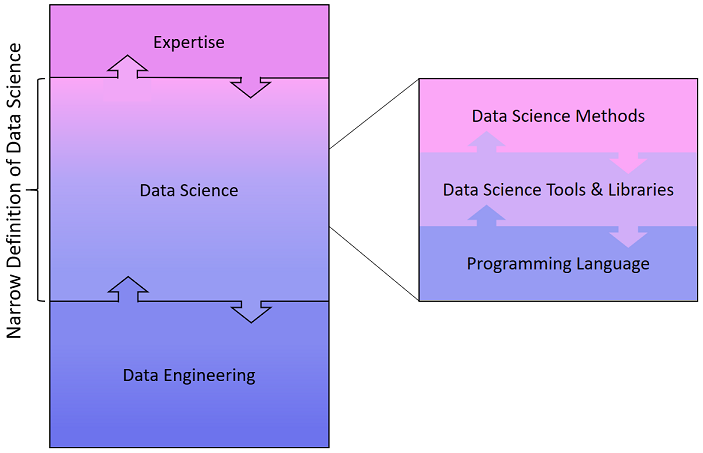

A closer look at the more narrow definition shows, that a Data Engineer takes over the data allocation, the Data Scientist loads it into his tools and runs the data analysis together with the colleagues from the department. According to this, a Data Scientist would need no knowledge of databases or APIs, neither an expertise would be necessary …

In my experience, DataScience is not that narrow, the task spectrum covers more than just the core area. This misunderstanding comes from Data Science courses and – for me – I should point to the overall picture of Data Science again and again. In courses and seminars, which want to teach Data Science as a discipline, the focus will of course be on the core area: programming, tools and methods from mathematics & statistics.

Consider Anonymization – Process Mining Rule 3 of 4

This is article no. 3 of the four-part article series Privacy, Security and Ethics in Process Mining.

Read this article in German:
Datenschutz, Sicherheit und Ethik beim Process Mining – Regel 3 von 4

If you have sensitive information in your data set, instead of removing it you can also consider the use of anonymization. When you anonymize a set of values, then the actual values (for example, the employee names “Mary Jones”, “Fred Smith”, etc.) will be replaced by another value (for example, “Resource 1”, “Resource 2”, etc.).

If the same original value appears multiple times in the data set, then it will be replaced with the same replacement value (“Mary Jones” will always be replaced by “Resource 1”). This way, anonymization allows you to obfuscate the original data but it preserves the patterns in the data set for your analysis. For example, you will still be able to analyze the workload distribution across all employees without seeing the actual names.

Some process mining tools (Disco and ProM) include anonymization functionality. This means that you can import your data into the process mining tool and select which data fields should be anonymized. For example, you can choose to anonymize just the Case IDs, the resource name, attribute values, or the timestamps. Then you export the anonymized data set and you can distribute it among your team for further analysis.

Do:

  • Determine which data fields are sensitive and need to be anonymized (see also the list of common process mining attributes and how they are impacted if anonymized).
  • Keep in mind that despite the anonymization certain information may still be identifiable. For example, there may be just one patient having a very rare disease, or the birthday information of your customer combined with their place of birth may narrow down the set of possible people so much that the data is not anonymous anymore.

Don’t:

  • Anonymize the data before you have cleaned your data, because after the anonymization the data cleaning may not be possible anymore. For example, imagine that slightly different customer category names are used in different regions but they actually mean the same. You would like to merge these different names in a data cleaning step. However, after you have anonymized the names as “Category 1”, “Category 2”, etc. the data cleaning cannot be done anymore.
  • Anonymize fields that do not need to be anonymized. While anonymization can help to preserve patterns in your data, you can easily lose relevant information. For example, if you anonymize the Case ID in your incident management process, then you cannot look up the ticket number of the incident in the service desk system anymore. By establishing a collaborative culture around your process mining initiative (see guideline No. 4) and by working in a responsible, goal-oriented way, you can often work openly with the original data that you have within your team.

Clarify Goal of the Analysis – Process Mining Rule 1 of 4

This is article no. 1 of the four-part article series Privacy, Security and Ethics in Process Mining.

Read this article in German:
Datenschutz, Sicherheit und Ethik beim Process Mining – Regel 1 von 4

Clarify Goal of the Analysis

The good news is that in most situations Process Mining does not need to evaluate personal information, because it usually focuses on the internal organizational processes rather than, for example, on customer profiles. Furthermore, you are investigating the overall process patterns. For example, a process miner is typically looking for ways to organize the process in a smarter way to avoid unnecessary idle times rather than trying to make people work faster.

However, as soon as you would like to better understand the performance of a particular process, you often need to know more about other case attributes that could explain variations in process behaviours or performance. And people might become worried about where this will lead them.

Therefore, already at the very beginning of the process mining project, you should think about the goal of the analysis. Be clear about how the results will be used. Think about what problem are you trying to solve and what data you need to solve this problem.

Do:

  • Check whether there are legal restrictions regarding the data. For example, in Germany employee-related data cannot be used and typically simply would not be extracted in the first place. If your project relates to analyzing customer data, make sure you understand the restrictions and consider anonymization options (see guideline No. 3).
  • Consider establishing an ethical charter that states the goal of the project, including what will and what will not be done based on the analysis. For example, you can clearly state that the goal is not to evaluate the performance of the employees. Communicate to the people who are responsible for extracting the data what these goals are and ask for their assistance to prepare the data accordingly.

Don’t:

  • Start out with a fuzzy idea and simply extract all the data you can get. Instead, think about what problem are you trying to solve? And what data do you actually need to solve this problem? Your project should focus on business goals that can get the support of the process managers you work with (see guideline No. 4).
  • Make your first project too big. Instead, focus on one process with a clear goal. If you make the scope of your project too big, people might block it or work against you while they do not yet even understand what process mining can do.

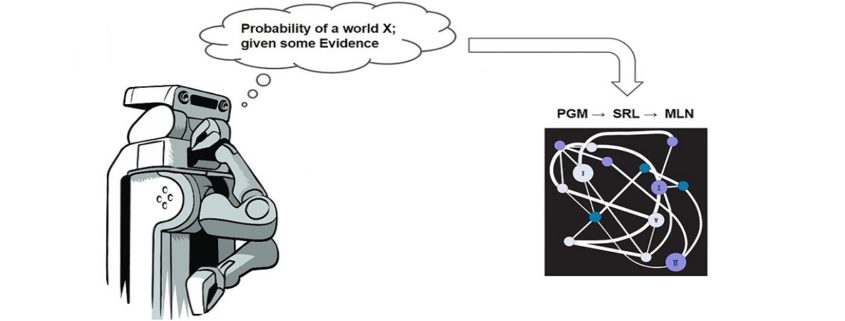
Statistical Relational Learning – Part 2

In the first part of this series onAn Introduction to Statistical Relational Learning”, I touched upon the basic Machine Learning paradigms, some background and intuition of the concepts and concluded with how the MLN template looks like. In this blog, we will dive in to get an in depth knowledge on the MLN template; again with the help of sample examples. I would then conclude by highlighting the various toolkit available and some of its differentiating features.

MLN Template – explained

A Markov logic network can be thought of as a group of formulas incorporating first-order logic and also tied with a weight. But what exactly does this weight signify?

Weight Learning

According to the definition, it is the log odds between a world where F is true and a world where F is false,

and captures the marginal distribution of the corresponding predicate.

Each formula can be associated with some weight value, that is a positive or negative real number. The higher the value of weight, the stronger the constraint represented by the formula. In contrast to classical logic, all worlds (i.e., Herbrand Interpretations) are possible with a certain probability [1]. The main idea behind this is that the probability of a world increases as the number of formulas it violates decreases.

Markov logic networks with its probabilistic approach combined to logic posit that a world is less likely if it violates formulas unlike in pure logic where a world is false if it violates even a single formula. Consider the case when a formula with high weight i.e. more significance is violated implying that it is less likely in occurrence.

Another important concept during the first phase of Weight Learning while applying an MLN template is “Grounding”. Grounding means to replace each variable/function in predicate with constants from the domain.

Weight Learning – An Example

Note: All examples are highlighted in the Alchemy MLN format

Let us consider an example where we want to identify the relationship between 2 different types of verb-noun pairs i.e noun subject and direct object.

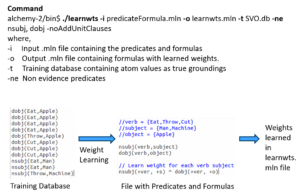
The input predicateFormula.mln file contains

  1. The predicates nsubj(verb, subject) and dobj(verb, object) and
  2. Formula of nsubj(+ver, +s) and dobj(+ver, +o)

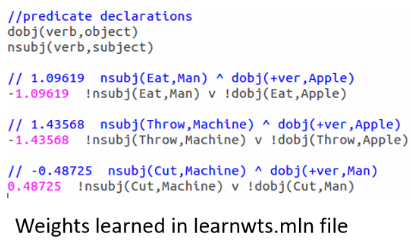
These predicates or rules are to learn all possible SVO combinations i.e. what is the probability of a Subject-Verb-Object combination. The + sign ensures a cross product between the domains and learns all combinations. The training database consists of the nsubj and dobj tuples i.e. relations is the evidence used to learn the weights.

When we run the above command for this set of rules against the training evidence, we learn the weights as here:

Note that the formula is now grounded by all occurrences of nsubj and dobj tuples from the training database or evidence and the weights are attached to it at the start of each such combination.

But it should be noted that there is no network yet and this is just a set of weighted first-order logic formulas. The MLN template we created so far will generate Markov networks from all of our ground formulas. Internally, it is represented as a factor graph.where each ground formula is a factor and all the ground predicates found in the ground formula are linked to the factor.

Inference

The definition goes as follows:

Estimate probability distribution encoded by a graphical model, for a given data (or observation).

Out of the many Inference algorithms, the two major ones are MAP & Marginal Inference. For example, in a MAP Inference we find the most likely state of world given evidence, where y is the query and x is the evidence.

which is in turn equivalent to this formula.

Another is the Marginal Inference which computes the conditional probability of query predicates, given some evidence. Some advanced inference algorithms are Loopy Belief Propagation, Walk-SAT, MC-SAT, etc.

The probability of a world is given by the weighted sum of all true groundings of a formula i under an exponential function, divided by the partition function Z i.e. equivalent to the sum of the values of all possible assignments. The partition function acts a normalization constant to get the probability values between 0 and 1.

Inference – An Example

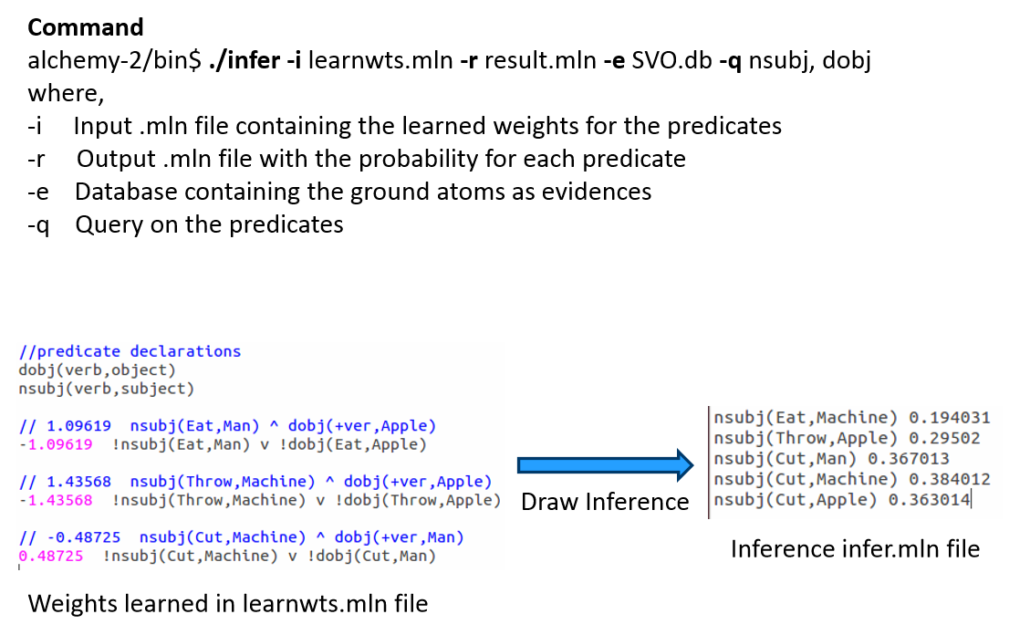
Let us draw inference on the the same example as earlier.

After learning the weights we run inference (with or without partial evidence) and query the relations of interest (nsubj here), to get inferred values.

Tool-kits

Let’s look at some of the MLN tool-kits at disposal to do learning and large scale inference. I have tried to make an assorted list of all tools here and tried to highlight some of its main features & problems.

For example, BUGS i.e. Bayesian Logic uses a Swift Compiler but is Not relational! ProbLog has a Python wrapper and is based on Horn clauses but has No Learning feature. These tools were invented in the initial days, much before the present day MLN looks like.

ProbCog developed at Technical University of Munich (TUM) & the AI Lab at Bremen covers not just MLN but also Bayesian Logic Networks (BLNs), Bayesian Networks & ProLog. In fact, it is now GUI based. Thebeast gives a shell to analyze & inspect model feature weights & missing features.

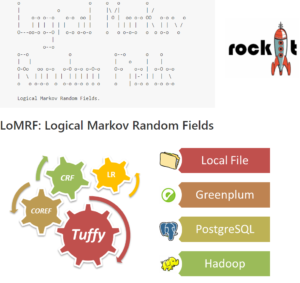
Alchemy from University of Washington (UoW) was the 1st First Order (FO) probabilistic logic toolkit. RockIt from University of Mannheim has an online & rest based interface and uses only Conjunctive Normal Forms (CNF) i.e. And-Or format in its formulas.

Tuffy scales this up by using a Relational Database Management System (RDBMS) whereas Felix allows Large Scale inference! Elementary makes use of secondary storage and Deep Dive is the current state of the art. All of these tools are part of the HAZY project group at Stanford University.

Lastly, LoMRF i.e. Logical Markov Random Field (MRF) is Scala based and has a feature to analyse different hypothesis by comparing the difference in .mln files!


Hope you enjoyed the read. The content starts from basic concepts and ends up highlighting key tools. In the final part of this 3 part blog series I would explain an application scenario and highlight the active research and industry players. Any feedback as a comment below or through a message is more than welcome!

Back to Part I – Statistical Relational Learning

Additional Links:

[1] Knowledge base files in Logical Markov Random Fields (LoMRF)

[2] (still) nothing clever Posts categorized “Machine Learning” – Markov Logic Networks

[3] A gentle introduction to statistical relational learning: maths, code, and examples