Process Paradise by the Dashboard Light

The right questions drive business success. Questions like, “How can I make sure my product is the best of its kind?” “How can I get the edge over my competitors?” and “How can I keep growing my organization?” Modern businesses take their questions further, focusing on the details of how they actually function. At this level, the questions become, “How can I make my business as efficient as possible?” “How can I improve the way my company does business?” and even, “Why aren’t my company’s processes working as they should?”


Read this article in German:

Mit Dashboards zur Prozessoptimierung


To discover the answers to these questions (and many others!), more and more businesses are turning to process mining. Process mining helps organizations unlock hidden value by automatically collecting information on process models from across the different IT systems operating within a business. This allows for continuous monitoring of an organization’s end-to-end process landscape, meaning managers and staff gain specific operational insights into potential risks—as well as ongoing improvement opportunities.

However, process mining is not a silver bullet that turns data into insights at the push of a button. Process mining software is simply a tool that produces information, which then must be analyzed and acted upon by real people. For this to happen, the information produced must be available to decision-makers in an understandable format.

For most process mining tools, the emphasis remains on the sophistication of analysis capabilities, with the resulting data needing to be interpreted by a select group of experts or specialists within an organization. This necessarily creates a delay between the data being produced, the analysis completed, and actions taken in response.

Process mining software that supports a more collaborative approach by reducing the need for specific expertise can help bridge this gap. Only if hypotheses, analysis, and discoveries are shared, discussed, and agreed upon with a wide range of people can really meaningful insights be generated.

Of course, process mining software is currently capable of generating standardized reports and readouts, but in a business environment where the pace of change is constantly increasing, this may not be sufficient for very much longer. For truly effective process mining, the secret to success will be anticipating challenges and opportunities, then dealing with them as they arise in real time.

Dashboards of the future

To think about how process mining could improve, let’s consider an analog example. Technology evolves to make things easier—think of the difference between keeping track of expenditure using a written ledger vs. an electronic spreadsheet. Now imagine the spreadsheet could tell you exactly when you needed to read it, and where to start, as well as alerting you to errors and omissions before you were even aware you’d made them.

Advances in process mining make this sort of enhanced assistance possible for businesses seeking to improve the way they work. With the right process mining software, companies can build tailored operational cockpits that unite real-time operational data with process management. This allows for the usual continuous monitoring of individual processes and outcomes, but it also offers even clearer insights into an organization’s overall process health.

Combining process mining with an organization’s existing process models in the right way turns these models from static representations of the way a particular process operates, into dynamic dashboards that inform, guide and warn managers and staff about problems in real time. And remember, dynamic doesn’t have to mean distracting—the right process mining software cuts into your processes to reveal an all-new analytical layer of process transparency, making things easier to understand, not harder.

As a result, business transformation initiatives and other improvement plans and can be adapted and restructured on the go, while decision-makers can create automated messages to immediately be advised of problems and guided to where the issues are occurring, allowing corrective action to be completed faster than ever. This rapid evaluation and response across any process inefficiencies will help organizations save time and money by improving wasted cycle times, locating bottlenecks, and uncovering non-compliance across their entire process landscape.

Dynamic dashboards with Signavio

To see for yourself how the most modern and advanced process mining software can help you reveal actionable insights into the way your business works, give Signavio Process Intelligence a try. With Signavio’s Live Insights, all your process information can be visualized in one place, represented through a traffic light system. Simply decide which processes and which activities within them you want to monitor or understand, place the indicators, choose the thresholds, and let Signavio Process Intelligence connect your process models to the data.

Banish multiple tabs and confusing layouts, amaze your colleagues and managers with fact-based insights to support your business transformation, and reduce the time it takes to deliver value from your process management initiatives. To find out more about Signavio Process Intelligence, or sign up for a free 30-day trial, visit www.signavio.com/try.

Process mining is a powerful analysis tool, giving you the visibility, quantifiable numbers, and information you need to improve your business processes. Would you like to read more? With this guide to managing successful process mining initiatives, you will learn that how to get started, how to get the right people on board, and the right project approach.

How to Make Better Decisions

Humans make decisions all the time. Some of these decisions are minor, like what to wear or what to eat. Some may seem minor, but actually have the potential to make a huge difference in an individual’s life; deciding if it’s safe to cross the road, for example. Of course, as the relative power of a decision-maker grows, the larger the impact, with many decisions affecting whole communities, or even the world.


Read this article in German:

Treffen Sie bessere Entscheidungen


In the same way, businesses depend on decisions. In fact, any business can be considered as the sum total of all sorts of decisions, large and small, from what new markets to enter into, to the next big advertising campaign, or what color to paint the walls in the new office. In an ideal world, each individual decision within an organization would be just one part of a consistent, coherent strategy driving the entire business.

Unfortunately, for many businesses, this consistency can be quite elusive. It can be difficult just to keep track of what was decided in yesterday’s meeting, let alone weeks, months, or years ago. One way to overcome this challenge is to identify, categorize, and standardize decision-making within your organization.

Strategic, tactical, and operational decisions

In broad terms, there are three ‘levels’ of decisions within a business. Strategic decisions are big-picture, concerning the company as a whole; things like mergers and acquisitions, or eliminating an underperforming line of business. Tactical decisions are those made on specific issues, like where and how to conduct a marketing campaign.

Finally, there are operational decisions, the kind every person in every company makes every day about the way they carry out their work. Examples of operational decisions include how many loyalty points to award a customer, which vendor to purchase materials and services from, how much credit to extend a customer, and many others. Millions of these decisions happen every day.

The cumulative effect of these operational decisions has huge impacts on business performance. Not necessarily on the broader issues facing a company, the way strategic or tactical decisions do, but on how smoothly and effectively things actually get done within the organization.

Risks of poor decision-making

At the operational level, even seemingly small decisions, if they are replicated widely, can have significant repercussions across a business. In many cases, this will mean:

  • Reduced operational compliance: employees and systems won’t know what management expects, or what the correct procedure is. In time this may lead to a general failure to comply with directives.
  • Less agility: unmanaged or unstructured decisions are difficult to change quickly in response to new internal or external circumstances.
  • Reduced accuracy: without a clear decision-making framework, inaccurate and imprecise targeting of process and practices may become more widespread.
  • Lack of transparency: employees and management may not be able to see and understand the factors that need to be taken into account for effective decision-making.
  • Increased regulatory non-compliance: many decisions affect tax, finance and environmental reporting, where the wrong choice leads to potentially breaking laws and regulations, and the resulting fines and legal costs.

These risks can manifest when decisions are not separated from the daily stream of business requirements. If the “right” decision can only be determined by searching through artifacts like use cases, stories, and processes, or relevant rules and data are spread across different parts of the business, then it is no surprise if that decision is difficult to reach.

How to make better decisions

The right decision at the right time is critical to business success, yet few businesses manage their decisions as separate entities. While most companies use KPI’s (or an equivalent) to measure the impact of their decisions, it is much less common for a business to create an inventory of the decisions themselves.

To overcome this, organizations should consider their important decisions as assets to be managed, just like any other business asset. The most effective way to do this is to make use of Business Decision Management, or BDM, a discipline used to identify, catalogue, and model decisions, particularly the operational decisions discussed above. BDM can also quantify their impact on performance and creates metrics and key indicators for the decisions.

With an effective BDM approach, businesses can then create models of their decisions, and more importantly the way they make decisions, using with Decision Model and Notation (DMN). DMN provides a clear, easy-to-follow notation system that describes business decisions, including the rules and data that drive the decision.

Better decisions with Signavio

The Signavio Business Transformation Suite offers a range of tools not only to support the DMN standard, but also to build a comprehensive environment for collaborating on the discovery, management and improvement of your decisions.

In particular, Signavio Process Manager gives you the capability to standardize, replicate, and re-use decisions across multiple business areas, as well as connecting those decisions to the business processes they drive. Signavio Process Manager empowers everyone in your organization to make the best decision for their work, no matter how complex.

Extracting the decision from the clutches of uncertain management and technology will reap many benefits, including improved performance and reduced risk. If you’d like to discover these benefits for yourself, why not sign up for a free 30 day trial with Signavio, today. Would you like to know more? Read our white paper on DMN.

Visual Question Answering with Keras – Part 2: Making Computers Intelligent to answer from images

Making Computers Intelligent to answer from images

This is my second blog on Visual Question Answering, in the last blog, I have introduced to VQA, available datasets and some of the real-life applications of VQA. If you have not gone through then I would highly recommend you to go through it. Click here for more details about it.

In this blog post, I will walk through the implementation of VQA in Keras.

You can download the dataset from here: https://visualqa.org/index.html. All my experiments were performed with VQA v2 and I have used a very tiny subset of entire dataset i.e all samples for training and testing from the validation set.

Table of contents:

  1. Preprocessing Data
  2. Process overview for VQA
  3. Data Preprocessing – Images
  4. Data Preprocessing through the spaCy library- Questions
  5. Model Architecture
  6. Defining model parameters
  7. Evaluating the model
  8. Final Thought
  9. References

NOTE: The purpose of this blog is not to get the state-of-art performance on VQA. But the idea is to get familiar with the concept. All my experiments were performed with the validation set only.

Full code on my Github here.


1. Preprocessing Data:

If you have downloaded the dataset then the question and answers (called as annotations) are in JSON format. I have provided the code to extract the questions, annotations and other useful information in my Github repository. All extracted information is stored in .txt file format. After executing code the preprocessing directory will have the following structure.

All text files will be used for training.


2. Process overview for VQA:

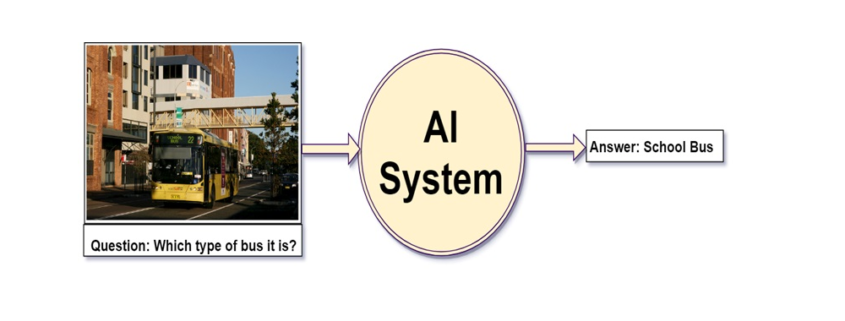
As we have discussed in previous post visual question answering is broken down into 2 broad-spectrum i.e. vision and text.  I will represent the Neural Network approach to this problem using the Convolutional Neural Network (for image data) and Recurrent Neural Network(for text data). 

If you are not familiar with RNN (more precisely LSTM) then I would highly recommend you to go through Colah’s blog and Andrej Karpathy blog. The concepts discussed in this blogs are extensively used in my post.

The main idea is to get features for images from CNN and features for the text from RNN and finally combine them to generate the answer by passing them through some fully connected layers. The below figure shows the same idea.


I have used VGG-16 to extract the features from the image and LSTM layers to extract the features from questions and combining them to get the answer.

3. Data Preprocessing – Images:

Images are nothing but one of the input to our model. But as you already may know that before feeding images to the model we need to convert into the fixed-size vector.

So we need to convert every image into a fixed-size vector then it can be fed to the neural network. For this, we will use the VGG-16 pretrained model. VGG-16 model architecture is trained on millions on the Imagenet dataset to classify the image into one of 1000 classes. Here our task is not to classify the image but to get the bottleneck features from the second last layer.

Hence after removing the softmax layer, we get a 4096-dimensional vector representation (bottleneck features) for each image.

Image Source: https://www.cs.toronto.edu/~frossard/post/vgg16/


For the VQA dataset, the images are from the COCO dataset and each image has unique id associated with it. All these images are passed through the VGG-16 architecture and their vector representation is stored in the “.mat” file along with id. So in actual, we need not have to implement VGG-16 architecture instead we just do look up into file with the id of the image at hand and we will get a 4096-dimensional vector representation for the image.

4. Data Preprocessing through the spaCy library- Questions:

spaCy is a free, open-source library for advanced Natural Language Processing (NLP) in Python. As we have converted images into a fixed 4096-dimensional vector we also need to convert questions into a fixed-size vector representation. For installing spaCy click here

You might know that for training word embeddings in Keras we have a layer called an Embedding layer which takes a word and embeds it into a higher dimensional vector representation. But by using the spaCy library we do not have to train the get the vector representation in higher dimensions.


This model is actually trained on billions of tokens of the large corpus. So we just need to call the vector method of spaCy class and will get vector representation for word.

After fitting, the vector method on tokens of each question will get the 300-dimensional fixed representation for each word.

5. Model Architecture:

In our problem the input consists of two parts i.e an image vector, and a question, we cannot use the Sequential API of the Keras library. For this reason, we use the Functional API which allows us to create multiple models and finally merge models.

The below picture shows the high-level architecture idea of submodules of neural network.

After concatenating the 2 different models the summary will look like the following.

The below plot helps us to visualize neural network architecture and to understand the two types of input:


6. Defining model parameters:

The hyperparameters that we are going to use for our model is defined as follows:

If you know what this parameter means then you can play around it and can get better results.

Time Taken: I used the GPU on https://colab.research.google.com and hence it took me approximately 2 hours to train the model for 5 epochs. However, if you train it on a PC without GPU, it could take more time depending on the configuration of your machine.

7. Evaluating the model:

Since I have used the very small dataset for performing these experiments I am not able to get very good accuracy. The below code will calculate the accuracy of the model.


Since I have trained a model multiple times with different parameters you will not get the same accuracy as me. If you want you can directly download mode.h5 file from my google drive.


8. Final Thoughts:

One of the interesting thing about VQA is that it a completely new field. So there is absolutely no end to what you can do to solve this problem. Below are some tips while replicating the code.

  1. Start with a very small subset of data: When you start implementing I suggest you start with a very small amount of data. Because once you are ready with the whole setup then you can scale it any time.
  2. Understand the code: Understanding code line by line is very much helpful to match your theoretical knowledge. So for that, I suggest you can take very few samples(maybe 20 or less) and run a small chunk (2 to 3 lines) of code to get the functionality of each part.
  3. Be patient: One of the mistakes that I did while starting with this project was to do everything at one go. If you get some error while replicating code spend 4 to 5 days harder on that. Even after that if you won’t able to solve, I would suggest you resume after a break of 1 or 2 days. 

VQA is the intersection of NLP and CV and hopefully, this project will give you a better understanding (more precisely practically) with most of the deep learning concepts.

If you want to improve the performance of the model below are few tips you can try:

  1. Use larger datasets
  2. Try Building more complex models like Attention, etc
  3. Try using other pre-trained word embeddings like Glove 
  4. Try using a different architecture 
  5. Do more hyperparameter tuning

The list is endless and it goes on.

In the blog, I have not provided the complete code you can get it from my Github repository.

9. References:

  1. https://blog.floydhub.com/asking-questions-to-images-with-deep-learning/
  2. https://tryolabs.com/blog/2018/03/01/introduction-to-visual-question-answering/
  3. https://github.com/sominwadhwa/vqamd_floyd

Marketing Attribution Models

Why do we need attribution?

Attributionis the process of distributing the value of a purchase between the various channels, used in the funnel chain. It allows you to determine the role of each channel in profit. It is used to assess the effectiveness of campaigns, to identify more priority sources. The competent choice of the model makes it possible to optimally distribute the advertising budget. As a result, the business gets more profit and less expenses.

What models of attribution exist

The choice of the appropriate model is an important issue, because depending on the business objectives, it is better to fit something different. For example, for companies that have long been present in the industry, the priority is to know which sources contribute to the purchase. Recognition is the importance for brands entering the market. Thus, incorrect prioritization of sources may cause a decrease in efficiency. Below are the models that are widely used in the market. Each of them is guided by its own logic, it is better suited for different businesses.

First Interaction (First Click)

The value is given to the first touch. It is suitable only for several purposes and does not make it possible to evaluate the role of each component in making a purchase. It is chosen by brands who want to increase awareness and reach.

Advantages

It does not require knowledge of programming, so the introduction of a business is not difficult. A great option that effectively assesses campaigns, aimed at creating awareness and demand for new products.

Disadvantages

It limits the ability to analyze comprehensively all channels that is used to promote a brand. It gives value to the first interaction channel, ignoring the rest.

Who is suitable for?

Suitable for those who use the promotion to increase awareness, the formation of a positive image. Also allows you to find the most effective source.

Last Interaction (Last Click)

It gives value to the last channel with which the consumer interacted before making the purchase. It does not take into account the actions that the user has done up to this point, what marketing activities he encountered on the way to conversion.

Advantages

The tool is widely used in the market, it is not difficult. It solves the problem of small advertising campaigns, where is no more than 3 sources.

Disadvantages

There is no way to track how other channels have affected the acquisition.

Who is suitable for?

It is suitable for business models that have a short purchase cycle. This may be souvenirs, seasonal offers, etc.

Last Non-Direct Click

It is the default in Google Analytics. 100% of the  conversion value gives the last channel that interacted with the buyer before the conversion. However, if this source is Direct, then assumptions are counted.

Suppose a person came from an email list, bookmarked a product, because at that time it was not possible to place an order. After a while he comes back and makes a purchase. In this case, email as a channel for attracting users would be underestimated without this model.

Who is suitable for?

It is perfect for beginners who are afraid of making a mistake in the assessment. Because it allows you to form a general idea of ​​the effectiveness of all the involved channels.

Linear model attribution (Linear model)

The value of the conversion is divided in equal parts between all available channels.

Linear model attribution (Linear model)

Advantages

More advanced model than previous ones, however, characterized by simplicity. It takes into account all the visits before the acquisition.

Disadvantages

Not suitable for reallocating the budget between the channels. This is due to the fact that the effectiveness of sources may differ significantly and evenly divide – it is not the best idea. 

Who is suitable for?

It is performing well for businesses operating in the B2B sector, which plays a great importance to maintain contact with the customer during the entire cycle of the funnel.

Taking into account the interaction duration (Time Decay)

A special feature of the model is the distribution of the value of the purchase between the available channels by increment. Thus, the source, that is at the beginning of the chain, is given the least value, the channel at the end deserves the greatest value.  

Advantages

Value is shared between all channel. The highest value is given to the source that pushed the user to make a purchase.

Disadvantages

There is no fair assessment of the effectiveness of the channels, that have made efforts to obtain the desired result.

Who is suitable for?

It is ideal for evaluating the effectiveness of advertising campaigns with a limited duration.

Position-Based or U-Shaped

40% receive 2 channels, which led the user and pushed him to purchase. 20% share among themselves the intermediate sources that participated in the chain.

Advantages

Most of the value is divided equally between the key channels – the fact that attracted the user and closed the deal..

Disadvantages

Underestimated intermediate channels.It happens that they make it possible to more effectively promote the user chain.. Because they allow you to subscribe to the newsletter or start following the visitor for price reduction, etc.

Who is suitable for?

Interesting for businesses that focus on attracting new audiences, as well as pushing existing customers to buy.

Cons of standard attribution models

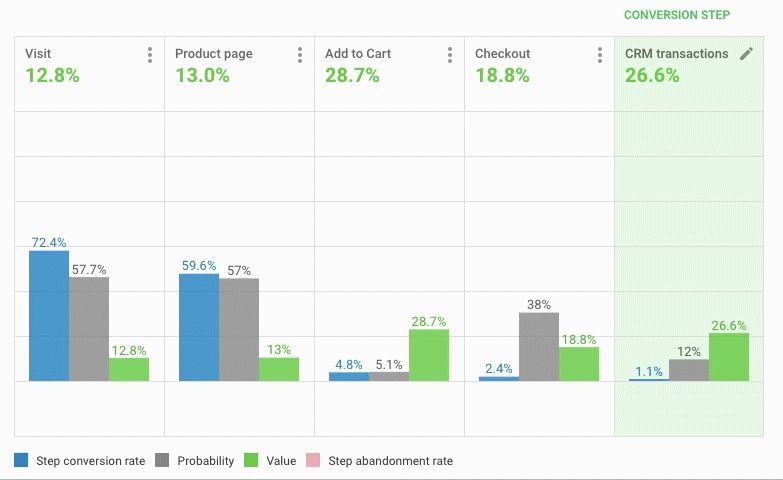
According to statistics, only 44% of foreign experts use attribution on the last interaction. Speaking about the domestic market, we can announce the numbers are much higher. However, only 18% of marketers use more complex models. There is also evidence which demonstrates that 72.4% of those who use attribution based on the last interaction, they use it not because of efficiency, but because it is simple.

What leads to a similar state of affairs?

Experts do not understand the effectiveness. Ignorance of how more complex models work leads to a lack of understanding of the real benefits for the business.

Attribution management is distributed among several employees. In view of this, different models can be used simultaneously. This approach greatly distorts the data obtained, not allowing an objective assessment of the effect of channels.

No comprehensive data storage. Information is stored in different places and does not take into account other channels. Using the analytics of the advertising office, it is impossible to work with customers in retail outlets.

You may find ways to eliminate these moments and attribution will work for the benefit of the business.

What algorithmic attribution models exist

Using one channel, there is no need to enable complex models. Attribution will be enough for the last interaction. It has everything to evaluate the effectiveness of the campaign, determine the profitability, understand the benefits for the business.

Moreover, if the number of channels increases significantly, and goals are already far beyond recognition, it will be better to give preference to more complex models. They allow you to collect all the information in one place, open up limitless monitoring capabilities, make it clear how one channel affects the other and which bundles work better together.

Below are the well-known and widely used today algorithmic attribution models.

Data-Driven Attribution

A model that allows you to track all the way that the consumer has done before making a purchase. It objectively evaluates each channel and does not take into account the position of the source in the funnel. It demonstrates how a certain interaction affected the outcome. Data-Driven attribution model is used in Google Analytics 360.

With it, you can work efficiently with channels that are underestimated in simpler models. It gives the opportunity to distribute the advertising budget correctly.

Attribution based on Markov’s Chains (Markov Chains)

Markov’s chain has been used for a long time to predict weather, matches, etc. The model allows you to find out, how the lack of a channel will affect sales. Its advantage is the ability to assess the impact of the source on the conversion, to find out which channel brings the best results.

A great option for companies that store data in one service. To implement requires knowledge of programming. It has one drawback in the form of underestimating the first channel in the chain. 

OWOX BI Attribution

OWOX BI Attribution helps you assess the mutual influence of channels on encouraging a customer through the funnel and achieving a conversion.

What information can be processed:

  • Upload user data from Google Analytics using flexible built-in tools.
  • Process information from various advertising services.
  • Integrate the model with CRM systems.

This approach makes it possible not to lose sight of any channel. Analyze the complex impact of marketing tools, correctly distributing the advertising budget.

The model uses CRM information, which makes it possible to do end-to-end analytics. Each user is assigned an identifier, so no matter what device he came from, you can track the chain of actions and understand that it is him. This allows you to see the overall effect of each channel on the conversion.

Advantages

Provides an integrated approach to assessing the effectiveness of channels, allows you to identify consumers, even with different devices, view all visits. It helps to determine where the user came from, what prompted him to do so. With it, you can control the execution of orders in CRM, to estimate the margin. To evaluate in combination with other models in order to determine the highest priority advertising campaigns that bring the most profit.

Disadvantages

It is impossible to objectively evaluate the first step of the chain.

Who is suitable for?

Suitable for all businesses that aim to account for each step of the chain and the qualitative assessment of all advertising channels.

Conclusion

The above-mentioned Ad Roll study shows that 70% of marketing managers find it difficult to use the results obtained from attribution. Moreover, there will be no result without it.

To obtain a realistic assessment of the effectiveness of marketing activities, do the following:

  • Determine priority KPIs.
  • Appoint a person responsible for evaluating advertising campaigns.
  • Define a user funnel chain.
  • Keep track of all data, online and offline. 
  • Make a diagnosis of incoming data.
  • Find the best attribution model for your business.
  • Use the data to make decisions.

My Desk for Data Science

In my last post I anounced a blog parade about what a data scientist’s workplace might look like.

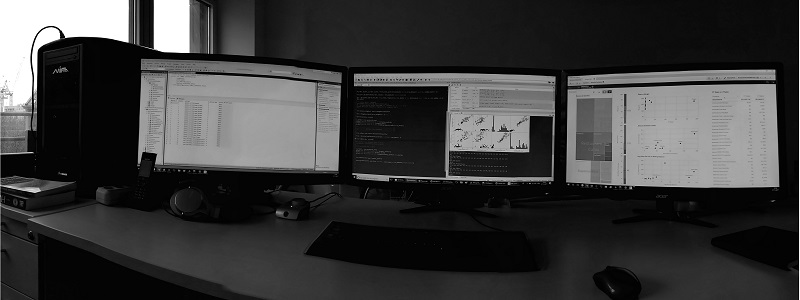
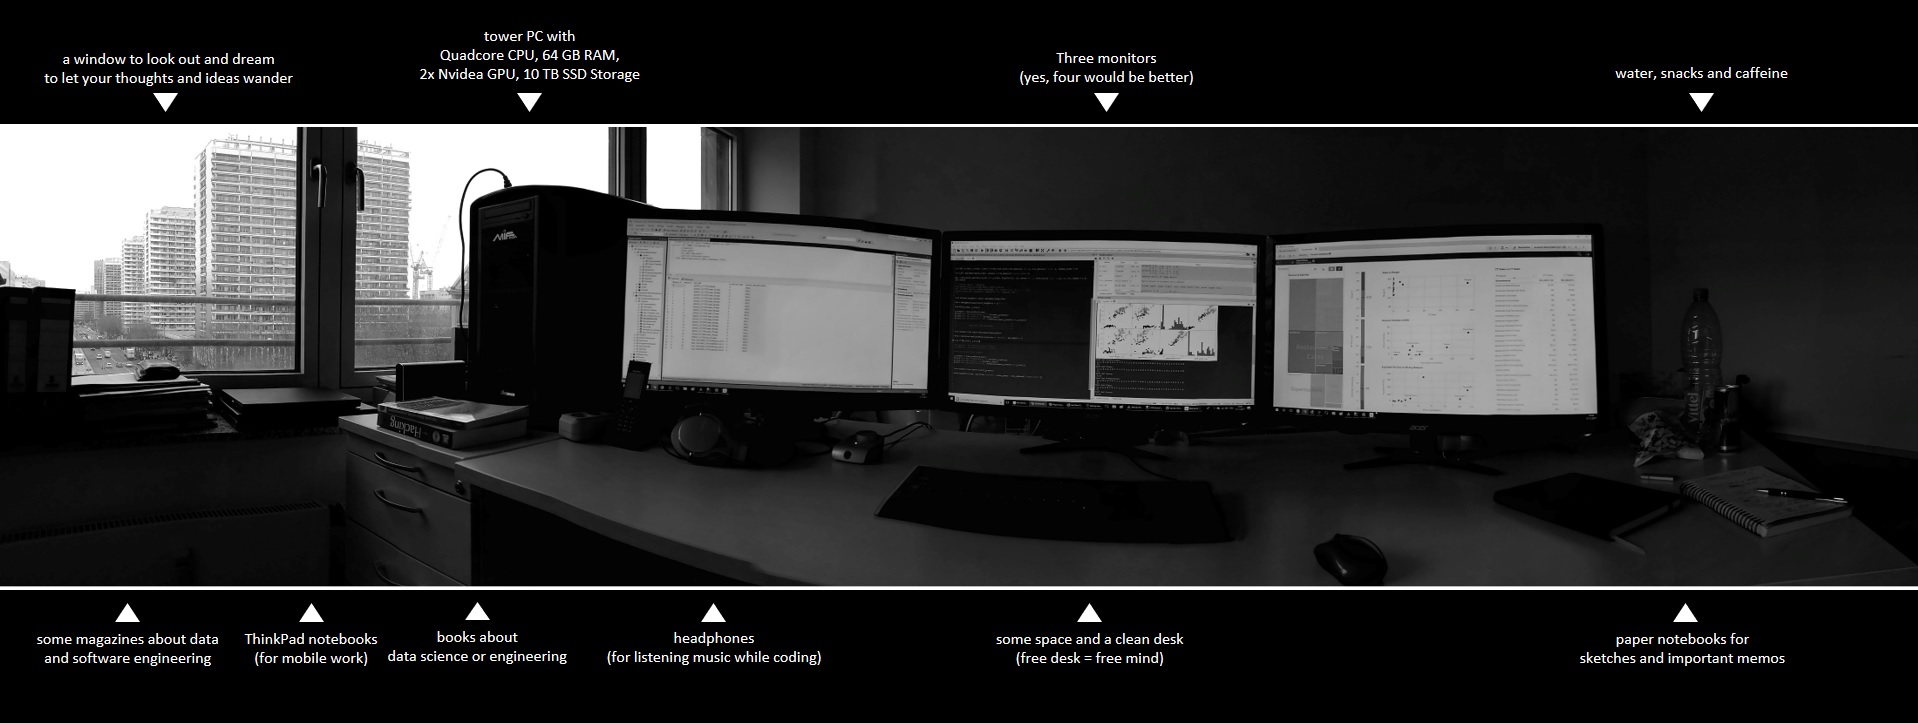
Here are some photos of my desk and my answers to the questions:

How many monitors do you use (or wish to have)?

I am mostly working at my desk in my office with a tower PC and three monitors.
I definitely need at least three monitors to work productively as a data scientist. Who does not know this: On the left monitor the data model is displayed, on the right monitor the data mapping and in the middle I do my work: programming the analysis scripts.

What hardware do you use? Apple? Dell? Lenovo? Others?

I am note an Apple guy. When I need to work mobile, I like to use ThinkPad notebooks. The ThinkPads are (in my experience) very robust and are therefore particularly good for mobile work. Besides, those notebooks look conservative and so I’m not sad if there comes a scratch on the notebook. However, I do not solve particularly challenging analysis tasks on a notebook, because I need my monitors for that.

Which OS do you use (or prefer)? MacOS, Linux, Windows? Virtual Machines?

As a data scientist, I have to be able to communicate well with my clients and they usually use Microsoft Windows as their operating system. I also use Windows as my main operating system. Of course, all our servers run on Linux Debian, but most of my tasks are done directly on Windows.
For some notebooks, I have set up a dual boot, because sometimes I need to start native Linux, for all other cases I work with virtual machines (Linux Ubuntu or Linux Mint).

What are your favorite databases, programming languages and tools?

I prefer the Microsoft SQL Server (T-SQL), C# and Python (pandas, numpy, scikit-learn). This is my world. But my customers are kings, therefore I am working with Postgre SQL, MongoDB, Neo4J, Tableau, Qlik Sense, Celonis and a lot more. I like to get used to new tools and technologies again and again. This is one of the benefits of being a data scientist.

Which data dou you analyze on your local hardware? Which in server clusters or clouds?

There have been few cases yet, where I analyzed really big data. In cases of analyzing big data we use horizontally scalable systems like Hadoop and Spark. But we also have customers analyzing middle-sized data (more than 10 TB but less than 100 TB) on one big server which is vertically scalable. Most of my customers just want to gather data to answer questions on not so big amounts of data. Everything less than 10TB we can do on a highend workstation.

If you use clouds, do you prefer Azure, AWS, Google oder others?

Microsoft Azure! I am used to tools provided by Microsoft and I think Azure is a well preconfigured cloud solution.

Where do you make your notes/memos/sketches. On paper or digital?

My calender is managed digital, because I just need to know everywhere what appointments I have. But my I prefer to wirte down my thoughts on paper and that´s why I have several paper-notebooks.

Now it is your turn: Join our Blog Parade!

So what does your workplace look like? Show your desk on your blog until 31/12/2017 and we will show a short introduction of your post here on the Data Science Blog!


Success Criteria Process Mining

Process Mining is much more than the automatic drawing of process models.

Process mining is on the rise. By using Process mining, organizations can see how their processes really operate [1]. The results are amazing new insights about these processes that cannot be obtained in any other way. However, there are a few things that can go wrong. In this article, Frank van Geffen and Anne Rozinat give you tips about the pitfalls and advice that will help you to make your first process mining project as successful as it can be. Read more