Geschriebene Artikel über Big Data Analytics

5 Things You Should Know About Data Mining

The majority of people spend about twenty-four hours online every week. In that time they give out enough information for big data to know a lot about them. Having people collecting and compiling your data might seem scary but it might have been helpful for you in the past.


If you have ever been surprised to find an ad targeted toward something you were talking about earlier or an invention made based on something you were googling, then you already know that data mining can be helpful. Advanced education in data mining can be an awesome resource, so it may pay to have a personal tutor skilled in the area to help you understand. 


It is understandable to be unsure of a system that collects all of the information online so that they can learn more about you. Luckily, so much data is put out every day it is unlikely data mining is focusing on any of your important information. Here are a few statistics you should know about mining.


1. Data Mining Is Used In Crime Scenes

Using a variation of earthquake prediction software and data, the Los Angeles police department and researchers were able to predict crime within five hundred feet. As they learn how to compile and understand more data patterns, crime detecting will become more accurate.


Using their data the Los Angeles police department was able to stop thief activity by thirty-three percent. They were also able to predict violent crime by about twenty-one percent. Those are not perfect numbers, but they are better than before and will get even more impressive as time goes on. 


The fact that data mining is able to pick up on crime statistics and compile all of that data to give an accurate picture of where crime is likely to occur is amazing. It gives a place to look and is able to help stop crime as it starts.


2. Data Mining Helps With Sales

A great story about data mining in sales is the example of Walmart putting beer near the diapers. The story claims that through measuring statistics and mining data it was found that when men purchase diapers they are also likely to buy a pack of beer. Walmart collected that data and put it to good use by putting the beer next to the diapers.


The amount of truth in that story/example is debatable, but it has made data mining popular in most retail stores. Finding which products are often bought together can give insight into where to put products in a store. This practice has increased sales in both items immensely just because people tend to purchase items near one another more than they would if they had to walk to get the second item. 


Putting a lot of stock in the data-gathering teams that big stores build does not always work. There have been plenty of times when data teams failed and sales plummeted. Often, the benefits outweigh the potential failure, however, and many stores now use data mining to make a lot of big decisions about their sales.


3. It’s Helping With Predicting Disease 


In 2009 Google began work to be able to predict the winter flu. Google went through the fifty million most searched words and then compared them with what the CDC was finding during the 2003-2008 flu seasons. With that information google was able to help predict the next winter flu outbreak even down to the states it hit the hardest. 


Since 2009, data mining has gotten much better at predicting disease. Since the internet is a newer invention it is still growing and data mining is still getting better. Hopefully, in the future, we will be able to predict disease breakouts quickly and accurately. 


With new data mining techniques and research in the medical field, there is hope that doctors will be able to narrow down problems in the heart. As the information grows and more data is entered the medical field gets closer to solving problems through data. It is something that is going to help cure diseases more quickly and find the root of a problem.


4. Some Data Mining Gets Ignored

Interestingly, very little of the data that companies collect from you is actually used. “Big data Companies” do not use about eighty-eight percent of the data they have. It is incredibly difficult to use all of the millions of bits of data that go through big data companies every day.


The more people that are used for data mining and the more data companies are actually able to filter through, the better the online experience will be. It might be a bit frightening to think of someone going through what you are doing online, but no one is touching any of the information that you keep private. Big data is using the information you put out into the world and using that data to come to conclusions and make the world a better place.


There is so much information being put onto the internet at all times. Twenty-four hours a week is the average amount of time a single person spends on the internet, but there are plenty of people who spend more time than that. All of that information takes a lot of people to sift through and there are not enough people in the data mining industry to currently actually go through the majority of the data being put online.


5. Too Many Data Mining Jobs

Interestingly, the data industry is booming. In general, there are an amazing amount of careers opening on the internet every day. The industry is growing so quickly that there are not enough people to fill the jobs that are being created.


The lack of talent in the industry means there is plenty of room for new people who want to go into the data mining industry. It was predicted that by 2018 there would be a shortage of 140,000 with deep analytical skills. With the lack of jobs that are being discussed, it is amazing that there is such a shortage in the data industry. 


If big data is only able to wade through less than half of the data being collected then we are wasting a resource. The more people who go into an analytics or computer career the more information we will be able to collect and utilize. There are currently more jobs than there are people in the data mining field and that needs to be corrected.


To Conclude

The data mining industry is making great strides. Big data is trying to use the information they collect to sell more things to you but also to improve the world. Also, there is something very convenient about your computer knowing the type of things you want to buy and showing you them immediately. 


Data mining has been able to help predict crime in Los Angeles and lower crime rates. It has also helped companies know what items are commonly purchased together so that stores can be organized more efficiently. Data mining has even been able to predict the outbreak of disease down to the state.


Even with so much data being ignored and so many jobs left empty, data mining is doing incredible things. The entire internet is constantly growing and the data mining is growing right along with it. As the data mining industry climbs and more people find their careers mining data the more we will learn and the more facts we will find.


Python vs R: Which Language to Choose for Deep Learning?

Data science is increasingly becoming essential for every business to operate efficiently in this modern world. This influences the processes composed together to obtain the required outputs for clients. While machine learning and deep learning sit at the core of data science, the concepts of deep learning become essential to understand as it can help increase the accuracy of final outputs. And when it comes to data science, R and Python are the most popular programming languages used to instruct the machines.

Python and R: Primary Languages Used for Deep Learning

Deep learning and machine learning differentiate based on the input data type they use. While machine learning depends upon the structured data, deep learning uses neural networks to store and process the data during the learning. Deep learning can be described as the subset of machine learning, where the data to be processed is defined in another structure than a normal one.

R is developed specifically to support the concepts and implementation of data science and hence, the support provided by this language is incredible as writing codes become much easier with its simple syntax.

Python is already much popular programming language that can serve more than one development niche without straining even for a bit. The implementation of Python for programming machine learning algorithms is very much popular and the results provided are accurate and faster than any other language. (C or Java). And because of its extended support for data science concept implementation, it becomes a tough competitor for R.

However, if we compare the charts of popularity, Python is obviously more popular among data scientists and developers because of its versatility and easier usage during algorithm implementation. However, R outruns Python when it comes to the packages offered to developers specifically expertise in R over Python. Therefore, to conclude which one of them is the best, let’s take an overview of the features and limits offered by both languages.

Python

Python was first introduced by Guido Van Rossum who developed it as the successor of ABC programming language. Python puts white space at the center while increasing the readability of the developed code. It is a general-purpose programming language that simply extends support for various development needs.

The packages of Python includes support for web development, software development, GUI (Graphical User Interface) development and machine learning also. Using these packages and putting the best development skills forward, excellent solutions can be developed. According to Stackoverflow, Python ranks at the fourth position as the most popular programming language among developers.

Benefits for performing enhanced deep learning using Python are:

  • Concise and Readable Code
  • Extended Support from Large Community of Developers
  • Open-source Programming Language
  • Encourages Collaborative Coding
  • Suitable for small and large-scale products

The latest and stable version of Python has been released as Python 3.8.0 on 14th October 2019. Developing a software solution using Python becomes much easier as the extended support offered through the packages drives better development and answers every need.

R

R is a language specifically used for the development of statistical software and for statistical data analysis. The primary user base of R contains statisticians and data scientists who are analyzing data. Supported by R Foundation for statistical computing, this language is not suitable for the development of websites or applications. R is also an open-source environment that can be used for mining excessive and large amounts of data.

R programming language focuses on the output generation but not the speed. The execution speed of programs written in R is comparatively lesser as producing required outputs is the aim not the speed of the process. To use R in any development or mining tasks, it is required to install its operating system specific binary version before coding to run the program directly into the command line.

R also has its own development environment designed and named RStudio. R also involves several libraries that help in crafting efficient programs to execute mining tasks on the provided data.

The benefits offered by R are pretty common and similar to what Python has to offer:

  • Open-source programming language
  • Supports all operating systems
  • Supports extensions
  • R can be integrated with many of the languages
  • Extended Support for Visual Data Mining

Although R ranks at the 17th position in Stackoverflow’s most popular programming language list, the support offered by this language has no match. After all, the R language is developed by statisticians for statisticians!

Python vs R: Should They be Really Compared?

Even when provided with the best technical support and efficient tools, a developer will not be able to provide quality outputs if he/she doesn’t possess the required skills. The point here is, technical skills rank higher than the resources provided. A comparison of these two programming languages is not advisable as they both hold their own set of advantages. However, the developers considering to use both together are less but they obtain maximum benefit from the process.

Both these languages have some features in common. For example, if a representative comes asking you if you lend technical support for developing an uber clone, you are directly going to decline as Python and R both do not support mobile app development. To benefit the most and develop excellent solutions using both these programming languages, it is advisable to stop comparing and start collaborating!

R and Python: How to Fit Both In a Single Program

Anticipating the future needs of the development industry, there has been a significant development to combine these both excellent programming languages into one. Now, there are two approaches to performing this: either we include R script into Python code or vice versa.

Using the available interfaces, packages and extended support from Python we can include R script into the code and enhance the productivity of Python code. Availability of PypeR, pyRserve and more resources helps run these two programming languages efficiently while efficiently performing the background work.

Either way, using the developed functions and packages made available for integrating Python in R are also effective at providing better results. Available R packages like rJython, rPython, reticulate, PythonInR and more, integrating Python into R language is very easy.

Therefore, using the development skills at their best and maximizing the use of such amazing resources, Python and R can be togetherly used to enhance end results and provide accurate deep learning support.

Conclusion

Python and R both are great in their own names and own places. However, because of the wide applications of Python in almost every operation, the annual packages offered to Python developers are less than the developers skilled in using R. However, this doesn’t justify the usability of R. The ultimate decision of choosing between these two languages depends upon the data scientists or developers and their mining requirements.

And if a developer or data scientist decides to develop skills for both- Python and R-based development, it turns out to be beneficial in the near future. Choosing any one or both to use in your project depends on the project requirements and expert support on hand.

Looking for the ‘aha moment’: An expert’s insights on process mining

Henny Selig is a specialist in process mining, with significant expertise in the implementation of process mining solutions and supporting customers with process analysis. As a Solution Owner at Signavio, Henny is also well versed in bringing Signavio Process Intelligence online for businesses of all shapes and sizes. In this interview, Henny shares her thoughts about the challenges and opportunities of process mining. 


Read this interview in German:

Im Interview mit Henny Selig zu Process Mining: “Für den Kunden sind solche Aha-Momente toll“


Henny, could you give a simple explanation of the concept of process mining?

Basically, process mining is a combination of data analysis and business process management. IT systems support almost every business process, meaning they leave behind digital traces. We extrapolate all the data from the IT systems connected to a particular process, then visualize and evaluate it with the help of data science technology.

In short, process mining builds a bridge between employees, process experts and management, allowing for a data-driven and fact-based approach to business process optimization. This helps avoid thinking in siloes, as well as enabling transparent design of handovers and process steps that cross departmental boundaries within an organization.

When a business starts to analyze their process data, what are the sorts of questions they ask? Do they have at least have some expectation about what process mining can offer?

That’s a really good question! There isn’t really a single good answer to it, as it is different for different companies. For example, there was one procurement manager, and we were presenting the complete data set to him, and it turned out there was an approval at one point, but it should have been at another. He was really surprised, but we weren’t, because we sat outside the process itself and were able to take a broader view. 

We also had different questions that the company hadn’t considered, things like what was the process flow if an order amount is below 1000 euros, and how often that occurs—just questions that seem clear to an outsider but often do not occur to process owners.

So do people typically just have an idea that something is wrong, or do they generally understand there is a specific problem in one area, and they want to dive deeper? 

There are those people who know that a process is running well, but they know a particular problem pops up repeatedly. Usually, even if people say they don’t have a particular focus or question, most of them actually do because they know their area. They already have some assumptions and ideas, but it is sometimes so deep in their mind they can’t actually articulate it.

Often, if you ask people directly how they do things, it can put pressure on them, even if that’s not the intention. If this happens, people may hide things without meaning to, because they already have a feeling that the process or workflow they are describing is not perfect, and they want to avoid blame. 

The approvals example I mentioned above is my favorite because it is so simple. We had a team who all said, over and over, “We don’t approve this type of request.” However, the data said they did–the team didn’t even know. 

We then talked to the manager, who was interested in totally different ideas, like all these risks, approvals, are they happening, how many times this, how many times that — the process flow in general. Just by having this conversation, we were able to remove the mismatch between management and the team, and that is before we even optimized the actual process itself. 

So are there other common issues or mismatches that people should be aware of when beginning their process mining initiative?

The one I often return to is that not every variation that is out of line with the target model is necessarily negative. Very few processes, apart from those that run entirely automatically, actually conform 100% to the intended process model—even when the environment is ideal. For this reason, there will always be exceptions requiring a different approach. This is the challenge in projects: finding out which variations are desirable, and where to make necessary exceptions.

So would you say that data-based process analysis is a team effort?

Absolutely! In every phase of a process mining project, all sorts of project members are included. IT makes the data available and helps with the interpretation of the data. Analysts then carry out the analysis and discuss the anomalies they find with IT, the process owners, and experts from the respective departments. Sometimes there are good reasons to explain why a process is behaving differently than expected. 

In this discussion, it is incredibly helpful to document the thought process of the team with technical means, such as Signavio Process Intelligence. In this way, it is possible to break down the analysis into individual processes and to bring the right person into the discussion at the right point without losing the thread of the discussion. Then, the next colleague who picks up the topic can then see the thread of the analysis and properly classify the results.

At the very least, we can provide some starting points. Helping people reach an “aha moment” is one of the best parts of my job!

To find out more about how process mining can help you understand and optimize your business processes, visit the Signavio Process Intelligence product page. If you would like to get a group effort started in your organization right now, why not sign up for a free 30-day trial with Signavio, today.

Multi-touch attribution: A data-driven approach

Customers shopping behavior has changed drastically when it comes to online shopping, as nowadays, customer likes to do a thorough market research about a product before making a purchase.

What is Multi-touch attribution?

This makes it really hard for marketers to correctly determine the contribution for each marketing channel to which a customer was exposed to. The path a customer takes from his first search to the purchase is known as a Customer Journey and this path consists of multiple marketing channels or touchpoints. Therefore, it is highly important to distribute the budget between these channels to maximize return. This problem is known as multi-touch attribution problem and the right attribution model helps to steer the marketing budget efficiently. Multi-touch attribution problem is well known among marketers. You might be thinking that if this is a well known problem then there must be an algorithm out there to deal with this. Well, there are some traditional models  but every model has its own limitation which will be discussed in the next section.

Types of attribution models

Most of the eCommerce companies have a performance marketing department to make sure that the marketing budget is spent in an agile way. There are multiple heuristics attribution models pre-existing in google analytics however there are several issues with each one of them. These models are:

Traditional attribution models

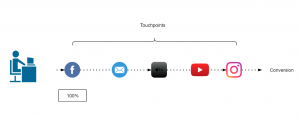
First touch attribution model

100% credit is given to the first channel as it is considered that the first marketing channel was responsible for the purchase.

Figure 1: First touch attribution model

Last touch attribution model

100% credit is given to the last channel as it is considered that the first marketing channel was responsible for the purchase.

Figure 2: Last touch attribution model

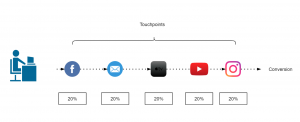
Linear-touch attribution model

In this attribution model, equal credit is given to all the marketing channels present in customer journey as it is considered that each channel is equally responsible for the purchase.

Figure 3: Linear attribution model

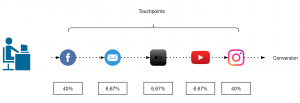
U-shaped or Bath tub attribution model

This is most common in eCommerce companies, this model assigns 40% to first and last touch and 20% is equally distributed among the rest.

Figure 4: Bathtub or U-shape attribution model

Data driven attribution models

Traditional attribution models follows somewhat a naive approach to assign credit to one or all the marketing channels involved. As it is not so easy for all the companies to take one of these models and implement it. There are a lot of challenges that comes with multi-touch attribution problem like customer journey duration, overestimation of branded channels, vouchers and cross-platform issue, etc.

Switching from traditional models to data-driven models gives us more flexibility and more insights as the major part here is defining some rules to prepare the data that fits your business. These rules can be defined by performing an ad hoc analysis of customer journeys. In the next section, I will discuss about Markov chain concept as an attribution model.

Markov chains

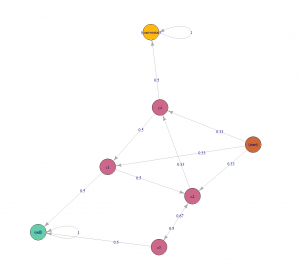
Markov chains concepts revolves around probability. For attribution problem, every customer journey can be seen as a chain(set of marketing channels) which will compute a markov graph as illustrated in figure 5. Every channel here is represented as a vertex and the edges represent the probability of hopping from one channel to another. There will be an another detailed article, explaining the concept behind different data-driven attribution models and how to apply them.

Figure 5: Markov chain example

Challenges during the Implementation

Transitioning from a traditional attribution models to a data-driven one, may sound exciting but the implementation is rather challenging as there are several issues which can not be resolved just by changing the type of model. Before its implementation, the marketers should perform a customer journey analysis to gain some insights about their customers and try to find out/perform:

  1. Length of customer journey.
  2. On an average how many branded and non branded channels (distinct and non-distinct) in a typical customer journey?
  3. Identify most upper funnel and lower funnel channels.
  4. Voucher analysis: within branded and non-branded channels.

When you are done with the analysis and able to answer all of the above questions, the next step would be to define some rules in order to handle the user data according to your business needs. Some of the issues during the implementation are discussed below along with their solution.

Customer journey duration

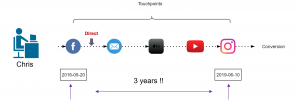
Assuming that you are a retailer, let’s try to understand this issue with an example. In May 2016, your company started a Fb advertising campaign for a particular product category which “attracted” a lot of customers including Chris. He saw your Fb ad while working in the office and clicked on it, which took him to your website. As soon as he registered on your website, his boss called him (probably because he was on Fb while working), he closed everything and went for the meeting. After coming back, he started working and completely forgot about your ad or products. After a few days, he received an email with some offers of your products which also he ignored until he saw an ad again on TV in Jan 2019 (after 3 years). At this moment, he started doing his research about your products and finally bought one of your products from some Instagram campaign. It took Chris almost 3 years to make his first purchase.

Figure 6: Chris journey

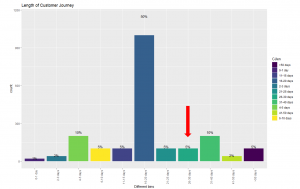
Now, take a minute and think, if you analyse the entire journey of customers like Chris, you would realize that you are still assigning some of the credit to the touchpoints that happened 3 years ago. This can be solved by using an attribution window. Figure 6 illustrates that 83% of the customers are making a purchase within 30 days which means the attribution window here could be 30 days. In simple words, it is safe to remove the touchpoints that happens after 30 days of purchase. This parameter can also be changed to 45 days or 60 days, depending on the use case.

Figure 7: Length of customer journey

Removal of direct marketing channel

A well known issue that every marketing analyst is aware of is, customers who are already aware of the brand usually comes to the website directly. This leads to overestimation of direct channel and branded channels start getting more credit. In this case, you can set a threshold (say 7 days) and remove these branded channels from customer journey.

Figure 8: Removal of branded channels

Cross platform problem

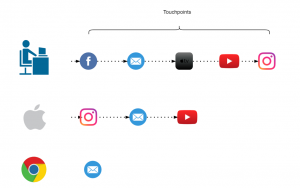
If some of your customers are using different devices to explore your products and you are not able to track them then it will make retargeting really difficult. In a perfect world these customers belong to same journey and if these can’t be combined then, except one, other paths would be considered as “non-converting path”. For attribution problem device could be thought of as a touchpoint to include in the path but to be able to track these customers across all devices would still be challenging. A brief introduction to deterministic and probabilistic ways of cross device tracking can be found here.

Figure 9: Cross platform clash

How to account for Vouchers?

To better account for vouchers, it can be added as a ‘dummy’ touchpoint of the type of voucher (CRM,Social media, Affiliate or Pricing etc.) used. In our case, we tried to add these vouchers as first touchpoint and also as a last touchpoint but no significant difference was found. Also, if the marketing channel of which the voucher was used was already in the path, the dummy touchpoint was not added.

Figure 10: Addition of Voucher as a touchpoint

Stop processing the same mistakes! Four steps to business & IT alignment

Digitization. Agility. Tech-driven. Just three strategy buzzwords that promise IT transformation and business alignment, but often fade out into merely superficial change. In fact, aligning business and IT still vexes many organizations because company leaders often forget that transformation is not a move from A to B, or even from A to Z––it’s a move from a fixed starting point, to a state of continual change.


Read this article in German:

Mit den richtigen Prozessen zum Erfolg: vier Schritte zum Business-IT Alignment


Within this state of perpetual flux, adaptive technology is necessary, not only to keep up with industry developments but also with the expansion of technology-enabled customer experiences. After all, alignment assumes that business and technology are separate entities, when in fact they are inextricably linked!

Metrics that matter: From information technology to business technology

Information technology is continuing to challenge the way companies organize their business processes, communicate with customers and potential customers, and deliver services. Although there is no single dominant reorganization strategy, common company structures lean towards decentralizing IT, shifting it closer to end-users and melding the knowledge-base with business strategy. Business-IT alignment is more than ever vital for market impact and growth.

This tactic means as business goals pivot, IT can more readily respond with permanent solutions to support and maintain enterprise momentum. In turn, technological advances and improvements are hardwired into current and future strategies and initiatives. As working ecosystems replace strict organizational structures, the traditional question “Which department do you work in?” has been replaced by, “How do you work?”

But how does IT prove its value and win the trust of the C-suite? Well, according to Gartner, almost 20% of companies have already invested in tools capable of monitoring business-relevant metrics, with this number predicted to reach 60% by 2021. The problem is many infrastructure and operations (I&O) leaders don’t know where to begin when initiating an IT monitoring strategy.

Reach beyond the everyday: Four challenges to alignment

With this, CIOs are under mounting pressure to address digital needs that grow and transform, as well as to renovate the operational environment with new functions. They also must still demonstrate how IT is meeting a given business strategy. So looking forward, no matter how big or small your business is, technology can deliver tangible and intangible benefits (like speed and performance) to hit revenue and operational targets efficiently, and meet your customers’ expectations of innovation.

Put simply, having a good technological infrastructure enriches the culture, efficiency, and relationships of your business.

Business and IT alignment: The rate of change

This continuous strategic loop means enterprises function better, make more profit, and see better ROI because they achieve their goals with less effort. And while there may be no standard way to align successfully, an organization where IT and business strategy are in lock-step can further improve agility and operational efficiencies. This battle of the ‘effs’, efficiency vs. effectiveness, has never been so critical to business survival.

In fact, successful companies are those that dive deeper; such is the importance of this synergy. Amazon and Apple are prime examples—technology and technological innovation is embedded and aligned within their operational structure. In several cases, they created the integral technology and business strategies themselves!

Convergence and Integration

These types of aligned companies have also increased the efficiency of technology investments and significantly reduced the financial and operational risks associated with business and technical change.

However, if this rate of change and business agility is as fast as we continually say, we need to be talking about convergence and integration, not just alignment. In other words, let’s do the research and learn, but empower next-level thinking so we can focus on the co-creation of “true value” and respond quickly to customers and users.

Granular strategies

Without this granular strategy, companies may spend too much on technology without ever solving the business challenges they face, simply due to differing departmental objectives, cultures, and incentives. Simply put, business-IT alignment integrates technology with the strategy, mission, and goals of an organization. For example:

  • Faster time-to-market
  • Increased profitability
  • Better customer experience
  • Improved collaboration
  • Greater industry and IT agility
  • Strategic technological transformation

Hot topic

View webinar recording Empowering Collaboration Between Business and IT, with Fabio Gammerino, Signavio Pre-Sales Consultant.

The power of process: Four steps to better business-IT alignment

While it may seem intuitive, many organizations struggle to achieve the elusive goal of business-IT alignment. This is not only because alignment is a cumbersome and lengthy process, but because the overall process is made up of many smaller sub-processes. Each of these sub-processes lacks a definitive start and endpoint. Instead, each one comprises some “learn and do” cycles that incrementally advance the overall goal.

These cycles aren’t simple fixes, and this explains why issues still exist in the modern digital world. But by establishing a common language, building internal business relationships, ensuring transparency, and developing precise corporate plans of action, the bridge between the two stabilizes.

Four steps to best position your business-IT alignment strategy:

  1. Plan: Translate business objectives into measurable IT services, so resources are effectively allocated to maximize turnover and ROI – This step requires ongoing communication between business and IT leaders.
  2. Model: IT designs infrastructure to increase business value and optimize operations – IT must understand business needs and ensure that they are implementing systems critical to business services.
  3. Manage: Service is delivered based on company objectives and expectations – IT must act as a single point-of-service request, and prioritize those requests based on pre-defined priorities.
  4. Measure: Improvement of cross-organization visibility and service level commitments – While metrics are essential, it is crucial that IT ensures a business context to what they are measuring, and keeps a clear relationship between the measured parameter and business goals.

Signavio Says

Temporarily rotating IT employees within business operations is a top strategy in reaching business-IT alignment because it circulates company knowledge. This cross-pollination encourages better relationships between the IT department and other silos and broadens skill-sets, especially for entry-level employees. Better knowledge depth gives the organization more flexibility with well-rounded employees who can fill various roles as demand arises.

Get in touch

Discover how Signavio can lead your business to IT transformation and operational excellence with the  Signavio Business Transformation Suite. Try it for yourself by registering now for a free 30-day trial.

How Data Analytics In The Cloud Transforms Your Business

Businesses have started to turn to cloud-based technology to solve their growing data problems. But before we dive deep into the reason behind it, let’s look at some reasons why data analytics is such a powerful tool. It all falls back to businesses like Netflix, Amazon, Google, and Facebook. All of these businesses are using data analytics to understand their customers and are making an absolute fortune. They also have so much data coming in that they needed to mitigate it somehow, so they turned to the cloud.

Let’s use Netflix as an example here. They have over 115 million subscribers and have become the absolute king of the online streaming industry. Their rise to the top was no fluke. They developed state-of-the-art methods of data analytics and then gathered the information needed to provide the right entertainment to the right people.

Amazon uses data to learn about its customers. They analyze all behavior on their website and then target customers based on that data.

Cloud-based technologies are designed to reduce costs associated with older data analytical methods. Businesses like Netflix, Amazon, Google, and Facebook have all started underpinning the cloud because they know it’s the future. They based their entire business models around it.

But smaller businesses still have a long way to go. Only 40% of businesses are using data as the core piece of their business strategy.

Now let’s look at some ways that data analytics has transformed business.

It Gave Birth to Strategic Analytics

Strategic analytics is the backbone of your entire data plan. It is a detailed analysis of the entire system that is used to determine how you are funneling customers into your system. It will reveal weak points and show you the strengths so that you can develop data-driven strategies moving forward. It also helps you understand the behavior of your market.

Strategic analytics follows a three-step process:

  1. Identify your business model’s strengths and weaknesses in comparison with your competition.
  2. Diagnose all of your business processes to determine areas that might need to be improved.
  3. Analyze individuals within the company to make sure you are properly using them. You would be surprised at the number of businesses wasting their employees’ talents on inefficient tasks.

At the end of it all, your business should be able to determine areas of your marketing where you can pull out more value, as well as data that you need to start gathering.

Fuel your Decisions with Platform Analytics

The goal here is to combine data analytics with your decision-making processes so that your business operates more efficiently at its very core. If money is the lifeblood of your business, then decisions are the heart that keeps that money flowing. So think of analytics as a healthy diet. It keeps every area of your business healthy and operating at peak efficiency. Platform analytics asks some important questions like:

  • How can data analytics be efficiently added to our everyday business processes?
  • Are there any areas that we can automate that will improve efficiency?
  • What will back end systems benefit from learning more about our customers?

In most cases, businesses will find that the cloud will enhance their overall data plan, no matter which point they have reached in their growth. Think of it like checking your blood pressure. If there are problems, then you know that you’ll need a diagnosis.

Helps Businesses Transform their Model

Businesses will need to use data in parallel with their model to stay caught up with the changing times as we move forward. In layman’s terms, businesses need to update their core business processes in a way so that it uses data to create opportunities. This opens up a whole new world for their customers, products, and services.

Companies that can forecast using data will see improvements across the board – from their recruitment to their marketing. But there is a specific data-centric approach that must be taken.

  • Must possess an overall vision that includes data and capitalizes on the opportunities presented.
  • Develop a culture that is centered on data and is not afraid to experiment with it.
  • Leverage new technologies to manage their data. Right now, the latest technology is cloud-based so businesses must learn to leverage it.
  • Use data to build trust with consumers.
  • Find innovative ways to gain insight into upcoming trends and tap into there as quickly as possible.

Management of Enterprise Information

Enterprise information management (known as EIM) is an important part of data-driven processes. Most data in businesses is stored in an unmanaged location like a server or some other in-house database. Cloud-based technologies have created a more secure way to store data, but you will still need a data management system in place.

By developing agile data management systems, you will be able to gather and distribute data more efficiently. EIM systems allow businesses to:

  • Streamline all of their processes in a way that simplifies everyone’s job.
  • Improve collaboration among different teams.
  • Improve the productivity of employees.

Creates a Data-Centric Business

This is the most important factor in business today, and it’s the reason why all businesses must start using the latest data analytics strategies. The more useful data a business can generate, the more of an advantage they are going to have. Again, look at leaders like Netflix and Amazon to see this in action. They are generating essential information from everyone who browses their systems. Their entire business models are centered on data, and it’s the number one reason why they are at the top of their respective industries.

Insight, optimization, and innovation are the three main categories of data analytics.

Final Thoughts

The Research Optimus Team understands that having the right data migration system is going to benefit all businesses, both large and small. It’s why their focus has turned to cloud-based technologies. Could-enabled businesses gain a competitive advantage over those who are still relying on older data technologies.

Business moves at supersonic speeds now so if you are not staying current with the latest technology, then you are going to fall behind.


Scaling Up Your Process Management

Any new business faces questions: have we found the right product/market fit? Does the business model work? Have we got enough money to keep the doors open? Typically, new businesses are focused on staying afloat, meaning anything that isn’t immediately relevant to that goal is left until later—whenever that might be!   


Read this article in German:

Machen Sie mehr aus Ihrem Prozessmanagement


However, most businesses soon realize that staying afloat means finding the most efficient way to deliver their products or services to customers. As a result, the way a business functions starts to move into focus, with managers and staff looking to achieve the same outcome, in the same way, over and over. The quickest route to this? Establishing efficient processes. 

Once a business has clarified the responsibilities of all staff, and identified their business process framework, they are better able to minimize waste and errors, avoid misunderstandings, reduce the number of questions asked during the day-to-day business, and generally operate more smoothly and at a greater pace.

Expanding your business with process management

Of course, no new business wants to remain new for long—becoming firmly established is the immediate goal, with a focus on expansion to follow, leading to new markets, new customers, and increased profitability. Effectively outlining processes takes on even more importance when companies seek to expand. Take recruitment and onboarding, for example. 

Ad hoc employment processes may work for a start-up, but a small business looking to take the next step needs to introduce new staff members frequently and ensure they have the right information to get started immediately. The solution is a documented, scalable, and repeatable process that can be carried out as many times as needed, no matter the location or the role being filled. 

When new staff are employed, they’ll need to know how their new workplace actually functions. Once again, a clear process framework means all the daily processes needed are accessible to all staff, no matter where the employee is based. As the business grows, more and more people will come on board, each with their own skills, and very likely their own ideas and suggestions about how the business could be improved… 

Collaborative process management

Capturing the wisdom of the crowd is also a crucial factor in a successful business—ensuring all employees have a chance to contribute to improving the way the company operates. In a business with an effective process modeling framework, this means providing all staff with the capability to design and model processes themselves. 

Traditionally, business process modeling is a task for the management or particular experts, but this is an increasingly outdated view. Nobody wants to pass up the valuable knowledge of individuals; after all, the more knowledge there is available about a process, the more efficiently the processes can be modeled and optimized. Using a single source of process truth for the entire organization means companies can promote collaborative and transparent working environments, leading to happier staff, more efficient work, and better overall outcomes for the business. 

Collaborative process management helps to grow organizations avoid cumbersome, time-consuming email chains, or sifting through folders for the latest version of documents, as well as any number of other hand brakes on growth. 

Instead, process content can be created and shared by anyone, any time, helping drive a company’s digital and cloud strategies, enhance investigations and process optimization efforts, and support next-gen business transformation initiatives. In short, this radical transparency can serve as the jumping-off point for the next stage of a company’s growth. 

Want to find out more about professional process management? Read our White Paper 7-Step Guide to Effective Business Transformation!

Seeing the Big Picture: Combining Enterprise Architecture with Process Management

Ever tried watching a 3D movie without those cool glasses people like to take home? Two hours of blurred flashing images is no-one’s idea of fun. But with the right equipment, you get an immersive experience, with realistic, clear, and focused images popping out of the screen. In the same way, the right enterprise architecture brings the complex structure of an organization into focus.

We know that IT environments in today’s modern businesses consist of a growing number of highly complex, interconnected, and often difficult-to-manage IT systems. Balancing customer service and efficiency imperatives associated with social, mobile, cloud, and big data technologies, along with effective day-to-day IT functions and support, can often feel like an insurmountable challenge.

Enterprise architecture can help organizations achieve this balance, all while managing risk, optimizing costs, and implementing innovations. Its main aim is to support reform and transformation programs. To do this, enterprise architecture relies on the accuracy of an enterprise’s complex data systems, and takes into account changing standards, regulations, and strategic business demands.

Components of effective enterprise architecture

In general, most widely accepted enterprise architecture frameworks consist of four interdependent domains:

  • Business Architecture

A blueprint of the enterprise that provides a common understanding of the organization, and used to align strategic objectives and tactical demands. An example would be representing business processes using business process management notation.

  • Data Architecture

The domain that shows the dependencies and connections between an organization’s data, rules, models, and standards.

  • Applications Architecture

The layer that shows a company’s complete set of software solutions and their relationships with each other.

  • Infrastructure Architecture

Positioned at the lowest level, this component shows the relationships and connections of an organization’s existing hardware solutions.

Effective EA implementation means employees within a business can build a clear understanding of the way their company’s IT systems execute their specific work processes, as well as how they interact and relate to each other. It allows users to identify and analyze application and business performance, with the goal of enabling underperforming IT systems to be promptly and efficiently managed.

In short, EA helps businesses answer questions like:

  • Which IT systems are in use, and where, and by whom?
  • Which business processes relate to which IT systems?
  • Who is responsible for which IT systems?
  • How well are privacy protection requirements upheld?
  • Which server is each application run on?

The same questions, shifted slightly to refer to business processes rather than IT systems, are what drive enterprise-level business process management as well. Is it any wonder the two disciplines go together like popcorn and a good movie?

Combining enterprise architecture with process management

Successful business/IT alignment involves effectively leveraging an organization’s IT to achieve company goals and requirements. Standardized language and images (like flow charts and graphs) are often helpful in fostering mutual understanding between highly technical IT services and the business side of an organization.

In the same way, combining EA with collaborative business process management establishes a common language throughout a company. Once this common ground is established, misunderstandings can be avoided, and the business then has the freedom to pursue organizational or technical transformation goals effectively.

At this point, strengthened links between management, IT specialists, and a process-aware workforce mean more informed decisions become the norm. A successful pairing of process management, enterprise architecture, and IT gives insight into how changes in any one area impact the others, ultimately resulting in a clearer understanding of how the organization actually functions. This translates into an easier path to optimized business processes, and therefore a corresponding improvement in customer satisfaction.

Effective enterprise architecture provides greater transparency inside IT teams, and allows for efficient management of IT systems and their respective interfaces. Along with planning continual IT landscape development, EA supports strategic development of an organization’s structure, just as process management does.

Combining the two leads to a quantum leap in the efficiency and effectiveness of IT systems and business processes, and locks them into a mutually-reinforcing cycle of optimization, meaning improvements will continue over time. Both user communities can contribute to creating a better understanding using a common tool, and the synergy created from joining EA and business process management adds immediate value by driving positive changes company-wide.

Want to find out more? Put on your 3D glasses, and test your EA initiatives with Signavio! Sign up for your free 30-day trial of the Signavio Business Transformation Suite today.

AI For Advertisers: How Data Analytics Can Change The Maths Of Advertising?

All Images Credit: Freepik

The task of understanding a customer’s journey and designing your marketing strategy accordingly can be difficult in this data-driven world. Today, the customer expresses their needs in myriad forms of requests.

Consumers express their needs and want attitudes, and values in various forms through search, comments, blogs, Tweets, “likes,” videos, and conversations and access such data across many channels like web, mobile, and face to face. Volume, variety, velocity and veracity of the data accumulated through these customer interactions are huge.

BigData and data analytics can be leveraged to understand several phases of the customer journey. There are risks involved in using Artificial Intelligence for the marketing data analysis of data breach and even manipulation. But, AI do have brighter prospects when it comes to marketing and advertiser applications.

As the CEO of a technology firm Chop Dawg and marketer, Joshua Davidson puts it, “AI-powered apps are going to be the future for us, and there are several industries that are ripe for this.” The mobile-first strategy of many enterprises has powered the use of AI for digital marketing and developing technologies and innovations to power industries with intelligent systems.

How AI and Machine learning are affecting customer journeys?

Any consumer journey begins with the recognition of a problem and then stages like initial consideration, active evaluation, purchase, and postpurchase come through up till the consumer journey is over. The need for identifying the purchasing and need patterns of the consumers and finding the buyer personas to strategize the marketing for them.

Need and Want Recognition:

Identifying a need is quite difficult as it is the most initial level of a consumer’s journey and it is more on the category level than at a brand level. Marketers and advertisers are relying on techniques like market research, web analytics, and data mining to build consumer profiles and buyer’s persona for understanding the needs and influencing the purchase of products. AI can help identify these wants and needs in real-time as the consumers usually express their needs and wants online and help build profiles more quickly.

AI technologies offered by several firms help in consumer profiling. Firms like Microsoft offers Azure that crunches billions of data points in seconds to determine the needs of consumers. It then personalizes web content on specific platforms in real-time to align with those status-updates. Consumer digital footprints are evolving through social media status updates, purchasing behavior, online comments and posts. Ai tends to update these profiles continuously through machine learning techniques.

Initial Consideration:

A key objective of advertising is to insert a brand into the consideration set of the consumers when they are looking for deliberate offerings. Advertising includes increasing the visibility of brands and emphasize on the key reasons for consideration. Advertisers currently use search optimization, paid search advertisements, organic search, or advertisement retargeting for finding the consideration and increase the probability of consumer consideration.

AI can leverage machine learning and data analytics to help with search, identify and rank functions of consumer consideration that can match the real-time considerations at any specific time. Take an example of Google Adwords, it analyzes the consumer data and helps advertisers make clearer distinctions between qualified and unqualified leads for better targeting.

Google uses AI to analyze the search-query data by considering, not only the keywords but also context words and phrases, consumer activity data and other BigData. Then, Google identifies valuable subsets of consumers and more accurate targeting.

Active Evaluation: 

When consumers narrow it down to a few choices of brands, advertisers need to insert trust and value among the consumers for brands. A common technique is to identify the higher purchase consumers and persuade them through persuasive content and advertisement. AI can support these tasks using some techniques:

Predictive Lead Scoring: Predictive lead scoring by leveraging machine learning techniques of predictive analytics to allow marketers to make accurate predictions related to the intent of purchase for consumers. A machine learning algorithm runs through a database of existing consumer data, then recognize trends and patterns and after processing the external data on consumer activities and interests, creates robust consumer profiles for advertisers.

Natural Language Generation: By leveraging the image, speech recognition and natural language generation, machine learning enables marketers to curate content while learning from the consumer behavior in real-time scenarios and adjusts the content according to the profiles on the fly.

Emotion AI: Marketers use emotion AI to understand consumer sentiment and feel about the brand in general. By tapping into the reviews, blogs or videos they understand the mood of customers. Marketers also use emotion AI to pretest advertisements before its release. The famous example of Kelloggs, which used emotion AI to help devise an advertising campaign for their cereal, eliminating the advertisement executions whenever the consumer engagement dropped.

Purchase: 

As the consumers decide which brands to choose and what it’s worth, advertising aims to move them out of the decision process and push for the purchase by reinforcing the value of the brand compared with its competition.

Advertisers can insert such value by emphasizing convenience and information about where to buy the product, how to buy the product and reassuring the value through warranties and guarantees. Many marketers also emphasize on rapid return policies and purchase incentives.

AI can completely change the purchase process through dynamic pricing, which encompasses real-time price adjustments on the basis of information such as demand and other consumer-behavior variables, seasonality, and competitor activities.

Post-Purchase: 

Aftersales services can be improved through intelligent systems using AI technologies and machine learning techniques. Marketers and advertisers can hire dedicated developers to design intelligent virtual agents or chatbots that can reinforce the value and performance of a brand among consumers.

Marketers can leverage an intelligent technique known as Propensity modeling to identify the most valuable customers on the basis of lifetime value, likelihood of reengagement, propensity to churn, and other key performance measures of interest. Then advertisers can personalize their communication with these customers on the basis of these data.

Conclusion:

AI has shifted the focus of advertisers and marketers towards the customer-first strategies and enhanced the heuristics of customer engagement. Machine learning and IoT(Internet of Things) has already changed the way customer interact with the brands and this transition has come at a time when advertisers and marketers are looking for new ways to tap into the customer mindset and buyer’s persona.

All Images Credit: Freepik

Best machine learning algorithms you should know

Machine learning is a key technology tool businesses use to build tools that enhance their operations. To do that, they take advantage of machine learning algorithms that come in different shapes and sizes, servicing different purposes and working on different data sets. Choosing the right algorithm for the job is what makes machine learning and deep learning projects successful. That’s why being aware of all the different types of machine learning algorithms is so important – that’s how you get better results and build more advanced solutions.

Here’s an overview of the best machine learning algorithms you should know before starting your project.

What is meant by machine learning algorithms?

First things first, what is machine learning and how do algorithms fit into the picture? A machine learning (ML) algorithm is a process or set of procedures that allow a model to adapt to the data with a specific objective set as the goal.

An ML algorithm specifies how the data is transformed from the input to output, helping the model to learn the appropriate mapping from input to output. That model specifies the mapping functions and holds the parameters in place, while the machine learning algorithm updates the parameters to help the model match its goal.

What are the algorithms used in machine learning?

Algorithms can model problems in many different ways. The easiest way to differentiate between different ML algorithms is by comparing them by learning styles that they can adapt. Generally, machine learning algorithms can adapt to several learning styles that help to solve different problems.

Here are four learning styles in machine learning you need to know:

1 Supervised learning

In supervised learning, the input data serves as training data and comes with a known label or result – for example, the price at a time or spam/not-spam.

In this variant, the training process is critical for preparing a model that makes predictions and then is corrected when the predictions are wrong. The training process continues until the model achieves the appropriate level of accuracy. Classification and regression are examples of problems for this learning type.


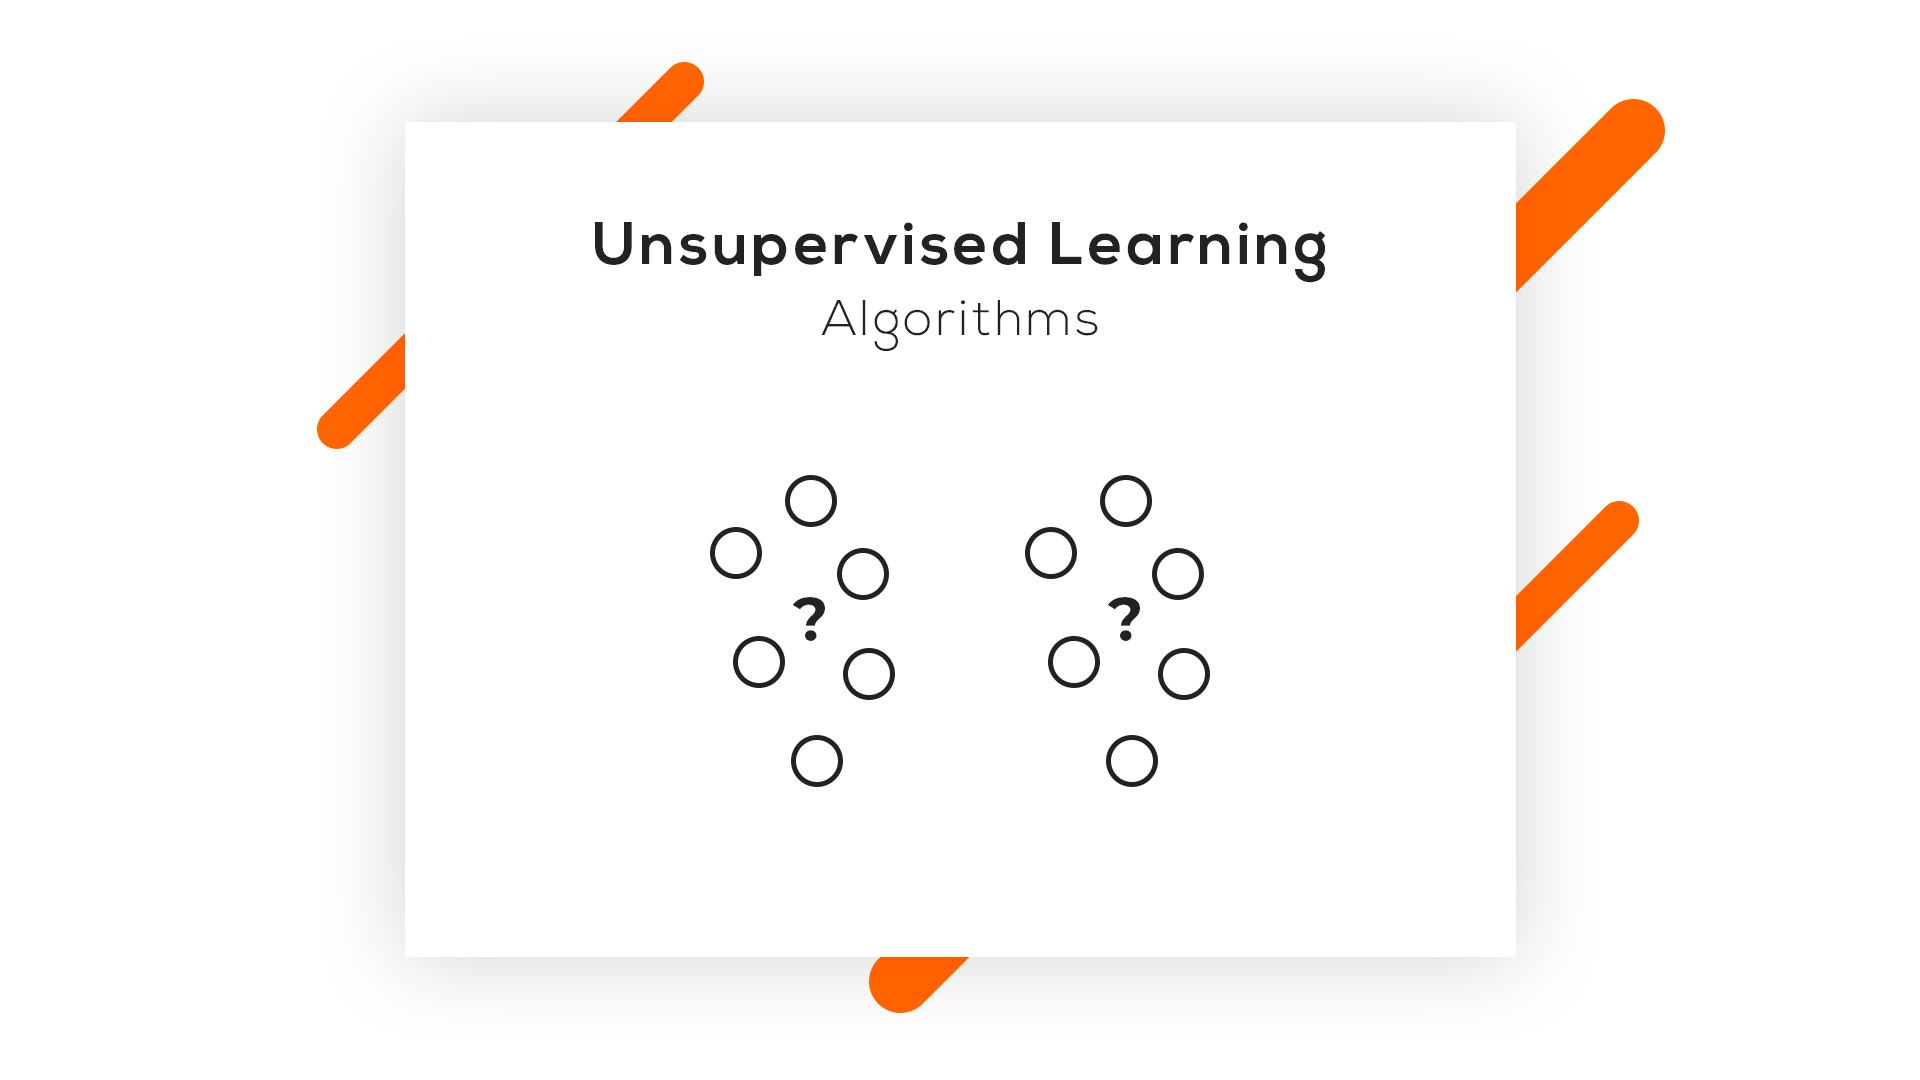
2 Unsupervised learning

In unsupervised learning, input data isn’t labeled and doesn’t come with a known result. Data scientists prepare models by deducing the structures in the input data to extract general rules or reduce redundancy through mathematical processes. Unsupervised learning addresses problems such as association rule learning, dimensionality reduction, and clustering.

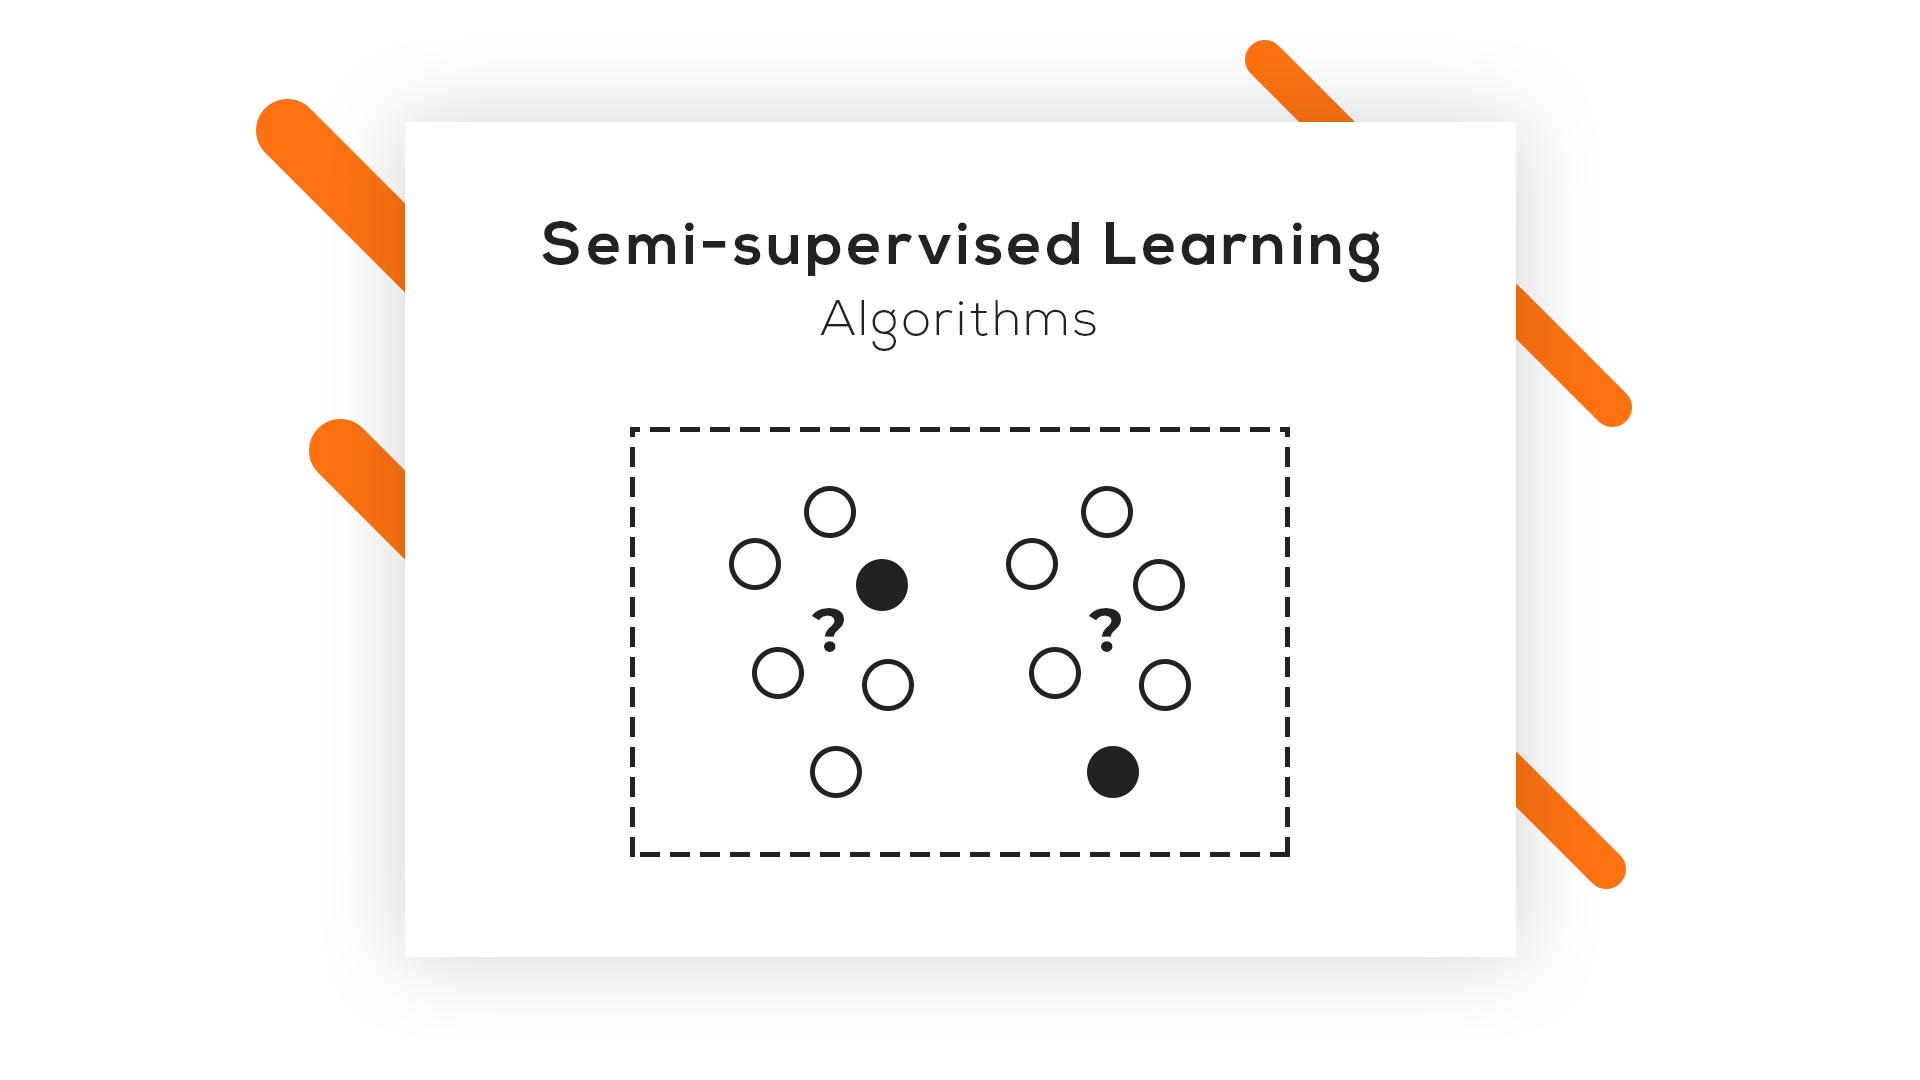
3 Semi-supervised learning

In this learning style, the input data is a mixture of labeled and unlabeled examples. The prediction problem is known, but the model needs to learn the structures for organizing data and making predictions on its own. This learning style is used to address problems such as regression and classification.

4 Reinforcement learning

One of three basic machine learning paradigms together with supervised learning and unsupervised learning, reinforcement learning (RL) is an area of machine learning that focuses on the ways in which software agents should take actions to maximize a specified notion of cumulative reward in a given environment.

The best machine learning algorithms you should know

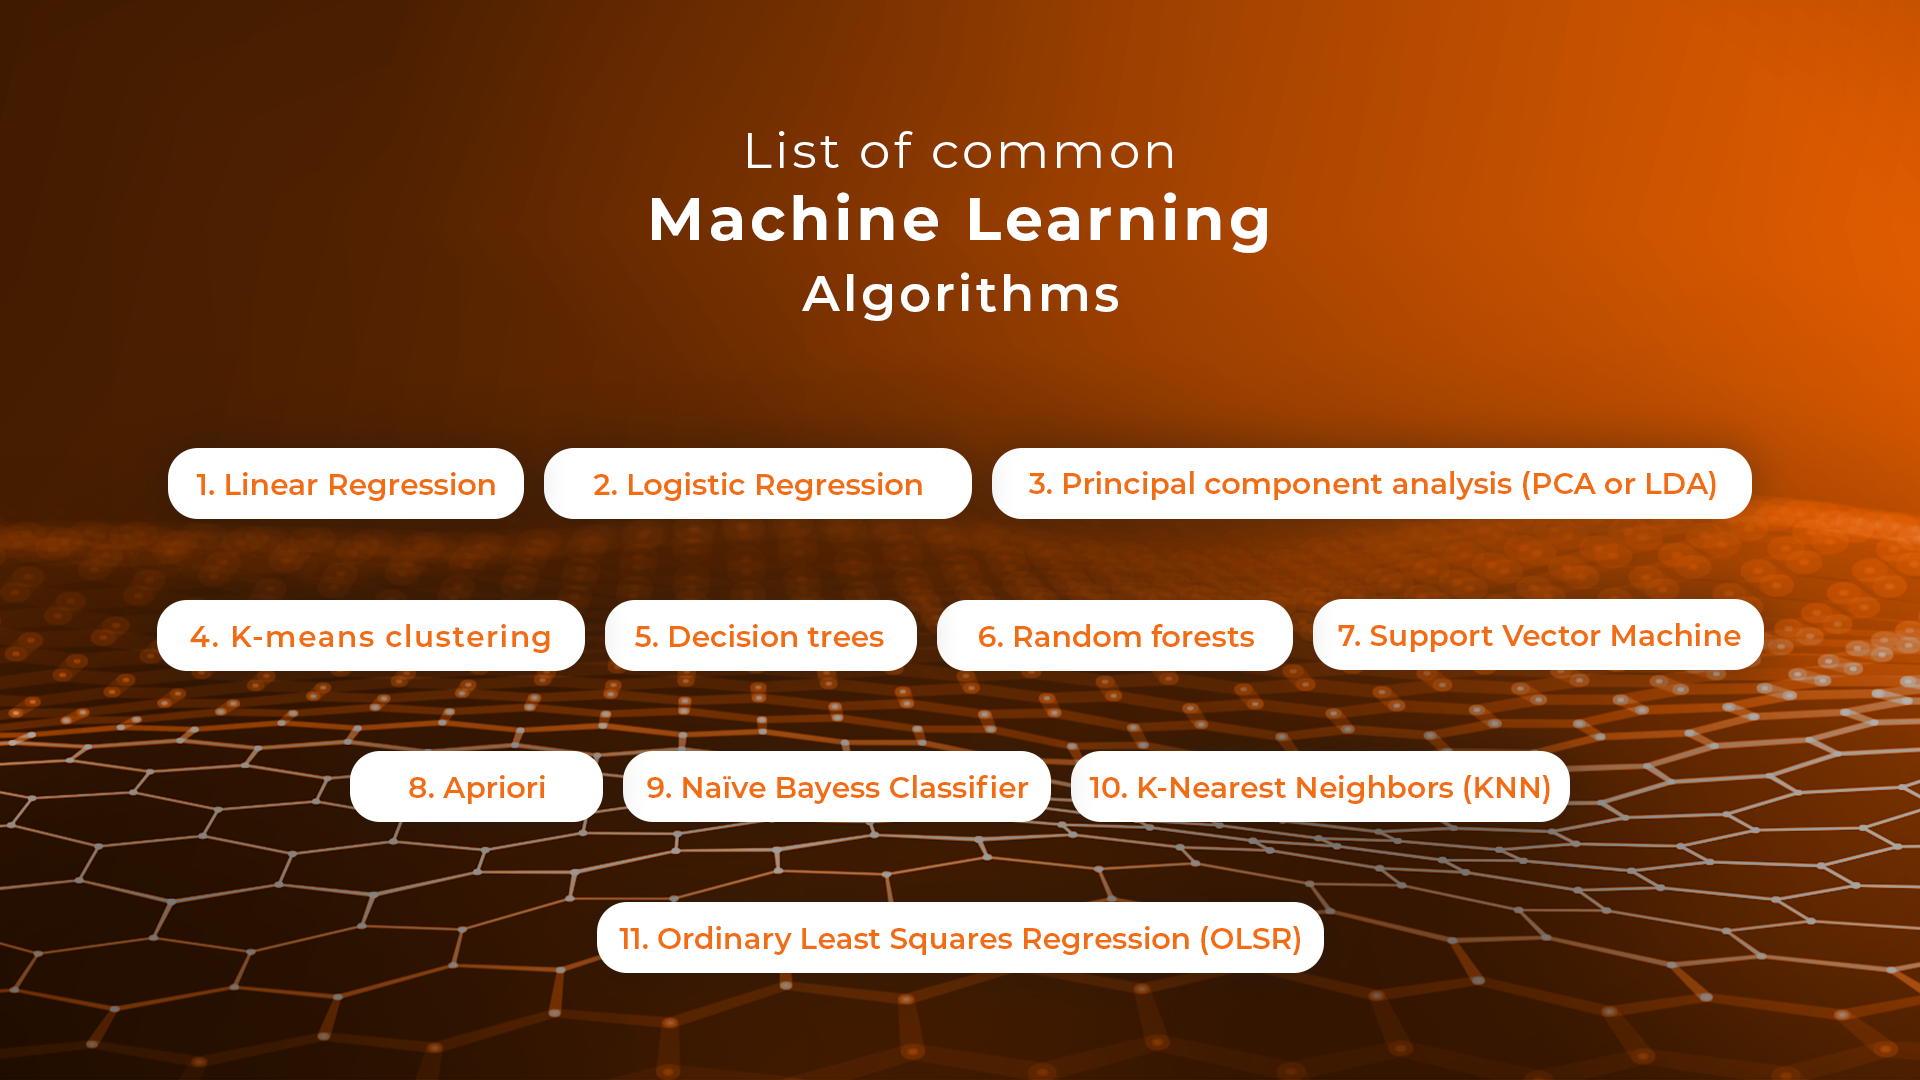
1 Linear Regression

Linear regression is an algorithm that correlates between two variables in the data set, examining the input and output sets to show a relationship between them. For example, the algorithm can show how changing one of the input variables affects the other variable. The relationship is represented by plotting a line on the graph.

Linear regression is one of the most popular algorithms in machine learning because it’s transparent and requires no tuning to work. Practical applications of this algorithm are risk assessment or sales forecasting solutions.

2 Logistic regression

Logistic regression is a type of constrained Linear Regression with a non-linearity application after you apply weights. Note that this algorithm is used for classification, not regression. The algorithm restricts the outputs close to +/- classes (and 1 and 0 in the case of sigmoid) and can be trained with Gradient Descent or L-BFGS.

Logistic regression is used in Natural Language Processing (NLP) applications, where it often appears under the name of Maximum Entropy Classifier.

3 Principal component analysis (PCA or LDA)

Principal component analysis is an unsupervised method that helps data scientists to understand better the global properties of a data set that consists of vectors. It analyzes the covariance matrix of data points to learn which dimensions/data points have high variance among themselves and low covariance with others. The algorithm helps data scientists to get data points with reduced dimensions.

4 K-means clustering

K- means clustering is a type of unsupervised clustering algorithm that sorts data sets through defined clusters. It offers results in the form of groups based on internal patterns.

For example, you can use a K-means algorithm for sorting web results for the word “cat,” and it will show all the results in the form of groups. The main advantage of this algorithm is its accuracy as it provides data groupings faster than other algorithms.


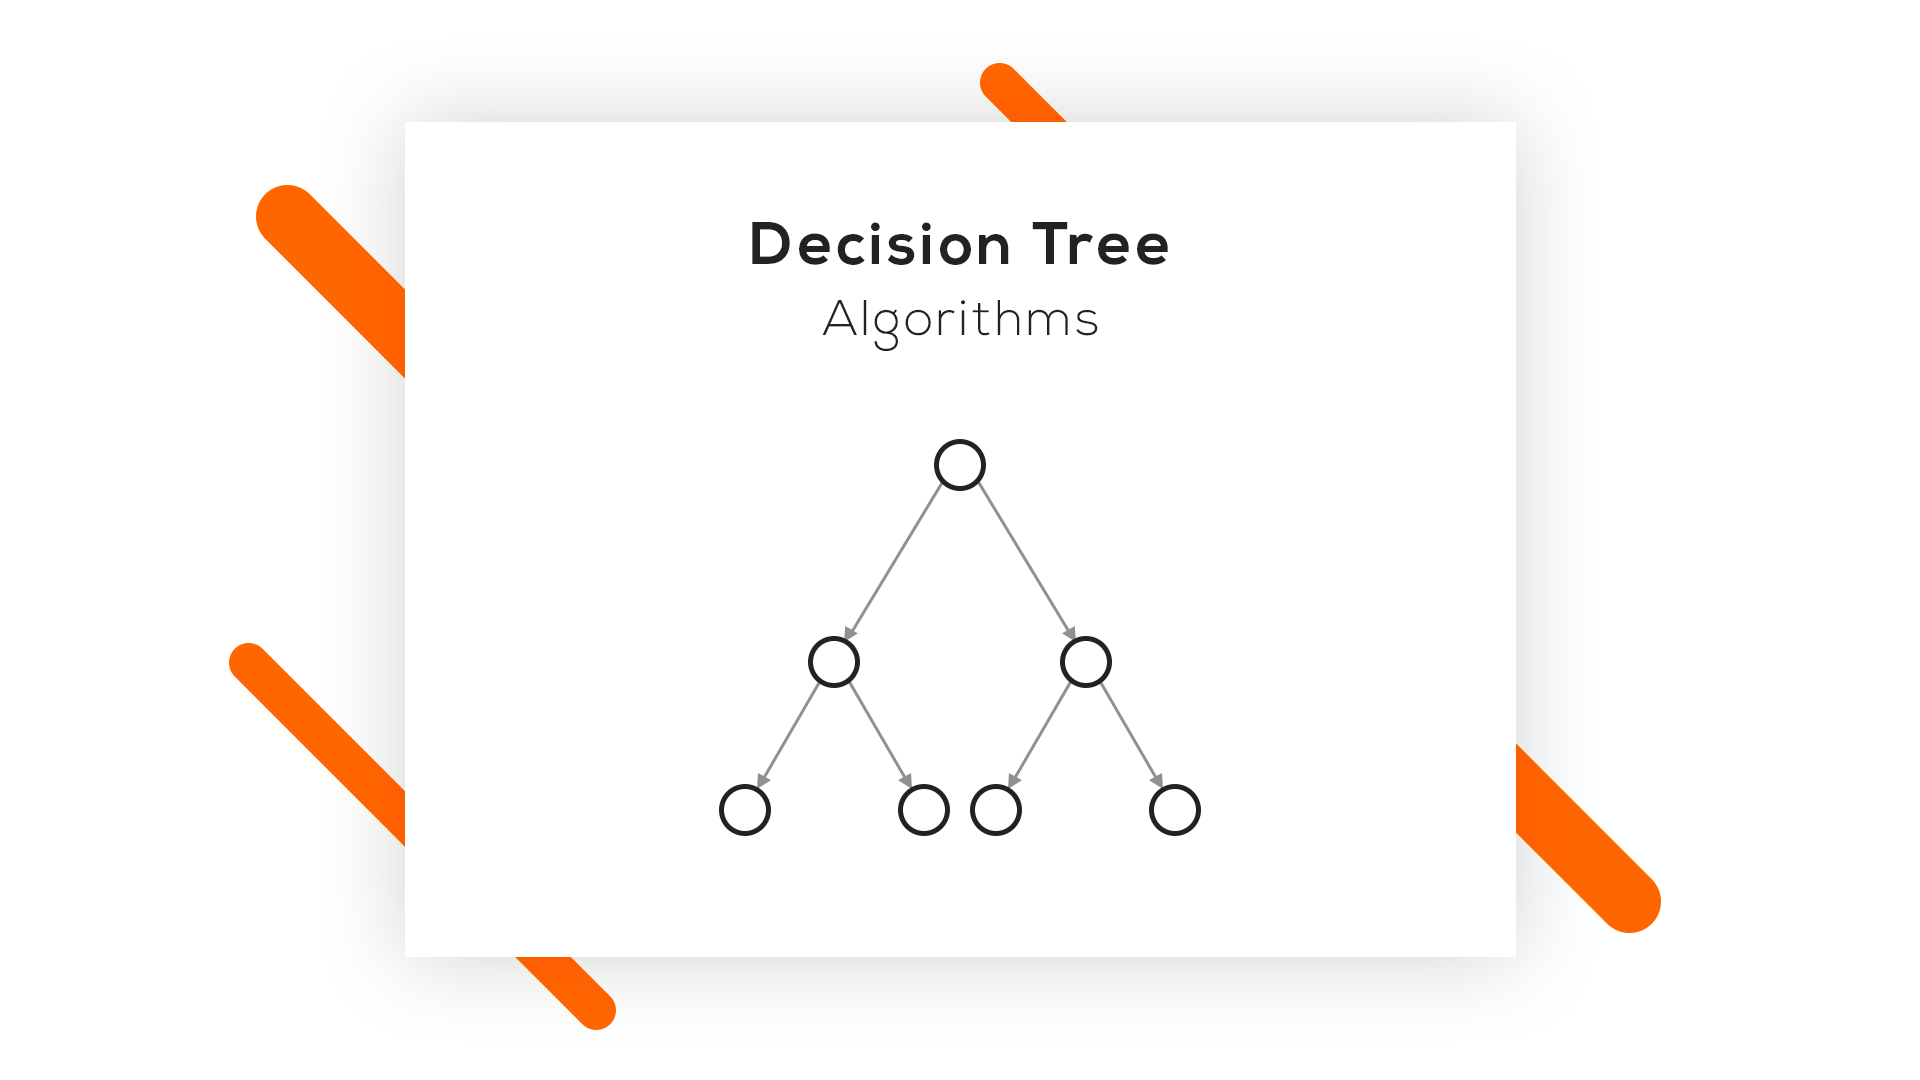
5 Decision trees

A decision tree is made of various branches that represent the outcome of many decisions. This algorithm collects and graphs data in multiple branches to predict response variables on the basis of past decisions. It comes in handy for mapping our decisions and presents results visually to communicate findings easily.

Decision trees work best for smaller data sets and relatively low-stake decisions – otherwise, the long-tail visuals can be hard to decipher. The key advantage of this algorithm is that it allows showing multiple outcomes and tests without having to involve data scientists – it’s easy to use.

6 Random forests

A random forest consists of a great number of individual decision trees where they all operate as an ensemble. An individual tree in the random forest generates a class prediction – the class which receives the highest number of votes becomes the model’s prediction. Having many relatively uncorrelated models (trees) operating as a committee easily outperforms individual constituent models.

The low correlation between these models is the strength of this approach because it allows producing ensemble predictions that are far more accurate than individual predictions. Note that decisions trees protect each other from individual errors. While some trees may generate false predictions, others will generate the right ones – as a group; they will be able to move in the right direction.

7 Support Vector Machine

Support Vector Machines (SVMs) are linear models similar to linear or logistic regression we’ve discussed earlier. However, there’s one difference – they have a different margin-based loss function, which can be optimized by using methods such as L-BFGS or SGD. SVMs internally analyze data sets into classes, which is helpful for future classifications.

The main idea behind SVM is separating data into classes and maximizing the margins of entering future data into classes. This type of algorithm works best for training data. However, it can also serve as a tool for processing nonlinear data. The financial sector makes use of Support Vector Machines thanks to its accuracy in classifying both current and future data sets.

8 Apriori

The Apriori algorithm is used a lot in market analysis. It’s based on the principle of Apriori and checks for positive and negative correlations between products after analyzing values in data sets.

For example, if two values often correlate in a data set, the algorithm will conclude that A will often lead to B, referring to the information in data sets. For example, if customers often buy product A and product B together, this relation will hold a high percentage and help companies like Google or Amazon to predict product searches and purchases.

9 Naive Bayes Classifier

This handy classification technique is based on Bayes’ Theorem, which assumes independence among predictors. The algorithm will assume that the presence of a specific feature in a class is not related to the presence of any other feature in the same class.

For example, a fruit may be considered a banana if it’s yellow, curved, and about 15 cm long. These features depend on each other, and on the existence of hooter features, they all independently contribute to the probability that this fruit is a banana. That’s why the algorithm bears the name “Naive.”

The algorithm offers a model that is easy to build and helpful in handling very large data sets. It can outperform the most sophisticated classification methods.

10 K-Nearest Neighbors (KNN)

This is one of the simplest algorithm types used in machine learning for classification and regression. KNN algorithms classify new data points on the basis of similarity measures, such as the distance function. They perform classification by using a majority vote of the data points’ neighbors. They then assign data to the class, which has the nearest neighbors. Together with increasing the number of nearest neighbors (the value of k), the accuracy may increase as well.

11 Ordinary Least Squares Regression (OLSR)

Ordinary Least Squares Regression (OLSR) is a generalized linear modeling technique data scientists use for estimating unknown parameters that are part of a linear regression model. OLSR describes the relationship between a dependent variable and one or more of its independent variables.

The algorithm is applied in diverse fields such as economics, finance, medicine, and social sciences. Companies use it in machine learning and predictive analytics to dynamically predict specific outcomes on the basis of variables that change dynamically.

We hope that this machine learning algorithms list helps you pick the right tools of the trade for your next machine learning project. If you’d like to learn more about Machine Learning, Data Science and Web Development, visit the Sunscrapers company blog.