Simple RNN

Understanding LSTM forward propagation in two ways

*This article is only for the sake of understanding the equations in the second page of the paper named “LSTM: A Search Space Odyssey”. If you have no trouble understanding the equations of LSTM forward propagation, I recommend you to skip this article and go the the next article.

1. Preface

I  heard that in Western culture, smart people write textbooks so that other normal people can understand difficult stuff, and that is why textbooks in Western countries tend to be bulky, but also they are not so difficult as they look. On the other hand in Asian culture, smart people write puzzling texts on esoteric topics, and normal people have to struggle to understand what noble people wanted to say. Publishers also require the authors to keep the texts as short as possible, so even though the textbooks are thin, usually students have to repeat reading the textbooks several times because usually they are too abstract.

Both styles have cons and pros, and usually I prefer Japanese textbooks because they are concise, and sometimes it is annoying to read Western style long texts with concrete straightforward examples to reach one conclusion. But a problem is that when it comes to explaining LSTM, almost all the text books are like Asian style ones. Every study material seems to skip the proper steps necessary for “normal people” to understand its algorithms. But after actually making concrete slides on mathematics on LSTM, I understood why: if you write down all the equations on LSTM forward/back propagation, that is going to be massive, and actually I had to make 100-page PowerPoint animated slides to make it understandable to people like me.

I already had a feeling that “Does it help to understand only LSTM with this precision? I should do more practical codings.” For example François Chollet, the developer of Keras, in his book, said as below.


For me that sounds like “We have already implemented RNNs for you, so just shut up and use Tensorflow/Keras.” Indeed, I have never cared about the architecture of my Mac Book Air, but I just use it every day, so I think he is to the point. To make matters worse, for me, a promising algorithm called Transformer seems to be replacing the position of LSTM in natural language processing. But in this article series and in my PowerPoint slides, I tried to explain as much as possible, contrary to his advice.

But I think, or rather hope,  it is still meaningful to understand this 23-year-old algorithm, which is as old as me. I think LSTM did build a generation of algorithms for sequence data, and actually Sepp Hochreiter, the inventor of LSTM, has received Neural Network Pioneer Award 2021 for his work.

I hope those who study sequence data processing in the future would come to this article series, and study basics of RNN just as I also study classical machine learning algorithms.

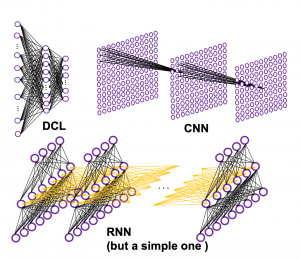
 *In this article “Densely Connected Layers” is written as “DCL,” and “Convolutional Neural Network” as “CNN.”

2. Why LSTM?

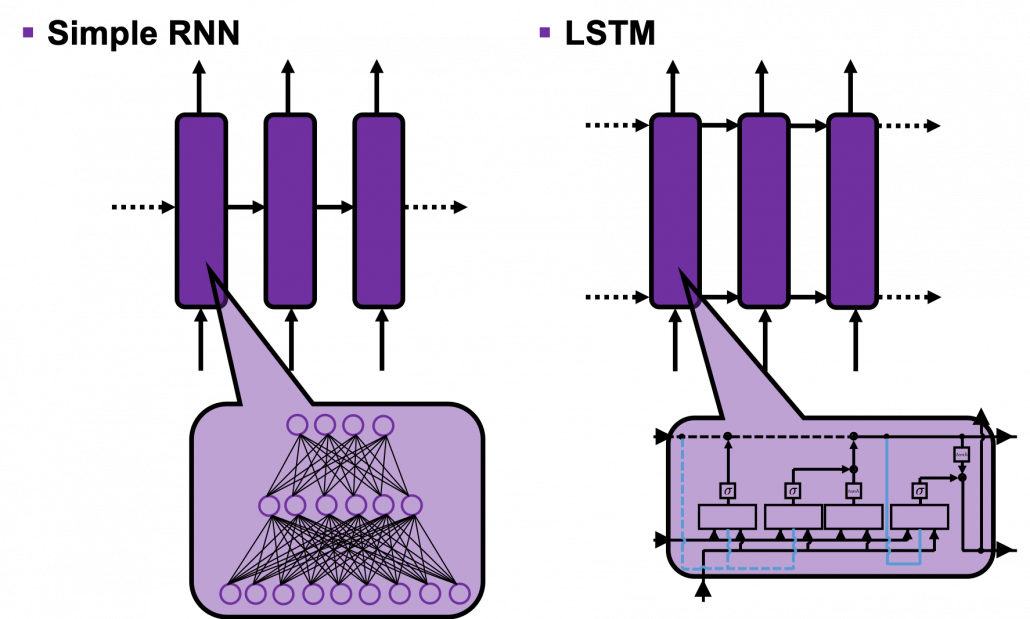
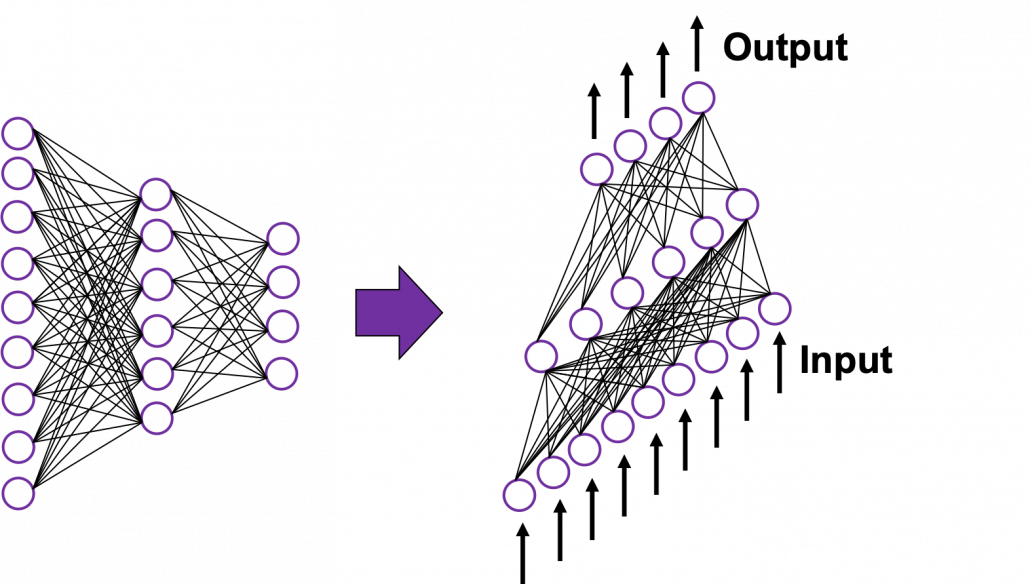
First of all, let’s take a brief look at what I said about the structures of RNNs,  in the first and the second article. A simple RNN is basically densely connected network with a few layers. But the RNN gets an input every time step, and it gives out an output at the time step. Part of information in the middle layer are succeeded to the next time step, and in the next time step, the RNN also gets an input and gives out an output. Therefore, virtually a simple RNN behaves almost the same way as densely connected layers with many layers during forward/back propagation if you focus on its recurrent connections.
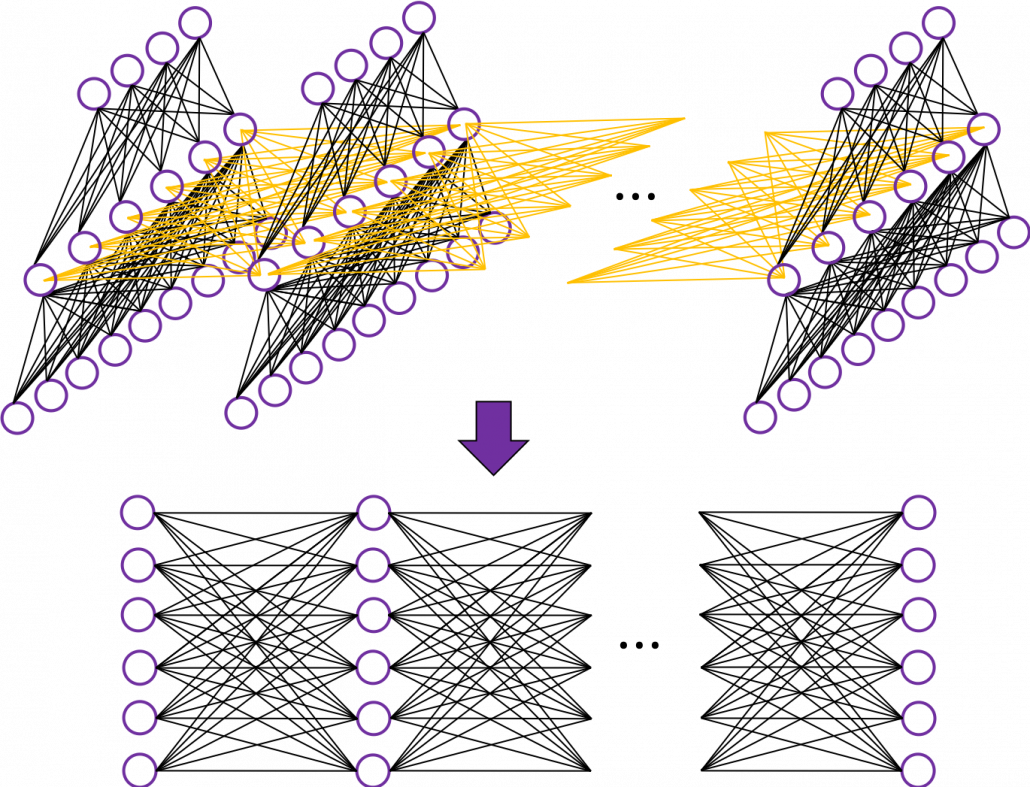
That is why simple RNNs suffer from vanishing/exploding gradient problems, where the information exponentially vanishes or explodes when its gradients are multiplied many times through many layers during back propagation. To be exact, I think you need to consider this problem precisely like you can see in this paper. But for now, please at least keep it in mind that when you calculate a gradient of an error function with respect to parameters of simple neural networks, you have to multiply parameters many times like below, and this type of calculation usually leads to vanishing/exploding gradient problem.

LSTM was invented as a way to tackle such problems as I mentioned in the last article.

3. How to display LSTM

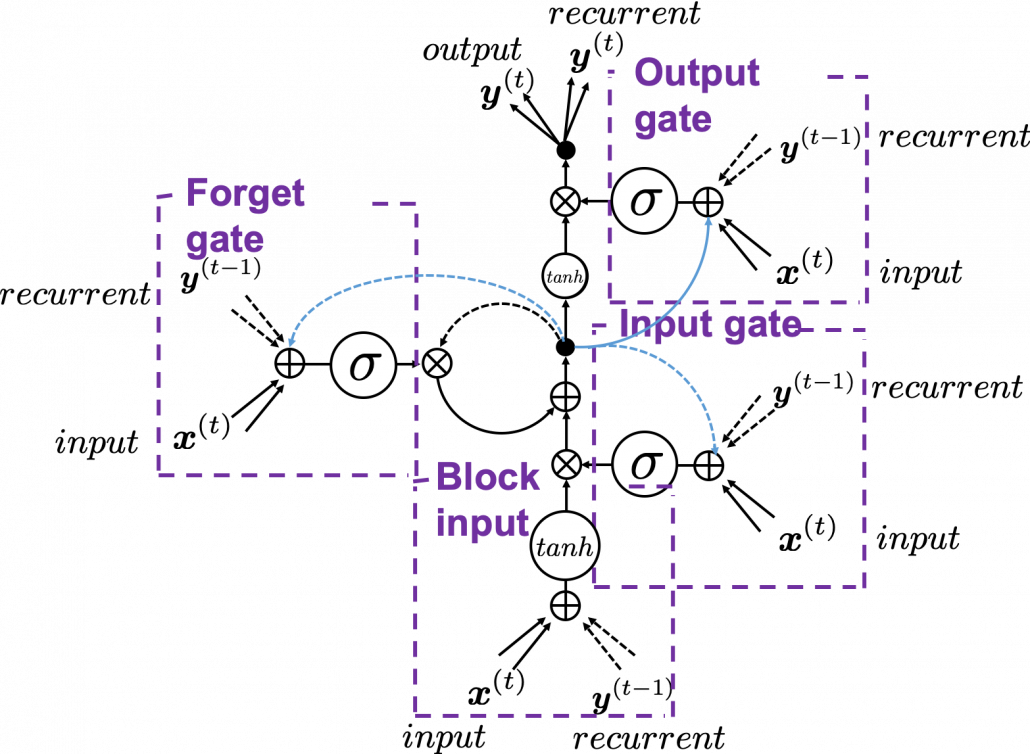
I would like you to just go to image search on Google, Bing, or Yahoo!, and type in “LSTM.” I think you will find many figures, but basically LSTM charts are roughly classified into two types: in this article I call them “Space Odyssey type” and “electronic circuit type”, and in conclusion, I highly recommend you to understand LSTM as the “electronic circuit type.”

*I just randomly came up with the terms “Space Odyssey type” and “electronic circuit type” because the former one is used in the paper I mentioned, and the latter one looks like an electronic circuit to me. You do not have to take how I call them seriously.

However, not that all the well-made explanations on LSTM use the “electronic circuit type,” and I am sure you sometimes have to understand LSTM as the “space odyssey type.” And the paper “LSTM: A Search Space Odyssey,” which I learned a lot about LSTM from,  also adopts the “Space Odyssey type.”

LSTM architectur visualization

The main reason why I recommend the “electronic circuit type” is that its behaviors look closer to that of simple RNNs, which you would have seen if you read my former articles.

*Behaviors of both of them look different, but of course they are doing the same things.

If you have some understanding on DCL, I think it was not so hard to understand how simple RNNs work because simple RNNs  are mainly composed of linear connections of neurons and weights, whose structures are the same almost everywhere. And basically they had only straightforward linear connections as you can see below.

But from now on, I would like you to give up the ideas that LSTM is composed of connections of neurons like the head image of this article series. If you do that, I think that would be chaotic and I do not want to make a figure of it on Power Point. In short, sooner or later you have to understand equations of LSTM.

4. Forward propagation of LSTM in “electronic circuit type”

*For further understanding of mathematics of LSTM forward/back propagation, I recommend you to download my slides.

The behaviors of an LSTM block is quite similar to that of a simple RNN block: an RNN block gets an input every time step and gets information from the RNN block of the last time step, via recurrent connections. And the block succeeds information to the next block.

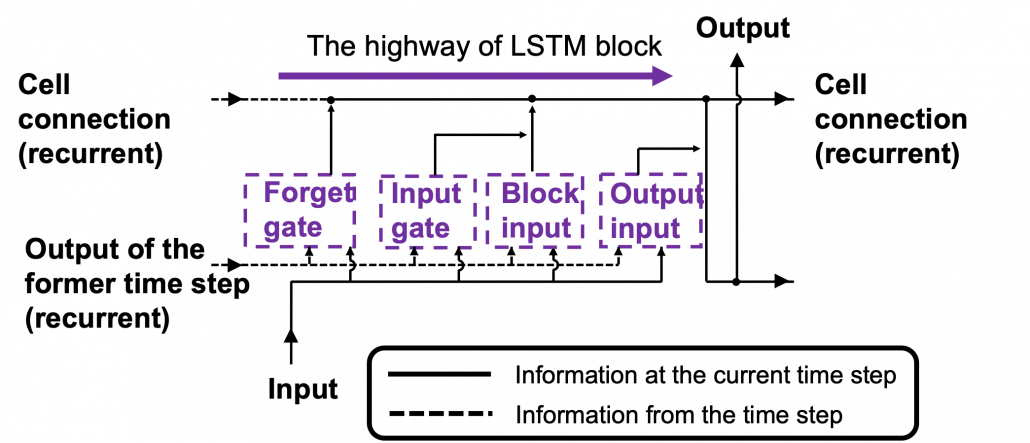
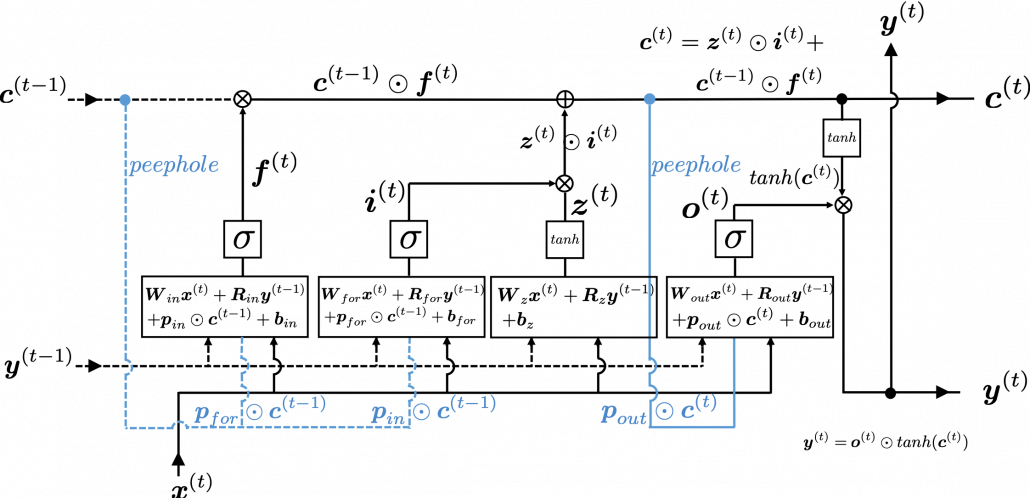
Let’s look at the simplified architecture of  an LSTM block. First of all, you should keep it in mind that LSTM have two streams of information: the one going through all the gates, and the one going through cell connections, the “highway” of LSTM block. For simplicity, we will see the architecture of an LSTM block without peephole connections, the lines in blue. The flow of information through cell connections is relatively uninterrupted. This helps LSTMs to retain information for a long time.

In a LSTM block, the input and the output of the former time step separately go through sections named “gates”: input gate, forget gate, output gate, and block input. The outputs of the forget gate, the input gate, and the block input join the highway of cell connections to renew the value of the cell.

*The small two dots on the cell connections are the “on-ramp” of cell conection highway.

*You would see the terms “input gate,” “forget gate,” “output gate” almost everywhere, but how to call the “block gate” depends on textbooks.

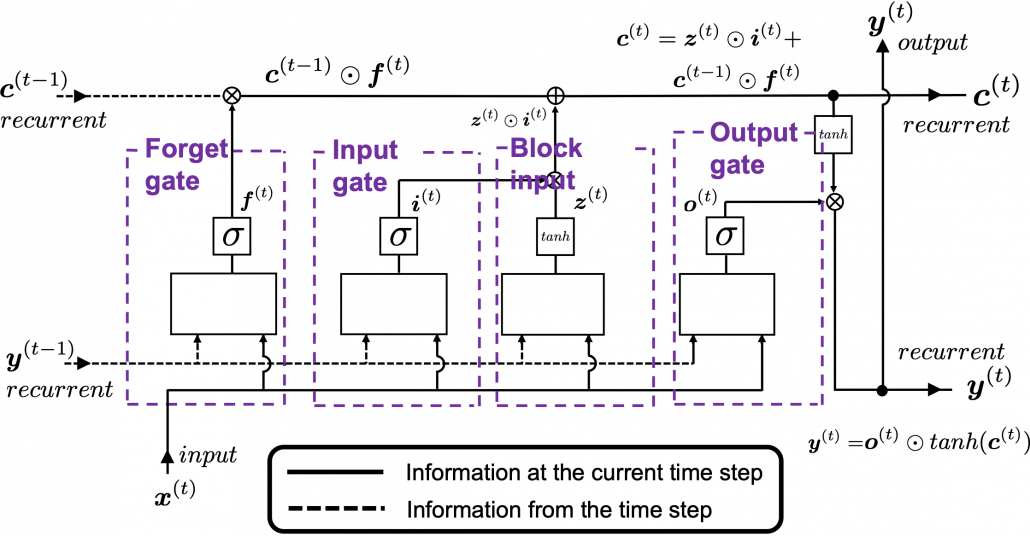
Let’s look at the structure of an LSTM block a bit more concretely. An LSTM block at the time step (t) gets \boldsymbol{y}^{(t-1)}, the output at the last time step,  and \boldsymbol{c}^{(t-1)}, the information of the cell at the time step (t-1), via recurrent connections. The block at time step (t) gets the input \boldsymbol{x}^{(t)}, and it separately goes through each gate, together with \boldsymbol{y}^{(t-1)}. After some calculations and activation, each gate gives out an output. The outputs of the forget gate, the input gate, the block input, and the output gate are respectively \boldsymbol{f}^{(t)}, \boldsymbol{i}^{(t)}, \boldsymbol{z}^{(t)}, \boldsymbol{o}^{(t)}. The outputs of the gates are mixed with \boldsymbol{c}^{(t-1)} and the LSTM block gives out an output \boldsymbol{y}^{(t)}, and gives \boldsymbol{y}^{(t)} and \boldsymbol{c}^{(t)} to the next LSTM block via recurrent connections.

You calculate \boldsymbol{f}^{(t)}, \boldsymbol{i}^{(t)}, \boldsymbol{z}^{(t)}, \boldsymbol{o}^{(t)} as below.

  • \boldsymbol{f}^{(t)}= \sigma(\boldsymbol{W}_{for} \boldsymbol{x}^{(t)} + \boldsymbol{R}_{for} \boldsymbol{y}^{(t-1)} +  \boldsymbol{b}_{for})
  • \boldsymbol{i}^{(t)}=\sigma(\boldsymbol{W}_{in} \boldsymbol{x}^{(t)} + \boldsymbol{R}_{in} \boldsymbol{y}^{(t-1)} + \boldsymbol{b}_{in})
  • \boldsymbol{z}^{(t)}=tanh(\boldsymbol{W}_z \boldsymbol{x}^{(t)} + \boldsymbol{R}_z \boldsymbol{y}^{(t-1)} + \boldsymbol{b}_z)
  • \boldsymbol{o}^{(t)}=\sigma(\boldsymbol{W}_{out} \boldsymbol{x}^{(t)} + \boldsymbol{R}_{out} \boldsymbol{y}^{(t-1)} + \boldsymbol{b}_{out})

*You have to keep it in mind that the equations above do not include peephole connections, which I am going to show with blue lines in the end.

The equations above are quite straightforward if you understand forward propagation of simple neural networks. You add linear products of \boldsymbol{y}^{(t)} and \boldsymbol{c}^{(t)} with different weights in each gate. What makes LSTMs different from simple RNNs is how to mix the outputs of the gates with the cell connections. In order to explain that, I need to introduce a mathematical operator called Hadamard product, which you denote as \odot. This is a very simple operator. This operator produces an elementwise product of two vectors or matrices with identical shape.

With this Hadamar product operator, the renewed cell and the output are calculated as below.

  • \boldsymbol{c}^{(t)} = \boldsymbol{z}^{(t)}\odot \boldsymbol{i}^{(t)} + \boldsymbol{c}^{(t-1)} \odot \boldsymbol{f}^{(t)}
  • \boldsymbol{y}^{(t)} = \boldsymbol{o}^{(t)} \odot tanh(\boldsymbol{c}^{(t)})

The values of \boldsymbol{f}^{(t)}, \boldsymbol{i}^{(t)}, \boldsymbol{z}^{(t)}, \boldsymbol{o}^{(t)} are compressed into the range of [0, 1] or [-1, 1] with activation functions. You can see that the input gate and the block input give new information to the cell. The part \boldsymbol{c}^{(t-1)} \odot \boldsymbol{f}^{(t)} means that the output of the forget gate “forgets” the cell of the last time step by multiplying the values from 0 to 1 elementwise. And the cell \boldsymbol{c}^{(t)} is activated with tanh() and the output of the output gate “suppress” the activated value of \boldsymbol{c}^{(t)}. In other words, the output gatedecides how much information to give out as an output of the LSTM block. The output of every gate depends on the input \boldsymbol{x}^{(t)}, and the recurrent connection \boldsymbol{y}^{(t-1)}. That means an LSTM block learns to forget the cell of the last time step, to renew the cell, and to suppress the output. To describe in an extreme manner, if all the outputs of every gate are always (1, 1, …1)^T, LSTMs forget nothing, retain information of inputs at every time step, and gives out everything. And  if all the outputs of every gate are always (0, 0, …0)^T, LSTMs forget everything, receive no inputs, and give out nothing.

This model has one problem: the outputs of each gate do not directly depend on the information in the cell. To solve this problem, some LSTM models introduce some flows of information from the cell to each gate, which are shown as lines in blue in the figure below.

LSTM inner architecture

LSTM models, for example the one with or without peephole connection, depend on the library you use, and the model I have showed is one of standard LSTM structure. However no matter how complicated structure of an LSTM block looks, you usually cover it with a black box as below and show its behavior in a very simplified way.

5. Space Odyssey type

I personally think there is no advantages of understanding how LSTMs work with this Space Odyssey type chart, but in several cases you would have to use this type of chart. So I will briefly explain how to look at that type of chart, based on understandings of LSTMs you have gained through this article.

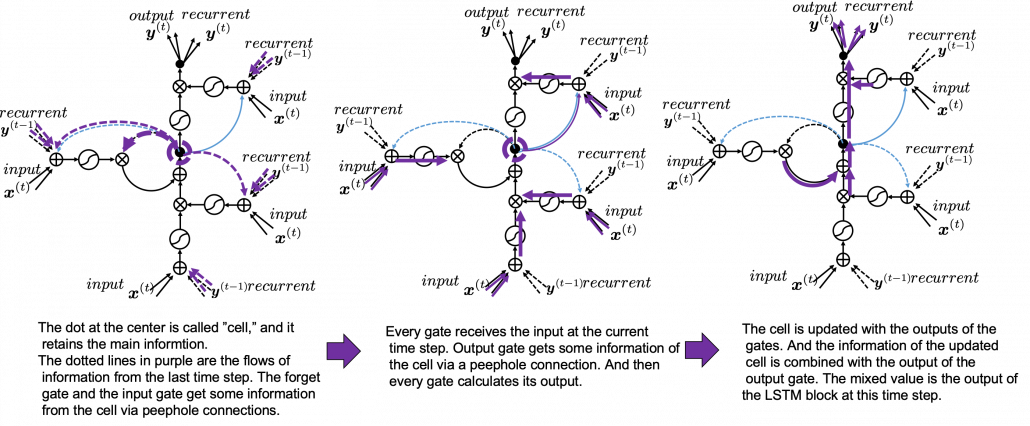
In Space Odyssey type of LSTM chart, at the center is a cell. Electronic circuit type of chart, which shows the flow of information of the cell as an uninterrupted “highway” in an LSTM block. On the other hand, in a Spacey Odyssey type of chart, the information of the cell rotate at the center. And each gate gets the information of the cell through peephole connections,  \boldsymbol{x}^{(t)}, the input at the time step (t) , sand \boldsymbol{y}^{(t-1)}, the output at the last time step (t-1), which came through recurrent connections. In Space Odyssey type of chart, you can more clearly see that the information of the cell go to each gate through the peephole connections in blue. Each gate calculates its output.

Just as the charts you have seen, the dotted line denote the information from the past. First, the information of the cell at the time step (t-1) goes to the forget gate and get mixed with the output of the forget cell In this process the cell is partly “forgotten.” Next, the input gate and the block input are mixed to generate part of new value of the the cell at time step  (t). And the partly “forgotten” \boldsymbol{c}^{(t-1)} goes back to the center of the block and it is mixed with the output of the input gate and the block input. That is how \boldsymbol{c}^{(t)} is renewed. And the value of new cell flow to the top of the chart, being mixed with the output of the output gate. Or you can also say the information of new cell is “suppressed” with the output gate.

I have finished the first four articles of this article series, and finally I am gong to write about back propagation of LSTM in the next article. I have to say what I have written so far is all for the next article, and my long long Power Point slides.


[References]

[1] Klaus Greff, Rupesh Kumar Srivastava, Jan Koutník, Bas R. Steunebrink, Jürgen Schmidhuber, “LSTM: A Search Space Odyssey,” (2017)

[2] Francois Chollet, Deep Learning with Python,(2018), Manning , pp. 202-204

[3] “Sepp Hochreiter receives IEEE CIS Neural Networks Pioneer Award 2021”, Institute of advanced research in artificial intelligence, (2020)
URL: https://www.iarai.ac.at/news/sepp-hochreiter-receives-ieee-cis-neural-networks-pioneer-award-2021/?fbclid=IwAR27cwT5MfCw4Tqzs3MX_W9eahYDcIFuoGymATDR1A-gbtVmDpb8ExfQ87A

[4] Oketani Takayuki, “Machine Learning Professional Series: Deep Learning,” (2015), pp. 120-125
岡谷貴之 著, 「機械学習プロフェッショナルシリーズ 深層学習」, (2015), pp. 120-125

[5] Harada Tatsuya, “Machine Learning Professional Series: Image Recognition,” (2017), pp. 252-257
原田達也 著, 「機械学習プロフェッショナルシリーズ 画像認識」, (2017), pp. 252-257

[6] “Understandable LSTM ~ With the Current Trends,” Qiita, (2015)
「わかるLSTM ~ 最近の動向と共に」, Qiita, (2015)
URL: https://qiita.com/t_Signull/items/21b82be280b46f467d1b

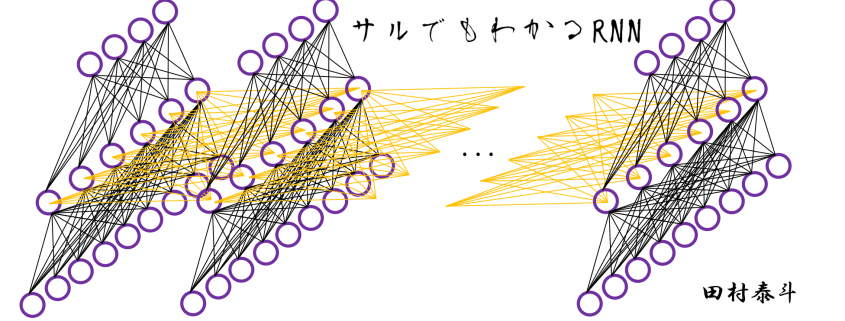
Simple RNN

A brief history of neural nets: everything you should know before learning LSTM

This is not a college course or something on deep learning with strict deadlines for assignments, so let’s take a detour from practical stuff and take a brief look at the history of neural networks.

The history of neural networks is also a big topic, which could be so long that I had to prepare another article series. And usually I am supposed to begin such articles with something like “The term ‘AI’ was first used by John McCarthy in Dartmouth conference 1956…” but you can find many of such texts written by people with much more experiences in this field. Therefore I am going to write this article from my point of view, as an intern writing articles on RNN, as a movie buff, and as one of many Japanese men who spent a great deal of childhood with video games.

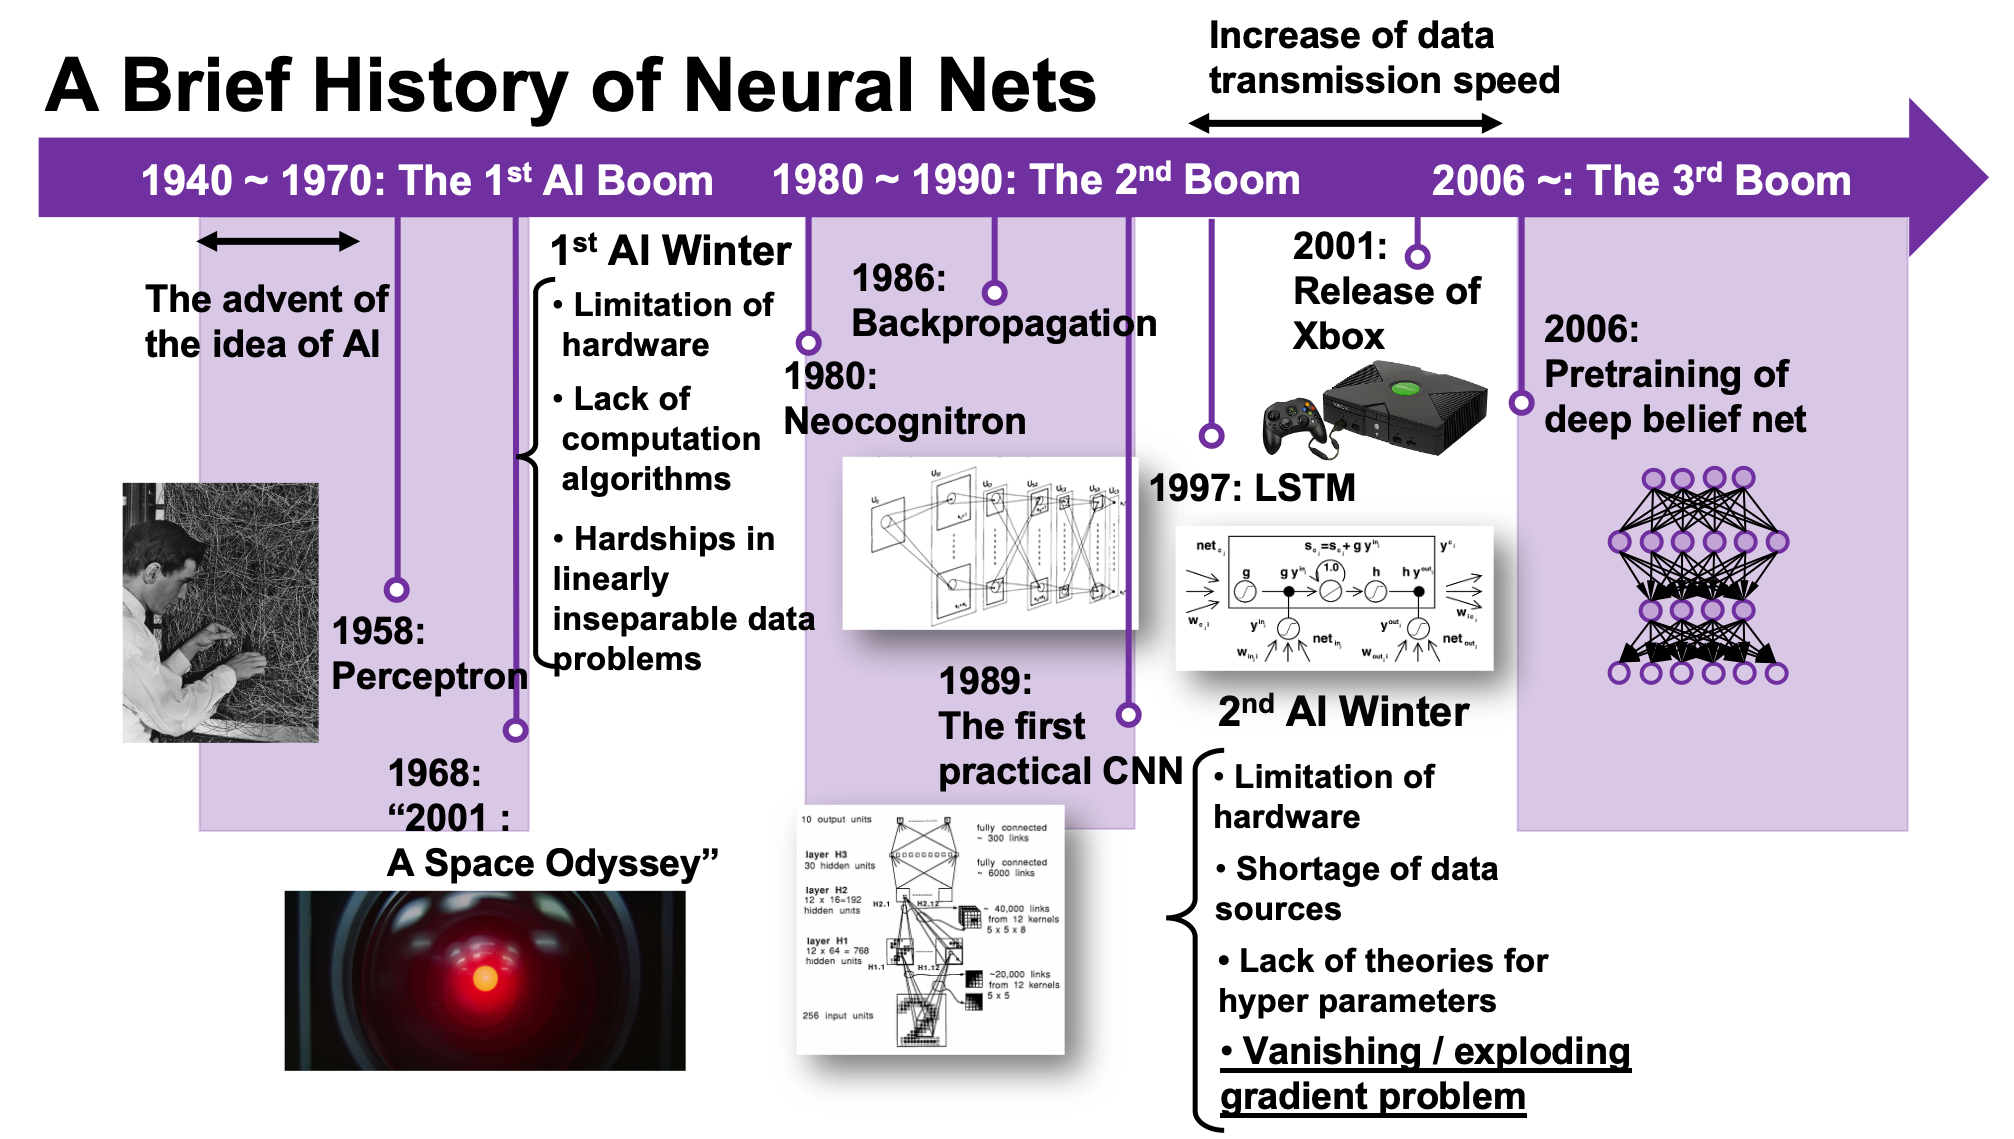
We are now in the third AI boom, and some researchers say this boom began in 2006. A professor in my university said there we are now in a kind of bubble economy in machine learning/data science industry, but people used to say “Stop daydreaming” to AI researchers. The second AI winter is partly due to vanishing/exploding gradient problem of deep learning. And LSTM was invented as one way to tackle such problems, in 1997.

1, First AI boom

In the first AI boom, I think people were literally “daydreaming.” Even though the applications of machine learning algorithms were limited to simple tasks like playing chess, checker, or searching route of 2d mazes, and sometimes this time is called GOFAI (Good Old Fashioned AI).

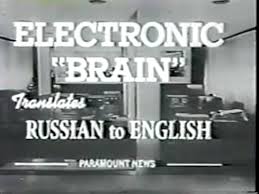
Even today when someone use the term “AI” merely for tasks with neural networks, that amuses me because for me deep learning is just statistically and automatically training neural networks, which are capable of universal approximation, into some classifiers/regressors. Actually the algorithms behind that is quite impressive, but the structure of human brains is much more complicated. The hype of “AI” already started in this first AI boom. Let me take an example of machine translation in this video. In fact the research of machine translation already started in the early 1950s, and of  specific interest in the time was translation between English and Russian due to Cold War. In the first article of this series, I said one of the most famous applications of RNN is machine translation, such as Google Translation, DeepL. They are a type of machine translation called neural machine translation because they use neural networks, especially RNNs. Neural machine translation was an astonishing breakthrough around 2014 in machine translation field. The former major type of machine translation was statistical machine translation, based on statistical language models. And the machine translator in the first AI boom was rule base machine translators, which are more primitive than statistical ones.

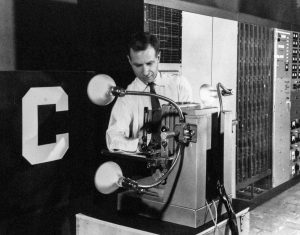
The most remarkable invention in this time was of course perceptron by Frank Rosenblatt. Some people say that this is the first neural network. Even though you can implement perceptron with a-few-line codes in Python, obviously they did not have Jupyter Notebook in those days. The perceptron was implemented as a huge instrument named Mark 1 Perceptron, and it was composed of randomly connected wires. I do not precisely know how it works, but it was a huge effort to implement even the most primitive type of neural networks. They needed to use a big lighting fixture to get a 20*20 pixel image using 20*20 array of cadmium sulphide photocells. The research by Rosenblatt, however, was criticized by Marvin Minsky in his book because perceptrons could only be used for linearly separable data. To make matters worse the criticism prevailed as that more general, multi-layer perceptrons were also not useful for linearly inseparable data (as I mentioned in the first article, multi-layer perceptrons, namely normal neural networks,  can be universal approximators, which have potentials to classify/regress various types of complex data). In case you do not know what “linearly separable” means, imagine that there are data plotted on a piece of paper. If an elementary school kid can draw a border line between two clusters of the data with a ruler and a pencil on the paper, the 2d data is “linearly separable”….
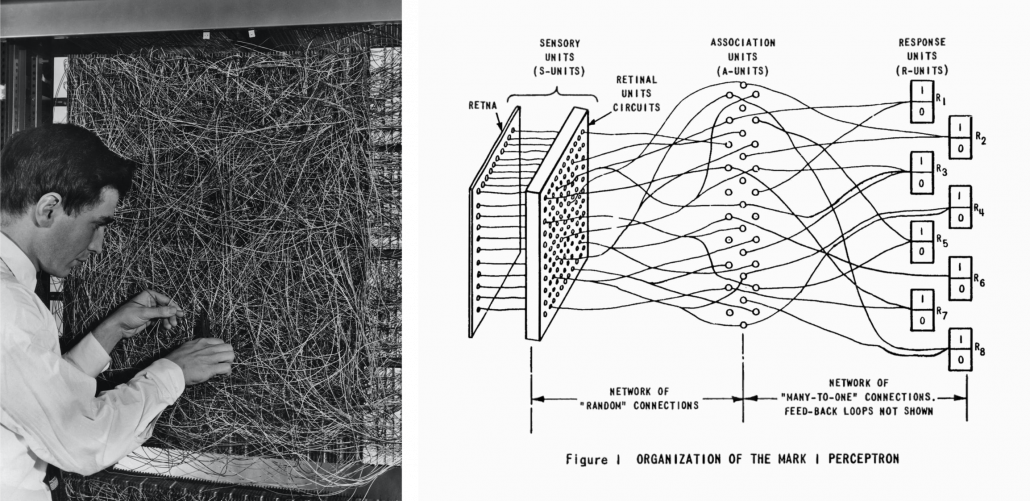
With big disappointments to the research on “electronic brains,” the budget of AI research was reduced and AI research entered its first winter.

I think  the frame problem(1969),  by John McCarthy and Patrick J. Hayes, is also an iconic theory in the end of the first AI boom. This theory is known as a story of creating a robot trying to pull out its battery on a wheeled wagon in a room. The first prototype of the robot, named R1, naively tried to pull out the wagon form the room, and the bomb exploded. The problems was obvious: R1 was not programmed to consider the risks by taking each action, so the researchers made the next prototype named R1D1, which was programmed to consider the potential risks of taking each action. When R1D1 tried to pull out the wagon, it realized the risk of pulling the bomb together with the battery. But soon it started considering all the potential risks, such as the risk of the ceiling falling down, the distance between the wagon and all the walls, and so on, when the bomb exploded. The next problem was also obvious: R1D1 was not programmed to distinguish if the factors are relevant of irrelevant to the main purpose, and the next prototype R2D1 was programmed to do distinguish them. This time, R2D1 started thinking about “whether the factor is  irrelevant to the main purpose,” on every factor measured, and again the bomb exploded. How can we get a perfect AI, R2D2?

The situation of mentioned above is a bit extreme, but it is said AI could also get stuck when it try to take some super simple actions like finding a number in a phone book and make a phone call. It is difficult for an artificial intelligence to decide what is relevant and what is irrelevant, but humans will not get stuck with such simple stuff, and sometimes the frame problem is counted as the most difficult and essential problem of developing AI. But personally I think the original frame problem was unreasonable in that McCarthy, in his attempts to model the real world, was inflexible in his handling of the various equations involved, treating them all with equal weight regardless of the particular circumstances of a situation. Some people say that McCarthy, who was an advocate for AI, also wanted to see the field come to an end, due to its failure to meet the high expectations it once aroused.

Not only the frame problem, but also many other AI-related technological/philosophical problems have been proposed, such as Chinese room (1980), the symbol grounding problem (1990), and they are thought to be as hardships in inventing artificial intelligence, but I omit those topics in this article.

*The name R2D2 did not come from the famous story of frame problem. The story was Daniel Dennett first proposed the story of R2D2 in his paper published in 1984. Star Wars was first released in 1977. It is said that the name R2D2 came from “Reel 2, Dialogue 2,” which George Lucas said while film shooting. And the design of C3PO came from Maria in Metropolis(1927). It is said that the most famous AI duo in movie history was inspired by Tahei and Matashichi in The Hidden Fortress(1958), directed by Kurosawa Akira.

Interestingly, in the end of the first AI boom, 2001: A Space Odyssey, directed by Stanley Kubrick, was released in 1968. Unlike conventional fantasylike AI characters, for example Maria in Metropolis(1927), HAL 9000 was portrayed as a very realistic AI, and the movie already pointed out the risk of AI being insane when it gets some commands from several users. HAL 9000 still has been a very iconic character in AI field. For example when you say some quotes from 2001: A Space Odyssey to Siri you get some parody responses. I also thin you should keep it in mind that in order to make an AI like HAL 9000 come true, for now RNNs would be indispensable in many ways: you would need RNNs for better voice recognition, better conversational system, and for reading lips.

*Just as you cannot understand Monty Python references in Python official tutorials without watching Monty Python and the Holy Grail, you cannot understand many parodies in AI contexts without watching 2001: A Space Odyssey. Even thought the movie had some interview videos with some researchers and some narrations, Stanley Kubrick cut off all the footage and made the movie very difficult to understand. Most people did not or do not understand that it is a movie about aliens who gave homework of coming to Jupiter to human beings.

2, Second AI boom/winter

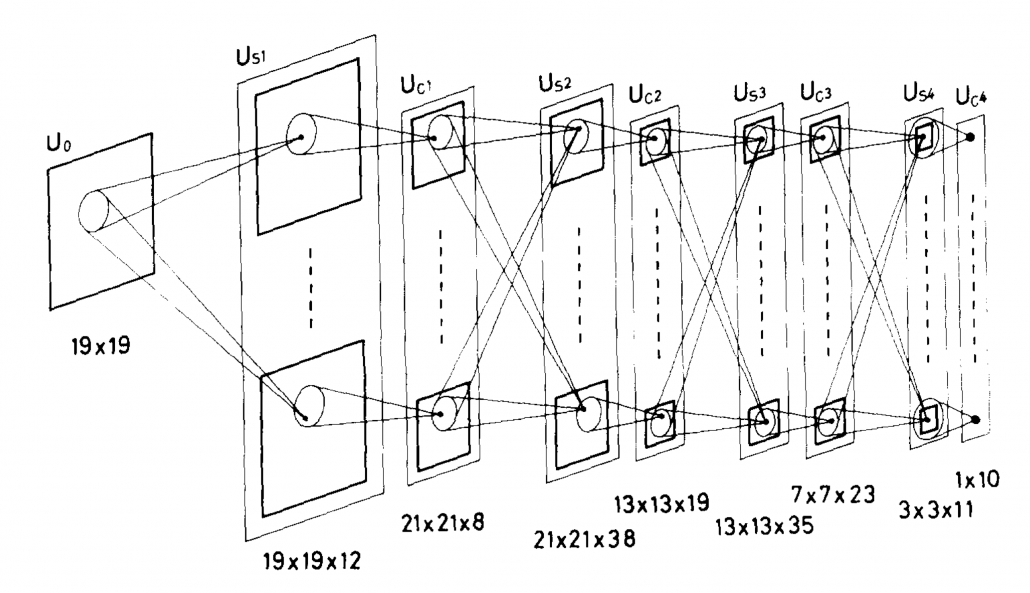
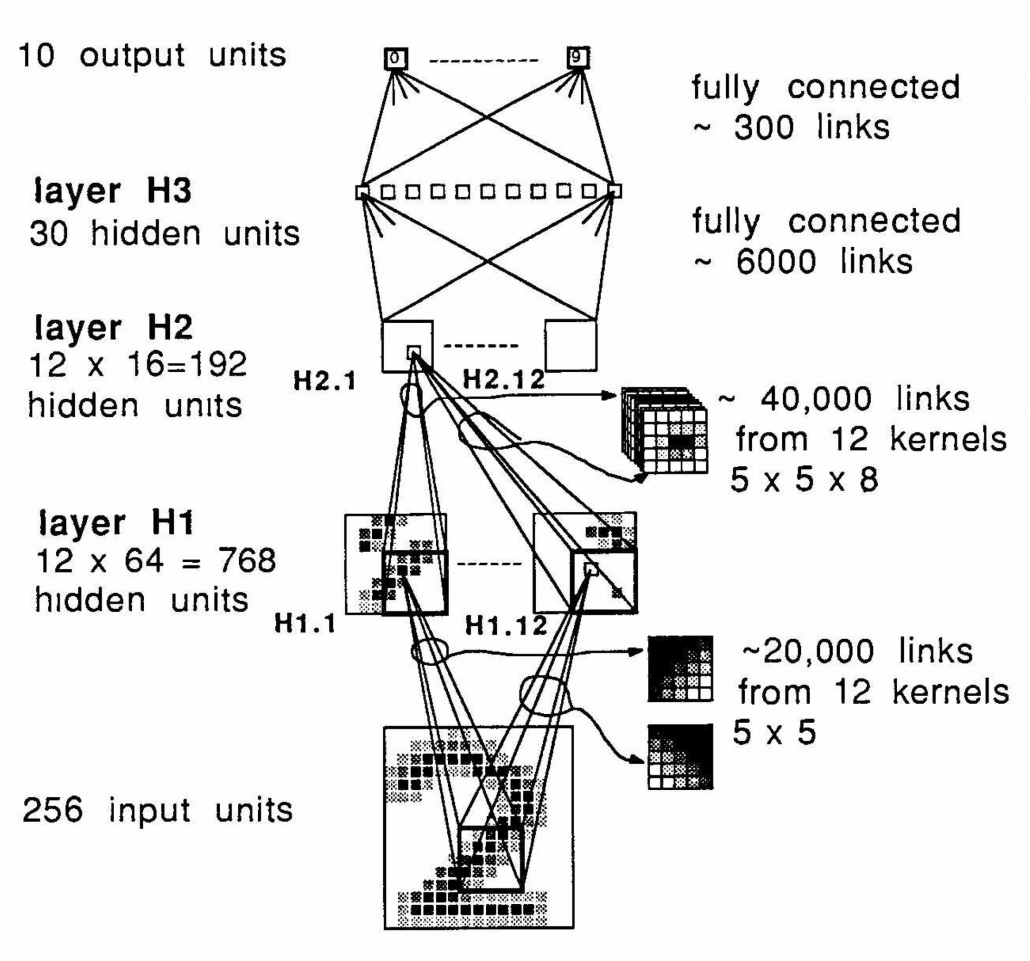
I am not going to write about the second AI boom in detail, but at least you should keep it in mind that convolutional neural network(CNN) is a keyword in this time. Neocognitron, an artificial model of how sight nerves perceive thing, was invented by Kunihiko Fukushima in 1980, and the model is said to be the origin on CNN. And Neocognitron got inspired by the Hubel and Wiesel’s research on sight nerves. In 1989, a group in AT & T Bell Laboratory led by Yann LeCun invented the first practical CNN to read handwritten digit.

Another turning point in this second AI boom was that back propagation algorithm was discovered, and the CNN by LeCun was also trained with back propagation. LeCun made a deep neural networks with some layers in 1998 for more practical uses.

But his research did not gain so much attention like today, because AI research entered its second winter at the beginning of the 1990s, and that was partly due to vanishing/exploding gradient problem of deep learning. People knew that neural networks had potentials of universal approximation, but when they tried to train naively stacked neural nets the gradients, which you need to train neural networks, exponentially increased/decreased. Even though the CNN made by LeCun was the first successful case of “deep” neural nets which did not suffer from the vanishing/exploding gradient problem, deep learning research also stagnated in this time.

The ultimate goal of this article series is to understand LSTM at a more abstract/mathematical level because it is one of the practical RNNs, but the idea of LSTM (Long Short Term Memory) itself was already proposed in 1997 as an RNN algorithm to tackle vanishing gradient problem. (Exploding gradient problem is solved with a technique named gradient clipping, and this is easier than techniques for preventing vanishing gradient problems. I am also going to explain it in the next article.) After that some other techniques like introducing forget gate, peephole connections, were discovered, but basically it took some 20 years till LSTM got attentions like today. The reasons for that is lack of hardware and data sets, and that was also major reasons for the second AI winter.

In the 1990s, the mid of second AI winter, the Internet started prevailing for commercial uses. I think one of the iconic events in this time was the source codes WWW(World Wide Web) were announced in 1993. Some of you might still remember that you little by little became able to transmit more data online in this time. That means people came to get more and more access to various datasets in those days, which is indispensable for machine learning tasks.

After all, we could not get HAL 9000 by the end of 2001, but instead we got Xbox console.

3, Video game industry and GPU

Even though research on neural networks stagnated in the 1990s the same period witnessed an advance in the computation of massive parallel linear transformations, due to their need in fields such as image processing.

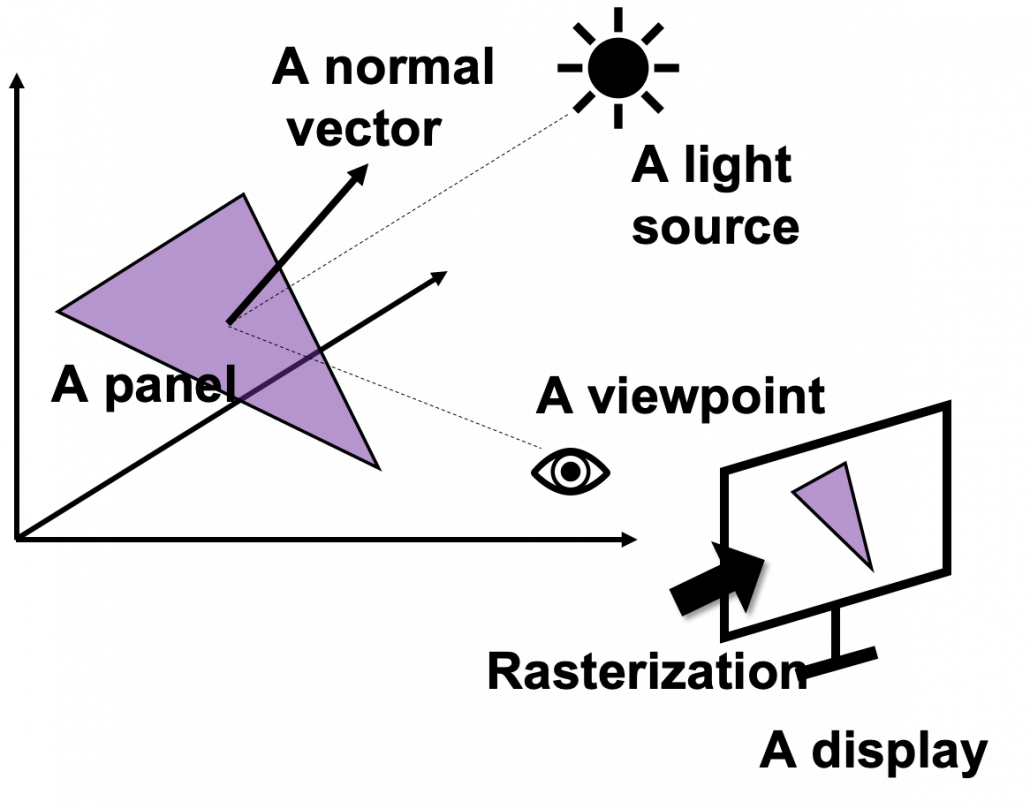
Computer graphics move or rotate in 3d spaces, and that is also linear transformations. When you think about a car moving in a city, it is convenient to place the car, buildings, and other objects on a fixed 3d space. But when you need to make computer graphics of scenes of the city from a view point inside the car, you put a moving origin point in the car and see the city. The spatial information of the city is calculated as vectors from the moving origin point. Of course this is also linear transformations. Of course I am not talking about a dot or simple figures moving in the 3d spaces. Computer graphics are composed of numerous plane panels, and each of them have at least three vertexes, and they move on 3d spaces. Depending on viewpoints, you need project the 3d graphics in 3d spaces on 2d spaces to display the graphics on devices. You need to calculate which part of the panel is projected to which pixel on the display, and that is called rasterization. Plus, in order to get photophotorealistic image, you need to think about how lights from light sources reflect on the panel and projected on the display. And you also have to put some textures on groups of panels. You might also need to change color spaces, which is also linear transformations.

My point is, in short, you really need to do numerous linear transformations in parallel in image processing.

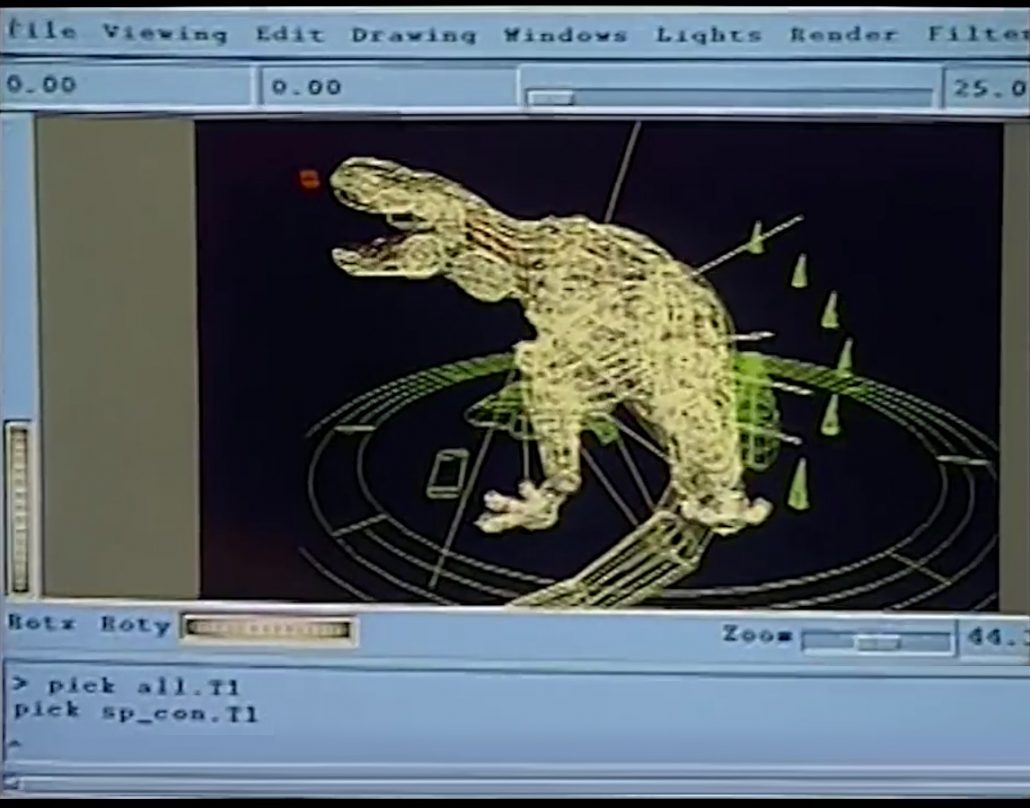
When it comes to the use of CGI in movies,  two pioneer movies were released during this time: Jurassic Park in 1993, and Toy Story in 1995. It is famous that Pixar used to be one of the departments in ILM(Industrial Light and Magic), founded by George Lucas, and Steve Jobs bought the department. Even though the members in Pixar had not even made a long feature film in their lives, after trial and errors, they made the first CGI animated feature movie. On the other hand, in order to acquire funds for the production of Schindler’s List(1993), Steven Spielberg took on Jurassic Park(1993), consequently changing the history of CGI through this “side job.”

*I think you have realized that George Lucas is mentioned almost everywhere in this article. His influences on technologies are not only limited to image processing, but also sound measuring system, nonlinear editing system. Photoshop was also originally developed under his company. I need another article series for this topic, but maybe not in Data Science Blog.

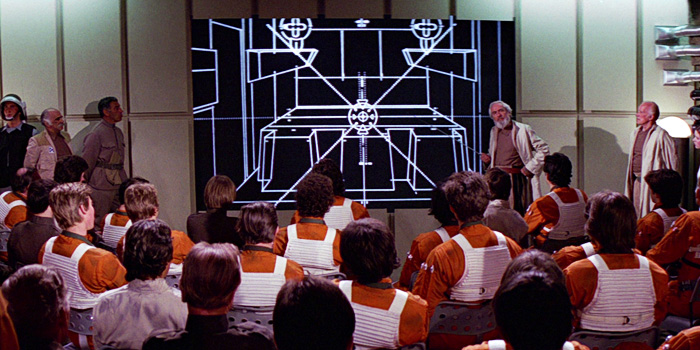
Considering that the first wire-frame computer graphics made and displayed by computers appeared in the scene of displaying the wire frame structure of Death Star in a war room, in Star Wars: A New Hope, the development of CGI was already astonishing at this time. But I think deep learning owe its development more to video game industry.

*I said that the Death Star scene is the first use of graphics made and DISPLAYED by computers, because I have to say one of the first graphics in movie MADE by computer dates back to the legendary title sequence of Vertigo(1958).

When it comes to 3D video games the processing unit has to constantly deal with real time commands from controllers. It is famous that GPU was originally specifically designed for plotting computer graphics. Video game market is the biggest in entertainment industry in general, and it is said that the quality of computer graphics have the strongest correlation with video games sales, therefore enhancing this quality is a priority for the video game console manufacturers.

One good example to see how much video games developed is comparing original Final Fantasy 7 and the remake one. The original one was released in 1997, the same year as when LSTM was invented. And recently  the remake version of Final Fantasy 7 was finally released this year. The original one was also made with very big budget, and it was divided into three CD-ROMs. The original one was also very revolutionary given that the former ones of Final Fantasy franchise were all 2d video retro style video games. But still the computer graphics looks like polygons, and in almost all scenes the camera angle was fixed in the original one. On the other hand the remake one is very photorealistic and you can move the angle of the camera as you want while you play the video game.

There were also fierce battles by graphic processor manufacturers in computer video game market in the 1990s, but personally I think the release of Xbox console was a turning point in the development of GPU. To be concrete, Microsoft adopted a type of NV20 GPU for Xbox consoles, and that left some room of programmability for developers. The chief architect of NV20, which was released under the brand of GeForce3, said making major changes in the company’s graphic chips was very risky. But that decision opened up possibilities of uses of GPU beyond computer graphics.

I think that the idea of a programmable GPU provided other scientific fields with more visible benefits after CUDA was launched. And GPU gained its position not only in deep learning, but also many other fields including making super computers.

*When it comes to deep learning, even GPUs have strong rivals. TPU(Tensor Processing Unit) made by Google, is specialized for deep learning tasks, and have astonishing processing speed. And FPGA(Field Programmable Gate Array), which was originally invented customizable electronic circuit, proved to be efficient for reducing electricity consumption of deep learning tasks.

*I am not so sure about this GPU part. Processing unit, including GPU is another big topic, that is beyond my capacity to be honest.  I would appreciate it if you could share your view and some references to confirm your opinion, on the comment section or via email.

*If you are interested you should see this video of game fans’ reactions to the announcement of Final Fantasy 7. This is the industry which grew behind the development of deep learning, and many fields where you need parallel computations owe themselves to the nerds who spent a lot of money for video games, including me.

*But ironically the engineers who invented the GPU said they did not play video games simply because they were busy. If you try to study the technologies behind video games, you would not have much time playing them. That is the reality.

We have seen that the in this second AI winter, Internet and GPU laid foundation of the next AI boom. But still the last piece of the puzzle is missing: let’s look at the breakthrough which solved the vanishing /exploding gradient problem of deep learning in the next section.

4, Pretraining of deep belief networks: “The Dawn of Deep Learning”

Some researchers say the invention of pretraining of deep belief network by Geoffrey Hinton was a breakthrough which put an end to the last AI winter. Deep belief networks are different type of networks from the neural networks we have discussed, but their architectures are similar to those of the neural networks. And it was also unknown how to train deep belief nets when they have several layers. Hinton discovered that training the networks layer by layer in advance can tackle vanishing gradient problems. And later it was discovered that you can do pretraining neural networks layer by layer with autoencoders.

*Deep belief network is beyond the scope of this article series. I have to talk about generative models, Boltzmann machine, and some other topics.

The pretraining techniques of neural networks is not mainstream anymore. But I think it is very meaningful to know that major deep learning techniques such as using ReLU activation functions, optimization with Adam, dropout, batch normalization, came up as more effective algorithms for deep learning after the advent of the pretraining techniques, and now we are in the third AI boom.

In the next next article we are finally going to work on LSTM. Specifically, I am going to offer a clearer guide to a well-made paper on LSTM, named “LSTM: A Search Space Odyssey.”

* I make study materials on machine learning, sponsored by DATANOMIQ. I do my best to make my content as straightforward but as precise as possible. I include all of my reference sources. If you notice any mistakes in my materials, including grammatical errors, please let me know (email: yasuto.tamura@datanomiq.de). And if you have any advice for making my materials more understandable to learners, I would appreciate hearing it.

Simple RNN

Simple RNN: the first foothold for understanding LSTM

*In this article “Densely Connected Layers” is written as “DCL,” and “Convolutional Neural Network” as “CNN.”

In the last article, I mentioned “When it comes to the structure of RNN, many study materials try to avoid showing that RNNs are also connections of neurons, as well as DCL or CNN.” Even if you manage to understand DCL and CNN, you can be suddenly left behind once you try to understand RNN because it looks like a different field. In the second section of this article, I am going to provide a some helps for more abstract understandings of DCL/CNN , which you need when you read most other study materials.

My explanation on this simple RNN is based on a chapter in a textbook published by Massachusetts Institute of Technology, which is also recommended in some deep learning courses of Stanford University.

First of all, you should keep it in mind that simple RNN are not useful in many cases, mainly because of vanishing/exploding gradient problem, which I am going to explain in the next article. LSTM is one major type of RNN used for tackling those problems. But without clear understanding forward/back propagation of RNN, I think many people would get stuck when they try to understand how LSTM works, especially during its back propagation stage. If you have tried climbing the mountain of understanding LSTM, but found yourself having to retreat back to the foot, I suggest that you read through this article on simple RNNs. It should help you to gain a solid foothold, and you would be ready for trying to climb the mountain again.

*This article is the second article of “A gentle introduction to the tiresome part of understanding RNN.”

1, A brief review on back propagation of DCL.

Simple RNNs are straightforward applications of DCL, but if you do not even have any ideas on DCL forward/back propagation, you will not be able to understand this article. If you more or less understand how back propagation of DCL works, you can skip this first section.

Deep learning is a part of machine learning. And most importantly, whether it is classical machine learning or deep learning, adjusting parameters is what machine learning is all about. Parameters mean elements of functions except for variants. For example when you get a very simple function f(x)=a + bx + cx^2 + dx^3, then x is a variant, and a, b, c, d are parameters. In case of classical machine learning algorithms, the number of those parameters are very limited because they were originally designed manually. Such functions for classical machine learning is useful for features found by humans, after trial and errors(feature engineering is a field of finding such effective features, manually). You adjust those parameters based on how different the outputs(estimated outcome of classification/regression) are from supervising vectors(the data prepared to show ideal answers).

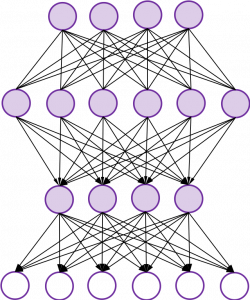
In the last article I said neural networks are just mappings, whose inputs are vectors, matrices, or sequence data. In case of DCLs, inputs are vectors. Then what’s the number of parameters ? The answer depends on the the number of neurons and layers. In the example of DCL at the right side, the number of the connections of the neurons is the number of parameters(Would you like to try to count them? At least I would say “No.”). Unlike classical machine learning you no longer need to do feature engineering, but instead you need to design networks effective for each task and adjust a lot of parameters.

*I think the hype of AI comes from the fact that neural networks find features automatically. But the reality is difficulty of feature engineering was just replaced by difficulty of designing proper neural networks.

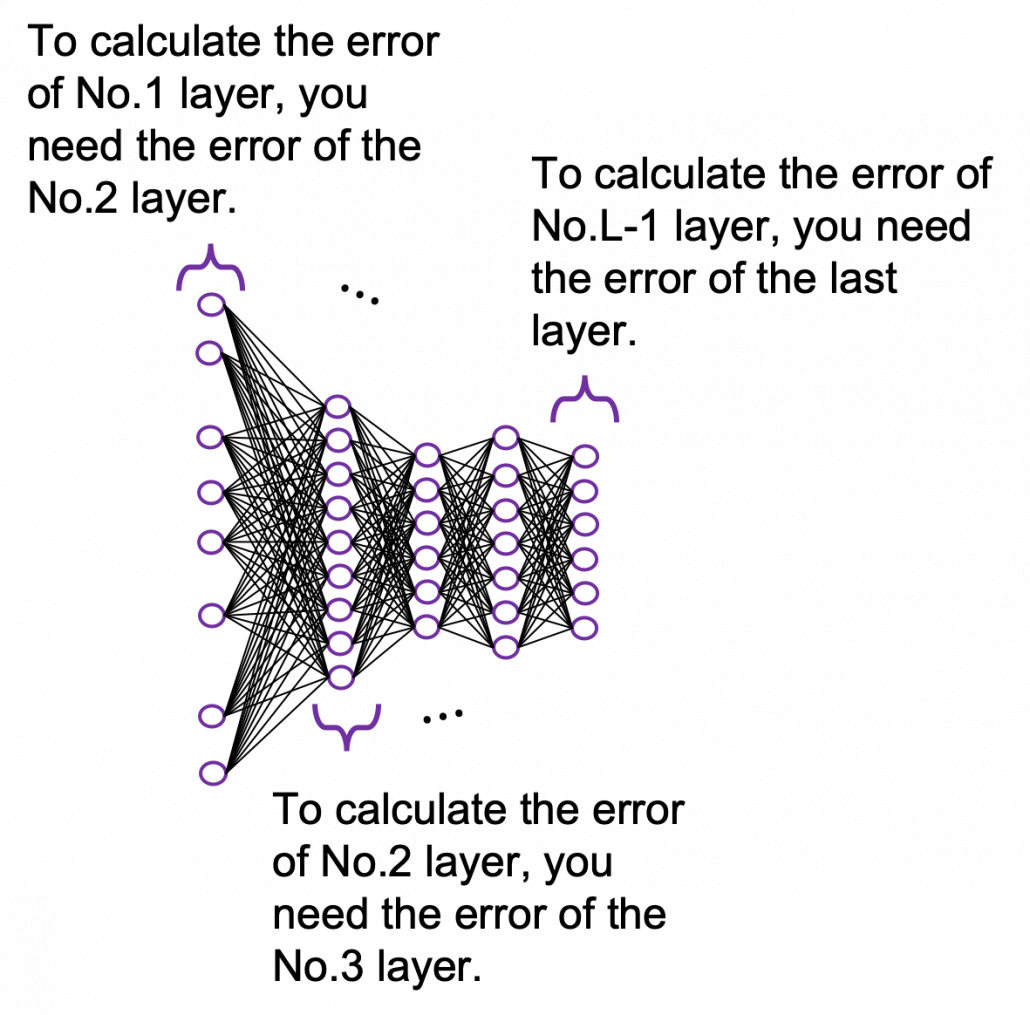
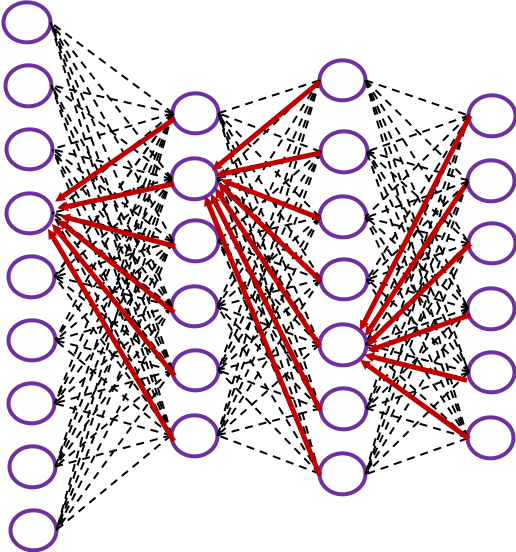
It is easy to imagine that you need an efficient way to adjust those parameters, and the method is called back propagation (or just backprop). As long as it is about DCL backprop, you can find a lot of well-made study materials on that, so I am not going to cover that topic precisely in this article series. Simply putting, during back propagation, in order to adjust parameters of a layer you need errors in the next layer. And in order calculate the errors of the next layer, you need errors in the next next layer.

*You should not think too much about what the “errors” exactly mean. Such “errors” are defined in this context, and you will see why you need them if you actually write down all the mathematical equations behind backprops of DCL.

The red arrows in the figure shows how errors of all the neurons in a layer propagate backward to a neuron in last layer. The figure shows only some sets of such errors propagating backward, but in practice you have to think about all the combinations of such red arrows in the whole back propagation(this link would give you some ideas on how DCLs work).

These points are minimum prerequisites for continuing reading this  RNN this article. But if you are planning to understand RNN forward/back propagation at  an abstract/mathematical level that you can read academic papers,  I highly recommend you to actually write down all the equations of DCL backprop. And if possible you should try to implement backprop of three-layer DCL.

2, Forward propagation of simple RNN

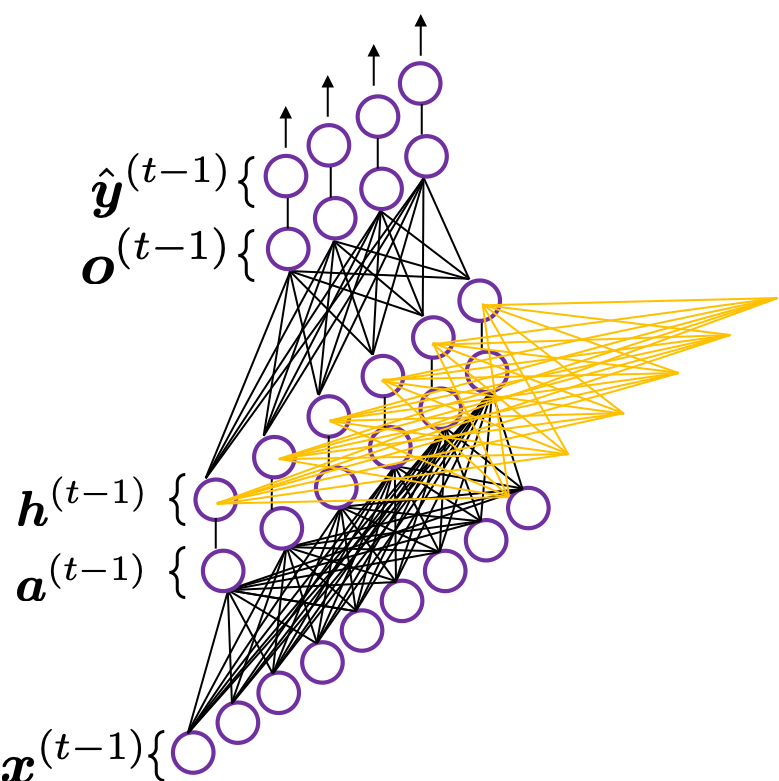
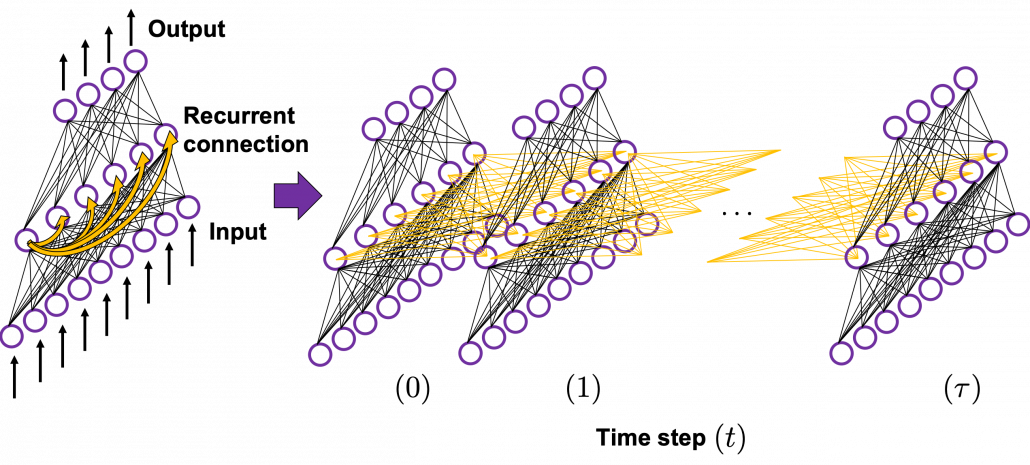
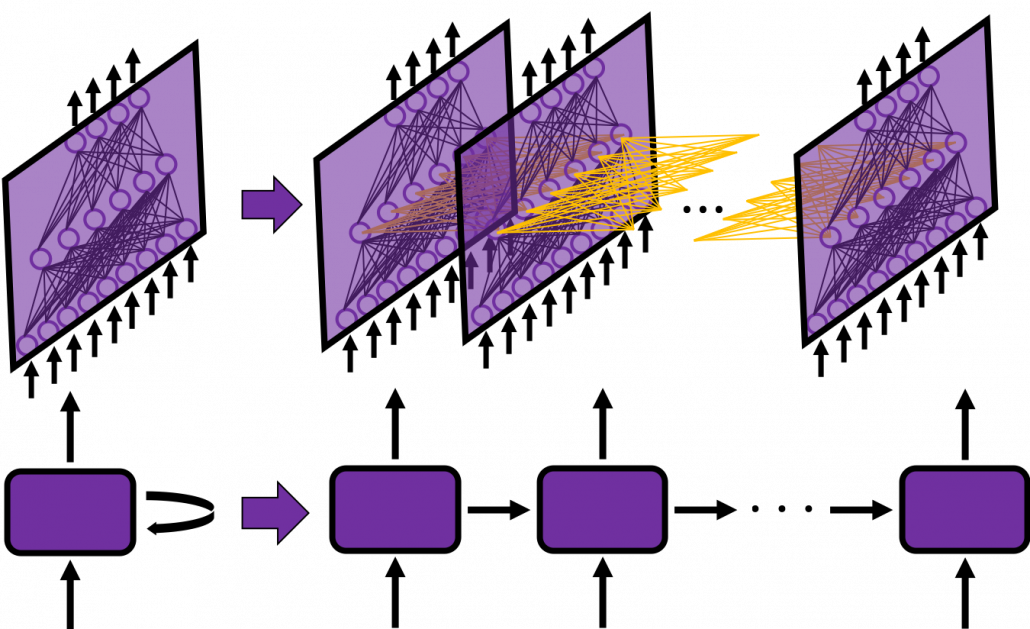
In fact the simple RNN which we are going to look at in this article has only three layers. From now on imagine that inputs of RNN come from the bottom and outputs go up. But RNNs have to keep information of earlier times steps during upcoming several time steps because as I mentioned in the last article RNNs are used for sequence data, the order of whose elements is important. In order to do that, information of the neurons in the middle layer of RNN propagate forward to the middle layer itself. Therefore in one time step of forward propagation of RNN, the input at the time step propagates forward as normal DCL, and the RNN gives out an output at the time step. And information of one neuron in the middle layer propagate forward to the other neurons like yellow arrows in the figure. And the information in the next neuron propagate forward to the other neurons, and this process is repeated. This is called recurrent connections of RNN.
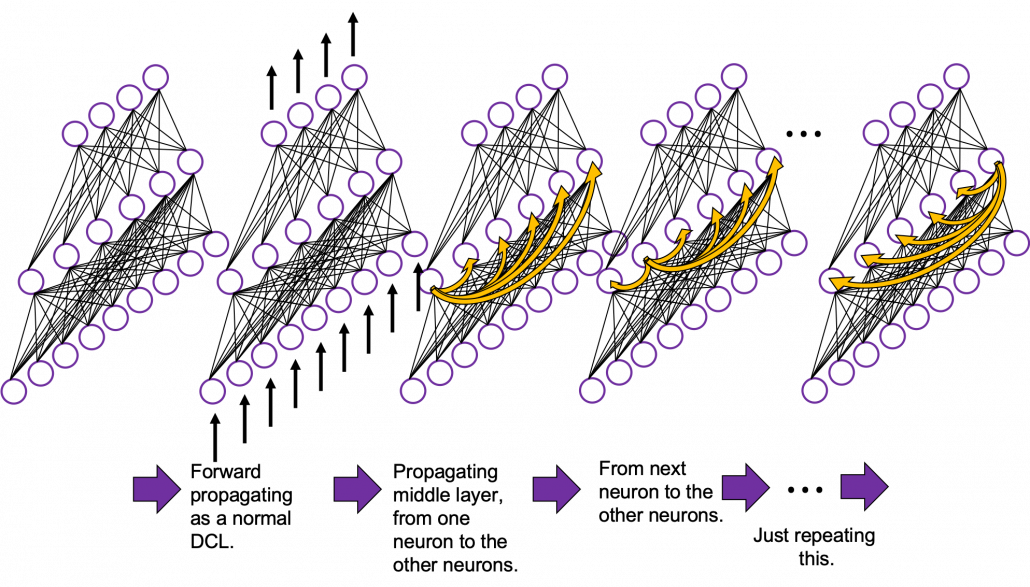
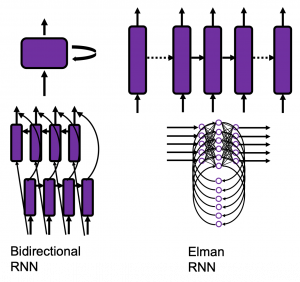
*To be exact we are just looking at a type of recurrent connections. For example Elman RNNs have simpler recurrent connections. And recurrent connections of LSTM are more complicated.

Whether it is a simple one or not, basically RNN repeats this process of getting an input at every time step, giving out an output, and making recurrent connections to the RNN itself. But you need to keep the values of activated neurons at every time step, so virtually you need to consider the same RNNs duplicated for several time steps like the figure below. This is the idea of unfolding RNN. Depending on contexts, the whole unfolded DCLs with recurrent connections is also called an RNN.

In many situations, RNNs are simplified as below. If you have read through this article until this point, I bet you gained some better understanding of RNNs, so you should little by little get used to this more abstract, blackboxed  way of showing RNN.
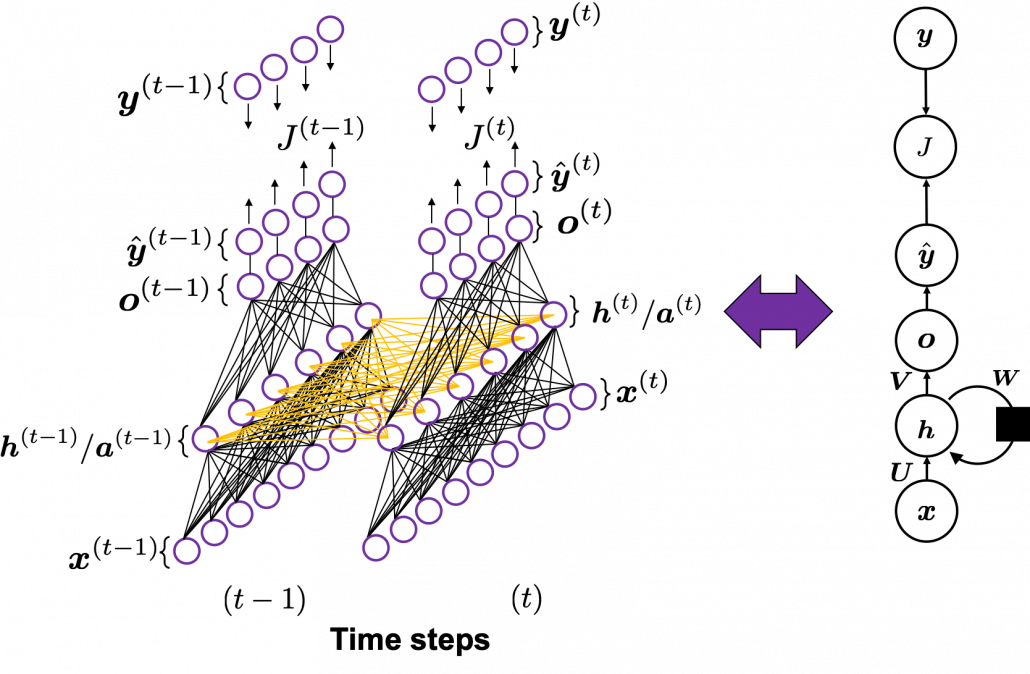
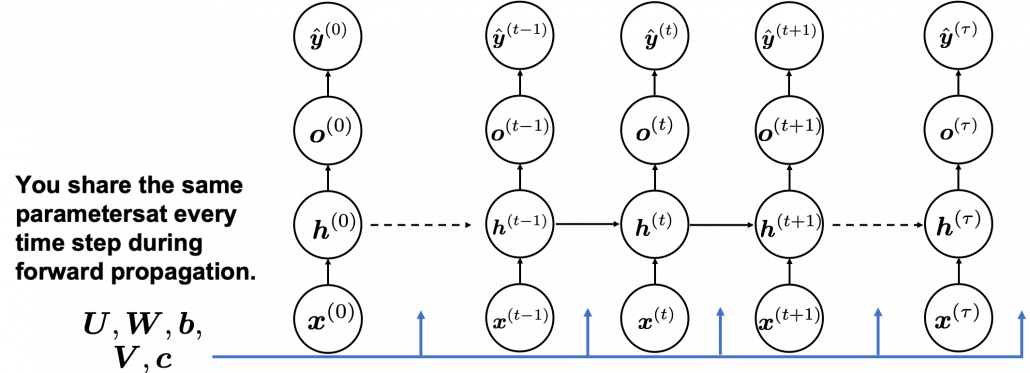
You have seen that you can unfold an RNN, per time step. From now on I am going to show the simple RNN in a simpler way,  based on the MIT textbook which I recomment. The figure below shows how RNN propagate forward during two time steps (t-1), (t).

The input \boldsymbol{x}^{(t-1)}at time step(t-1) propagate forward as a normal DCL, and gives out the output \hat{\boldsymbol{y}} ^{(t)} (The notation on the \boldsymbol{y} ^{(t)} is called “hat,” and it means that the value is an estimated value. Whatever machine learning tasks you work on, the outputs of the functions are just estimations of ideal outcomes. You need to adjust parameters for better estimations. You should always be careful whether it is an actual value or an estimated value in the context of machine learning or statistics). But the most important parts are the middle layers.

*To be exact I should have drawn the middle layers as connections of two layers of neurons like the figure at the right side. But I made my figure closer to the chart in the MIT textbook, and also most other study materials show the combinations of the two neurons before/after activation as one neuron.

\boldsymbol{a}^{(t)} is just linear summations of \boldsymbol{x}^{(t)} (If you do not know what “linear summations” mean, please scroll this page a bit), and \boldsymbol{h}^{(t)} is a combination of activated values of \boldsymbol{a}^{(t)} and linear summations of \boldsymbol{h}^{(t-1)} from the last time step, with recurrent connections. The values of \boldsymbol{h}^{(t)} propagate forward in two ways. One is normal DCL forward propagation to \hat{\boldsymbol{y}} ^{(t)} and \boldsymbol{o}^{(t)}, and the other is recurrent connections to \boldsymbol{h}^{(t+1)} .

These are equations for each step of forward propagation.

  • \boldsymbol{a}^{(t)} = \boldsymbol{b} + \boldsymbol{W} \cdot \boldsymbol{h}^{(t-1)} + \boldsymbol{U} \cdot \boldsymbol{x}^{(t)}
  • \boldsymbol{h}^{(t)}= g(\boldsymbol{a}^{(t)})
  • \boldsymbol{o}^{(t)} = \boldsymbol{c} + \boldsymbol{V} \cdot \boldsymbol{h}^{(t)}
  • \hat{\boldsymbol{y}} ^{(t)} = f(\boldsymbol{o}^{(t)})

*Please forgive me for adding some mathematical equations on this article even though I pledged not to in the first article. You can skip the them, but for some people it is on the contrary more confusing if there are no equations. In case you are allergic to mathematics, I prescribed some treatments below.

*Linear summation is a type of weighted summation of some elements. Concretely, when you have a vector \boldsymbol{x}=(x_0, x_1, x_2), and weights \boldsymbol{w}=(w_0,w_1, w_2), then \boldsymbol{w}^T \cdot \boldsymbol{x} = w_0 \cdot x_0 + w_1 \cdot x_1 +w_2 \cdot x_2 is a linear summation of \boldsymbol{x}, and its weights are \boldsymbol{w}.

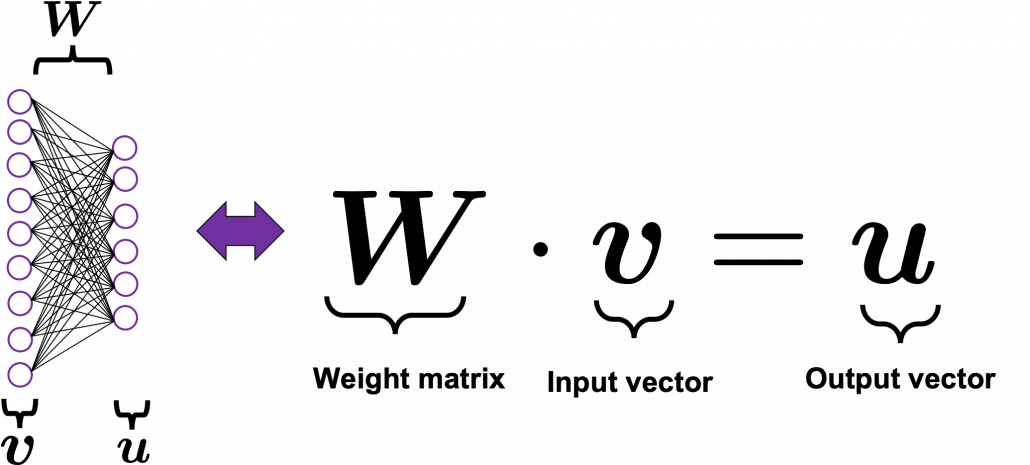
*When you see a product of a matrix and a vector, for example a product of \boldsymbol{W} and \boldsymbol{v}, you should clearly make an image of connections between two layers of a neural network. You can also say each element of \boldsymbol{u}} is a linear summations all the elements of \boldsymbol{v}} , and \boldsymbol{W} gives the weights for the summations.

A very important point is that you share the same parameters, in this case \boldsymbol{\theta \in \{\boldsymbol{U}, \boldsymbol{W}, \boldsymbol{b}, \boldsymbol{V}, \boldsymbol{c} \}}, at every time step. 

And you are likely to see this RNN in this blackboxed form.

3, The steps of back propagation of simple RNN

In the last article, I said “I have to say backprop of RNN, especially LSTM (a useful and mainstream type or RNN), is a monster of chain rules.” I did my best to make my PowerPoint on LSTM backprop straightforward. But looking at it again, the LSTM backprop part still looks like an electronic circuit, and it requires some patience from you to understand it. If you want to understand LSTM at a more mathematical level, understanding the flow of simple RNN backprop is indispensable, so I would like you to be patient while understanding this step (and you have to be even more patient while understanding LSTM backprop).

This might be a matter of my literacy, but explanations on RNN backprop are very frustrating for me in the points below.

  • Most explanations just show how to calculate gradients at each time step.
  • Most study materials are visually very poor.
  • Most explanations just emphasize that “errors are back propagating through time,” using tons of arrows, but they lack concrete instructions on how actually you renew parameters with those errors.

If you can relate to the feelings I mentioned above, the instructions from now on could somewhat help you. And I am going to share some study materials on simple RNNs in an external link so that you can gain a clear and mathematical understanding on how simple RNNs work.

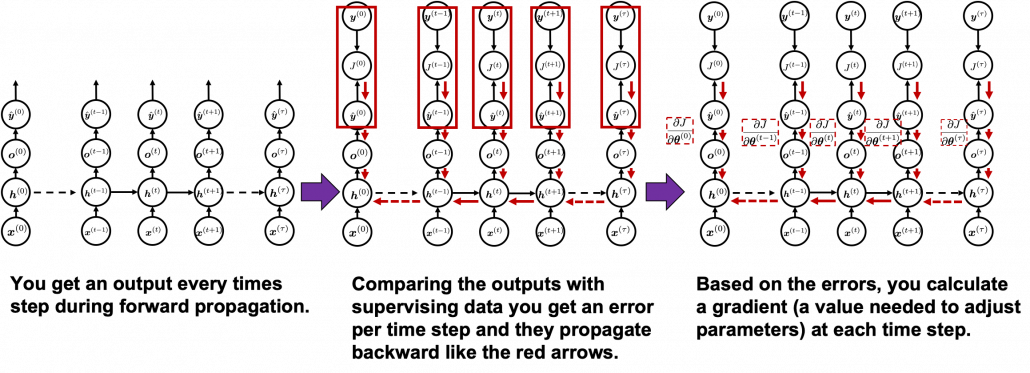
Backprop of RNN , as long as you are thinking about simple RNNs, is not so different from that of DCLs. But you have to be careful about the meaning of errors in the context of RNN backprop. Back propagation through time (BPTT) is one of the major methods for RNN backprop, and I am sure most textbooks explain BPTT. But most study materials just emphasize that you need errors from all the time steps, and I think that is very misleading and confusing.

You need all the gradients to adjust parameters, but you do not necessarily need all the errors to calculate those gradients. Gradients in the context of machine learning mean partial derivatives of error functions (in this case J) with respect to certain parameters, and mathematically a gradient of J with respect to \boldsymbol{\theta \in \{\boldsymbol{U}, \boldsymbol{W}, \boldsymbol{b}^{(t)}, \boldsymbol{V}, \boldsymbol{c} \}}is denoted as ( \frac{\partial J}{\partial \boldsymbol{\theta}}  ). And another confusing point in many textbooks, including the MIT one, is that they give an impression that parameters depend on time steps. For example some study materials use notations like \frac{\partial J}{\partial \boldsymbol{\theta}^{(t)}}, and I think this gives an impression that this is a gradient with respect to the parameters at time step (t). In my opinion this gradient rather should be written as ( \frac{\partial J}{\partial \boldsymbol{\theta}} )^{(t)} . But many study materials denote gradients of those errors in the former way, so from now on let me use the notations which you can see in the figures in this article.
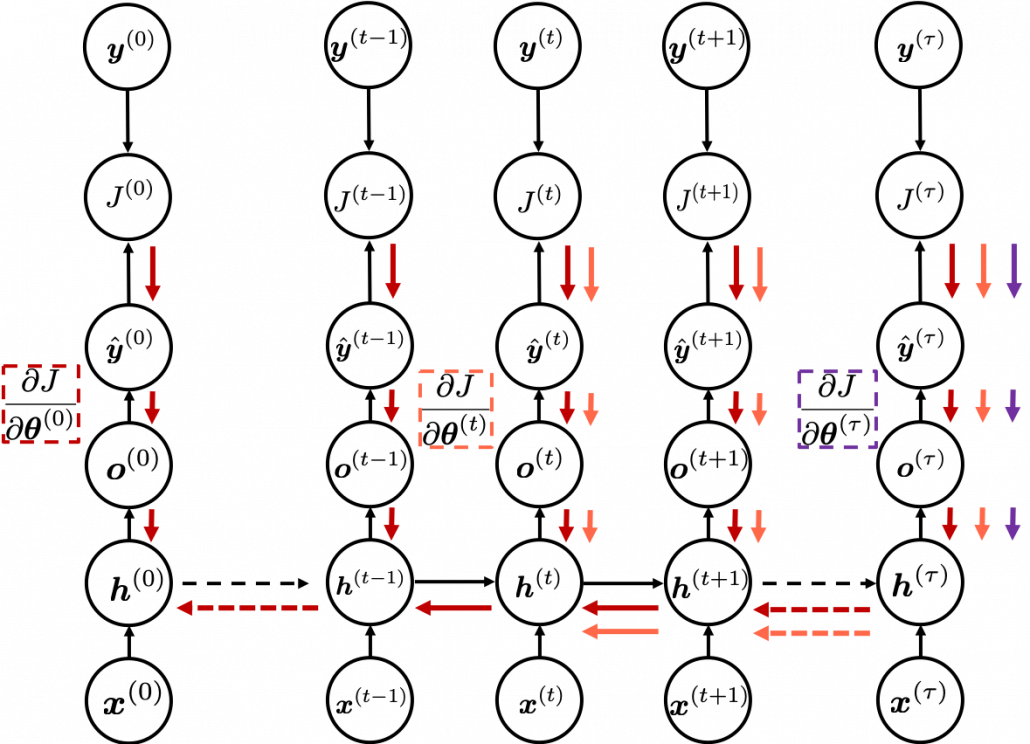
In order to calculate the gradient \frac{\partial J}{\partial \boldsymbol{x}^{(t)}} you need errors from time steps s (s \geq t) \quad (as you can see in the figure, in order to calculate a gradient in a colored frame, you need all the errors in the same color).

*Another confusing point is that the \frac{\partial J}{\partial \boldsymbol{\ast ^{(t)}}}, \boldsymbol{\ast} \in \{\boldsymbol{a}^{(t)}, \boldsymbol{h}^{(t)}, \boldsymbol{o}^{(t)}, \dots \} are correct notations, because \boldsymbol{\ast} are values of neurons after forward propagation. They depend on time steps, and these are very values which I have been calling “errors.” That is why parameters do not depend on time steps, whereas errors depend on time steps.

As I mentioned before, you share the same parameters at every time step. Again, please do not assume that parameters are different from time step to time step. It is gradients/errors (you need errors to calculate gradients) which depend on time step. And after calculating errors at every time step, you can finally adjust parameters one time, and that’s why this is called “back propagation through time.” (It is easy to imagine that this method can be very inefficient. If the input is the whole text on a Wikipedia link, you need to input all the sentences in the Wikipedia text to renew parameters one time. To solve this problem there is a backprop method named “truncated BPTT,” with which you renew parameters based on a part of a text. )

And after calculating those gradients \frac{\partial J}{\partial \boldsymbol{\theta}^{(t)}} you can take a summation of them: \frac{\partial J}{\partial \boldsymbol{\theta}}=\sum_{t=0}^{t=\tau}{\frac{\partial J}{\partial \boldsymbol{\theta}^{(t)}}}. With this gradient \frac{\partial J}{\partial \boldsymbol{\theta}} , you can finally renew the value of \boldsymbol{\theta} one time.

At the beginning of this article I mentioned that simple RNNs are no longer for practical uses, and that comes from exploding/vanishing problem of RNN. This problem was one of the reasons for the AI winter which lasted for some 20 years. In the next article I am going to write about LSTM, a fancier type of RNN, in the context of a history of neural network history.

* I make study materials on machine learning, sponsored by DATANOMIQ. I do my best to make my content as straightforward but as precise as possible. I include all of my reference sources. If you notice any mistakes in my materials, including grammatical errors, please let me know (email: yasuto.tamura@datanomiq.de). And if you have any advice for making my materials more understandable to learners, I would appreciate hearing it.

 How Text to Speech Voices Are Used In Data Science

To speak on voices, text to speech platforms are bringing versatility to a new scale by implementing voices that sound more personal and less like a robot. As these services gain traction, vocal quality, and implementation improve to give sounds that feel like they’re speaking to you from a human mouth.

The intention of most text to speech platforms have always been to provide experiences that users feel comfortable using. Voices are a huge part of that, so great strides have been taken to ensure that they sound right.

How Voices are Utilized

Voices in the text to speech are generated by a computer itself. As the computer-generated voices transcribe the text into oral responses, they make up what we hear as dialogue read to us. These voice clips initially had the problem of sounding robotic and unpersonable as they were pulled digitally together. Lately, though, the technology has improved to bring faster response time in transcribing words, as well as seamlessly stringing together. This has brought the advantage of making a computer-generated voice sound much more natural and human. As people seek to connect more with the works they read, having a human-sounding voice is a huge step in letting listeners relate to their works.

To give an example of where this works, you might have a GPS in your car. The GPS has a function where it will transcribe the car’s route and tell you each instruction. Some GPS companies have made full use of this feature and added fun voices to help entertain drivers. These include Darth Vader and Yoda from Star Wars or having Morgan Freeman and Homer Simpson narrate your route. Different voice types are utilized in services depending on the situation. Professional uses like customer service centers will keep automated voices sounding professional and courteous when assisting customers. Educational systems will keep softer and kinder sounding voices to help sound more friendly with students.

When compared to older solutions, the rise of vocal variety in Text to Speech services has taken huge leaps as more people see the value of having a voice that they can connect to. Expressive voices and emotional variance are being applied to voices to help further convey this, with happy or sad sounding voices being implemented wherever appropriate. As time goes on, these services will get better at the reading context within sentences to apply emotion and tone at the correct times, and improve overall vocal quality as well. These reinvent past methods by advancing the once static and robotic sounds that used to be commonplace among text to voice services.

More infrastructures adopt these services to expand their reach to consumers who might not have the capabilities to utilize their offerings.  Having clear and relatable voices matter because customers and users will be drawn to them considerably more than if they chose not to offer them at all. In the near future text to speech voices will develop even further, enhancing the way people of all kinds connect to the words they read.

Simple RNN

Prerequisites for understanding RNN at a more mathematical level

Writing the A gentle introduction to the tiresome part of understanding RNN Article Series on recurrent neural network (RNN) is nothing like a creative or ingenious idea. It is quite an ordinary topic. But still I am going to write my own new article on this ordinary topic because I have been frustrated by lack of sufficient explanations on RNN for slow learners like me.

I think many of readers of articles on this website at least know that RNN is a type of neural network used for AI tasks, such as time series prediction, machine translation, and voice recognition. But if you do not understand how RNNs work, especially during its back propagation, this blog series is for you.

After reading this articles series, I think you will be able to understand RNN in more mathematical and abstract ways. But in case some of the readers are allergic or intolerant to mathematics, I tried to use as little mathematics as possible.

Ideal prerequisite knowledge:

  • Some understanding on densely connected layers (or fully connected layers, multilayer perception) and how their forward/back propagation work.
  •  Some understanding on structure of Convolutional Neural Network.

*In this article “Densely Connected Layers” is written as “DCL,” and “Convolutional Neural Network” as “CNN.”

1, Difficulty of Understanding RNN

I bet a part of difficulty of understanding RNN comes from the variety of its structures. If you search “recurrent neural network” on Google Image or something, you will see what I mean. But that cannot be helped because RNN enables a variety of tasks.

Another major difficulty of understanding RNN is understanding its back propagation algorithm. I think some of you found it hard to understand chain rules in calculating back propagation of densely connected layers, where you have to make the most of linear algebra. And I have to say backprop of RNN, especially LSTM, is a monster of chain rules. I am planing to upload not only a blog post on RNN backprop, but also a presentation slides with animations to make it more understandable, in some external links.

In order to avoid such confusions, I am going to introduce a very simplified type of RNN, which I call a “simple RNN.” The RNN displayed as the head image of this article is a simple RNN.

2, How Neurons are Connected

    \begin{equation*}   1 = 3 - 2 \end{equation*}

How to connect neurons and how to activate them is what neural networks are all about. Structures of those neurons are easy to grasp as long as that is about DCL or CNN. But when it comes to the structure of RNN, many study materials try to avoid showing that RNNs are also connections of neurons, as well as DCL or CNN(*If you are not sure how neurons are connected in CNN, this link should be helpful. Draw a random digit in the square at the corner.). In fact the structure of RNN is also the same, and as long as it is a simple RNN, and it is not hard to visualize its structure.

Even though RNN is also connections of neurons, usually most RNN charts are simplified, using blackboxes. In case of simple RNN, most study material would display it as the chart below.

But that also cannot be helped because fancier RNN have more complicated connections of neurons, and there are no longer advantages of displaying RNN as connections of neurons, and you would need to understand RNN in more abstract way, I mean, as you see in most of textbooks.

I am going to explain details of simple RNN in the next article of this series.

3, Neural Networks as Mappings

If you still think that neural networks are something like magical spider webs or models of brain tissues, forget that. They are just ordinary mappings.

If you have been allergic to mathematics in your life, you might have never heard of the word “mapping.” If so, at least please keep it in mind that the equation y=f(x), which most people would have seen in compulsory education, is a part of mapping. If you get a value x, you get a value y corresponding to the x.

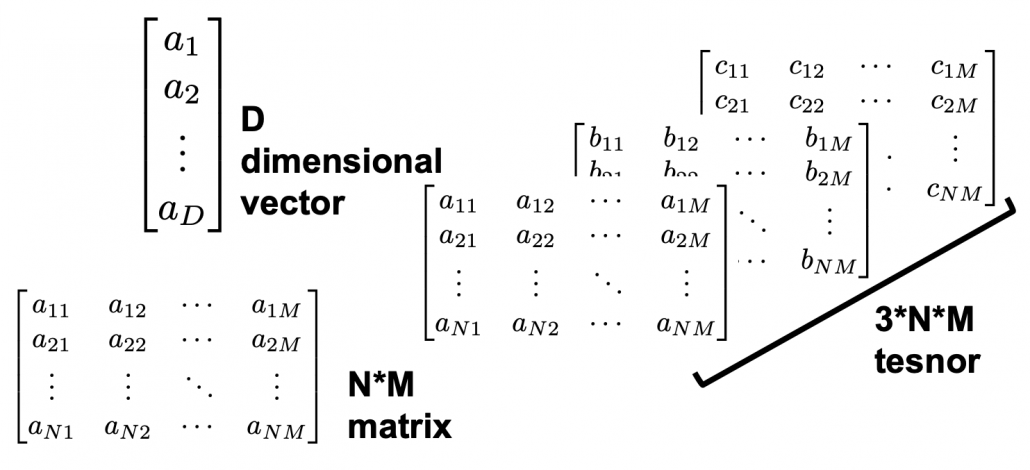
But in case of deep learning, x is a vector or a tensor, and it is denoted with \boldsymbol{x} . If you have never studied linear algebra , imagine that a vector is a column of Excel data (only one column), a matrix is a sheet of Excel data (with some rows and columns), and a tensor is some sheets of Excel data (each sheet does not necessarily contain only one column.)

CNNs are mainly used for image processing, so their inputs are usually image data. Image data are in many cases (3, hight, width) tensors because usually an image has red, blue, green channels, and the image in each channel can be expressed as a hight*width matrix (the “height” and the “width” are number of pixels, so they are discrete numbers).

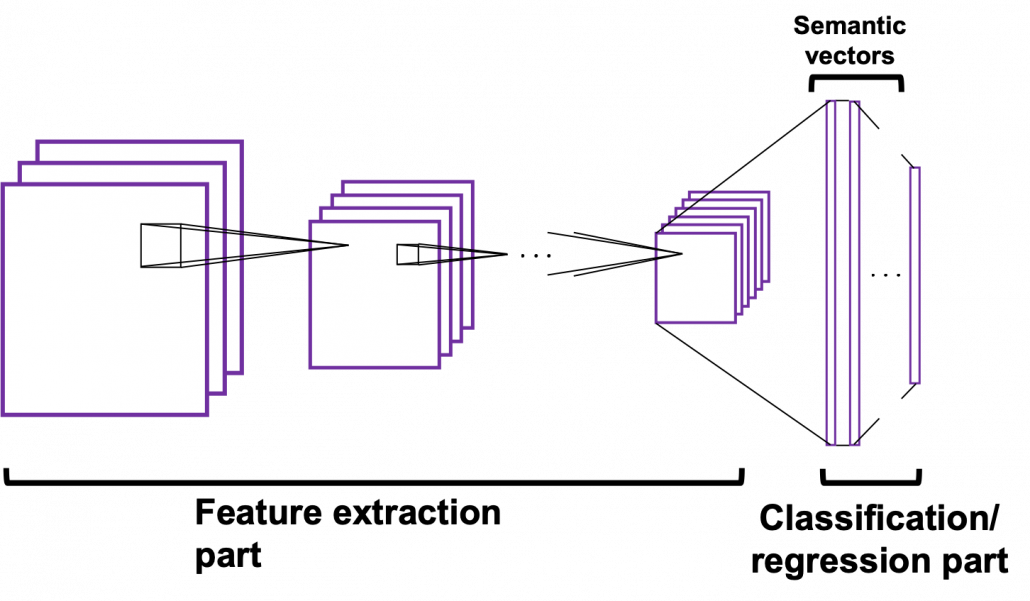
The convolutional part of CNN (which I call “feature extraction part”) maps the tensors to a vector, and the last part is usually DCL, which works as classifier/regressor. At the end of the feature extraction part, you get a vector. I call it a “semantic vector” because the vector has information of “meaning” of the input image. In this link you can see maps of pictures plotted depending on the semantic vector. You can see that even if the pictures are not necessarily close pixelwise, they are close in terms of the “meanings” of the images.

In the example of a dog/cat classifier introduced by François Chollet, the developer of Keras, the CNN maps (3, 150, 150) tensors to 2-dimensional vectors, (1, 0) or (0, 1) for (dog, cat).

Wrapping up the points above, at least you should keep two points in mind: first, DCL is a classifier or a regressor, and CNN is a feature extractor used for image processing. And another important thing is, feature extraction parts of CNNs map images to vectors which are more related to the “meaning” of the image.

Importantly, I would like you to understand RNN this way. An RNN is also just a mapping.

*I recommend you to at least take a look at the beautiful pictures in this link. These pictures give you some insight into how CNN perceive images.

4, Problems of DCL and CNN, and needs for RNN

Taking an example of RNN task should be helpful for this topic. Probably machine translation is the most famous application of RNN, and it is also a good example of showing why DCL and CNN are not proper for some tasks. Its algorithms is out of the scope of this article series, but it would give you a good insight of some features of RNN. I prepared three sentences in German, English, and Japanese, which have the same meaning. Assume that each sentence is divided into some parts as shown below and that each vector corresponds to each part. In machine translation we want to convert a set of the vectors into another set of vectors.

Then let’s see why DCL and CNN are not proper for such task.

  • The input size is fixed: In case of the dog/cat classifier I have mentioned, even though the sizes of the input images varies, they were first molded into (3, 150, 150) tensors. But in machine translation, usually the length of the input is supposed to be flexible.
  • The order of inputs does not mater: In case of the dog/cat classifier the last section, even if the input is “cat,” “cat,” “dog” or “dog,” “cat,” “cat” there’s no difference. And in case of DCL, the network is symmetric, so even if you shuffle inputs, as long as you shuffle all of the input data in the same way, the DCL give out the same outcome . And if you have learned at least one foreign language, it is easy to imagine that the orders of vectors in sequence data matter in machine translation.

*It is said English language has phrase structure grammar, on the other hand Japanese language has dependency grammar. In English, the orders of words are important, but in Japanese as long as the particles and conjugations are correct, the orders of words are very flexible. In my impression, German grammar is between them. As long as you put the verb at the second position and the cases of the words are correct, the orders are also relatively flexible.

5, Sequence Data

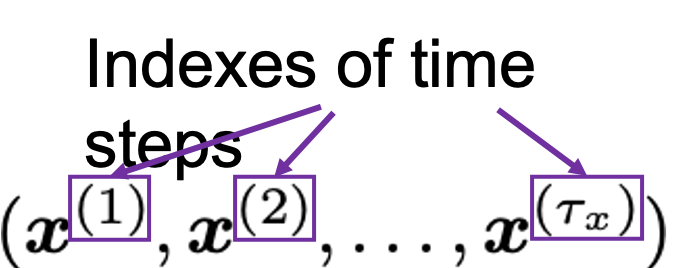
We can say DCL and CNN are not useful when you want to process sequence data. Sequence data are a type of data which are lists of vectors. And importantly, the orders of the vectors matter. The number of vectors in sequence data is usually called time steps. A simple example of sequence data is meteorological data measured at a spot every ten minutes, for instance temperature, air pressure, wind velocity, humidity. In this case the data is recorded as 4-dimensional vector every ten minutes.

But this “time step” does not necessarily mean “time.” In case of natural language processing (including machine translation), which you I mentioned in the last section, the numberings of each vector denoting each part of sentences are “time steps.”
And RNNs are mappings from a sequence data to another sequence data.

*At least I found a paper on the RNN’s capability of universal approximation on many-to-one RNN task. But I have not found any papers on universal approximation of many-to-many RNN tasks. Please let me know if you find any clue on whether such approximation is possible. I am desperate to know that. 

6, Types of RNN Tasks

RNN tasks can be classified into some types depending on the lengths of input/output sequences (the “length” means the times steps of input/output sequence data).

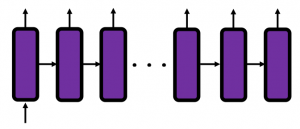
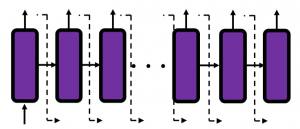
If you want to predict the temperature in 24 hours, based on several time series data points in the last 96 hours, the task is many-to-one. If you sample data every ten minutes, the input size is 96*6=574 (the input data is a list of 574 vectors), and the output size is 1 (which is a value of temperature). Another example of many-to-one task is sentiment classification. If you want to judge whether a post on SNS is positive or negative, the input size is very flexible (the length of the post varies.) But the output size is one, which is (1, 0) or (0, 1), which denotes (positive, negative).

*The charts in this section are simplified model of RNN used for each task. Please keep it in mind that they are not 100% correct, but I tried to make them as exact as possible compared to those in other study materials.

Music/text generation can be one-to-many tasks. If you give the first sound/word you can generate a phrase.

Next, let’s look at many-to-many tasks. Machine translation and voice recognition are likely to be major examples of many-to-many tasks, but here name entity recognition seems to be a proper choice. Name entity recognition is task of finding proper noun in a sentence . For example if you got two sentences “He said, ‘Teddy bears on sale!’ ” and ‘He said, “Teddy Roosevelt was a great president!” ‘ judging whether the “Teddy” is a proper noun or a normal noun is name entity recognition.

Machine translation and voice recognition, which are more popular, are also many-to-many tasks, but they use more sophisticated models. In case of machine translation, the inputs are sentences in the original language, and the outputs are sentences in another language. When it comes to voice recognition, the input is data of air pressure at several time steps, and the output is the recognized word or sentence. Again, these are out of the scope of this article but I would like to introduce the models briefly.
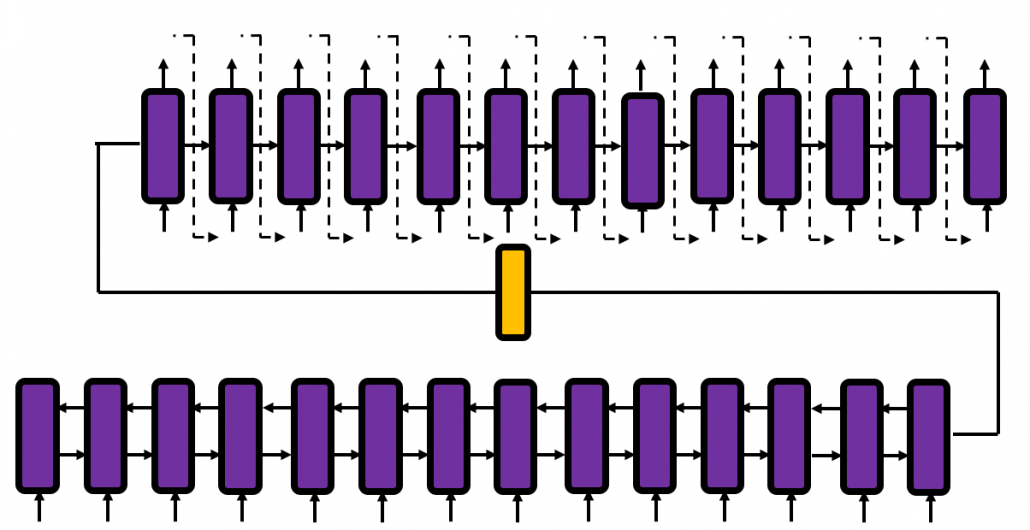
Machine translation uses a type of RNN named sequence-to-sequence model (which is often called seq2seq model). This model is also very important for other natural language processes tasks in general, such as text summarization. A seq2seq model is divided into the encoder part and the decoder part. The encoder gives out a hidden state vector and it used as the input of the decoder part. And decoder part generates texts, using the output of the last time step as the input of next time step.

Voice recognition is also a famous application of RNN, but it also needs a special type of RNN.

*To be honest, I don’t know what is the state-of-the-art voice recognition algorithm. The example in this article is a combination of RNN and a collapsing function made using Connectionist Temporal Classification (CTC). In this model, the output of RNN is much longer than the recorded words or sentences, so a collapsing function reduces the output into next output with normal length.

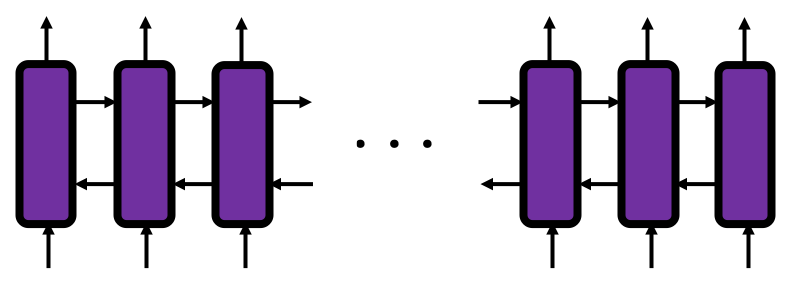
You might have noticed that RNNs in the charts above are connected in both directions. Depending on the RNN tasks you need such bidirectional RNNs.  I think it is also easy to imagine that such networks are necessary. Again, machine translation is a good example.

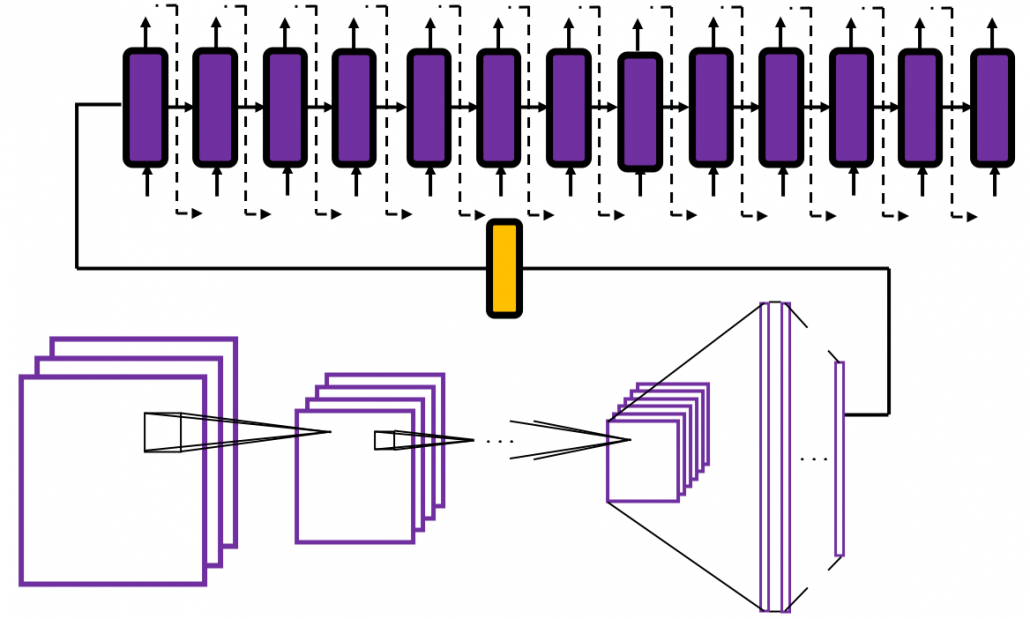
And interestingly, image captioning, which enables a computer to describe a picture, is one-to-many-task. As the output is a sentence, it is easy to imagine that the output is “many.” If it is a one-to-many task, the input is supposed to be a vector.

Where does the input come from? I told you that I was obsessed with the beauty of the last vector of the feature extraction part of CNN. Surprisingly the the “beautiful” vector, which I call a “semantic vector” is the input of image captioning task (after some transformations, depending on the network models).

I think this articles includes major things you need to know as prerequisites when you want to understand RNN at more mathematical level. In the next article, I would like to explain the structure of a simple RNN, and how it forward propagate.

* I make study materials on machine learning, sponsored by DATANOMIQ. I do my best to make my content as straightforward but as precise as possible. I include all of my reference sources. If you notice any mistakes in my materials, please let me know (email: yasuto.tamura@datanomiq.de). And if you have any advice for making my materials more understandable to learners, I would appreciate hearing it.
Introduction to Recommendation Engines

This is the second article of article series Getting started with the top eCommerce use cases. If you are interested in reading the first article you can find it here.
What are Recommendation Engines?

Recommendation engines are the automated systems which helps select out similar things whenever a user selects something online. Be it Netflix, Amazon, Spotify, Facebook or YouTube etc. All of these companies are now using some sort of recommendation engine to improve their user experience. A recommendation engine not only helps to predict if a user prefers an item or not but also helps to increase sales, ,helps to understand customer behavior, increase number of registered users and helps a user to do better time management. For instance Netflix will suggest what movie you would want to watch or Amazon will suggest what kind of other products you might want to buy. All the mentioned platforms operates using the same basic algorithm in the background and in this article we are going to discuss the idea behind it.

What are the techniques?

There are two fundamental algorithms that comes into play when there’s a need to generate recommendations. In next section these techniques are discussed in detail.

Content-Based Filtering

The idea behind content based filtering is to analyse a set of features which will provide a similarity between items themselves i.e. between two movies, two products or two songs etc. These set of features once compared gives a similarity score at the end which can be used as a reference for the recommendations.

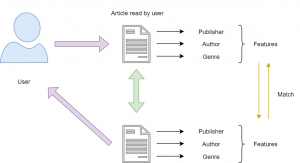
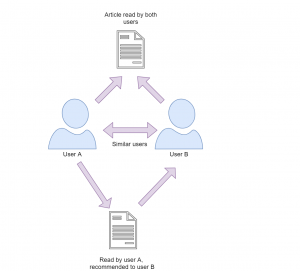
There are several steps involved to get to this similarity score and the first step is to construct a profile for each item by representing some of the important features of that item. In other terms, this steps requires to define a set of characteristics that are discovered easily. For instance, consider that there’s an article which a user has already read and once you know that this user likes this article you may want to show him recommendations of similar articles. Now, using content based filtering technique you could find the similar articles. The easiest way to do that is to set some features for this article like publisher, genre, author etc. Based on these features similar articles can be recommended to the user (as illustrated in Figure 1). There are three main similarity measures one could use to find the similar articles mentioned below.


Figure 1: Content-Based Filtering


Minkowski distance

Minkowski distance between two variables can be calculated as:

(x,y)= (\sum_{i=1}^{n}{|X_{i} - Y_{i}|^{p}})^{1/p}


Cosine Similarity

Cosine similarity between two variables can be calculated as :

  \mbox{Cosine Similarity} = \frac{\sum_{i=1}^{n}{x_{i} y_{i}}} {\sqrt{\sum_{i=1}^{n}{x_{i}^{2}}} \sqrt{\sum_{i=1}^{n}{y_{i}^{2}}}} \


Jaccard Similarity


  J(X,Y) = |X ∩ Y| / |X ∪ Y|


These measures can be used to create a matrix which will give you the similarity between each movie and then a function can be defined to return the top 10 similar articles.


Collaborative filtering

This filtering method focuses on finding how similar two users or two products are by analyzing user behavior or preferences rather than focusing on the content of the items. For instance consider that there are three users A,B and C.  We want to recommend some movies to user A, our first approach would be to find similar users and compare which movies user A has not yet watched and recommend those movies to user A.  This approach where we try to find similar users is called as User-User Collaborative Filtering.  

The other approach that could be used here is when you try to find similar movies based on the ratings given by others, this type is called as Item-Item Collaborative Filtering. The research shows that item-item collaborative filtering works better than user-user collaborative filtering as user behavior is really dynamic and changes over time. Also, there are a lot more users and increasing everyday but on the other side item characteristics remains the same. To calculate the similarities we can use Cosine distance.


Figure 2: Collaborative Filtering


Recently some companies have started to take advantage of both content based and collaborative filtering techniques to make a hybrid recommendation engine. The results from both models are combined into one hybrid model which provides more accurate recommendations. Five steps are involved to make a recommendation engine work which are collection of data, storing of data, analyzing the data, filtering the data and providing recommendations. There are a lot of attributes that are involved in order to collect user data including browsing history, page views, search logs, order history, marketing channel touch points etc. which requires a strong data architecture.  The collection of data is pretty straightforward but it can be overwhelming to analyze this amount of data. Storing this data could get tricky on the other hand as you need a scalable database for this kind of data. With the rise of graph databases this area is also improving for many use cases including recommendation engines. Graph databases like Neo4j can also help to analyze and find similar users and relationship among them. Analyzing the data can be carried in different ways, depending on how strong and scalable your architecture you can run real time, batch or near real time analysis. The fourth step involves the filtering of the data and here you can use any of the above mentioned approach to find similarities to finally provide the recommendations.

Having a good recommendation engine can be time consuming initially but it is definitely beneficial in the longer run. It not only helps to generate revenue but also helps to to improve your product catalog and customer service.

Best machine learning algorithms you should know

Machine learning is a key technology tool businesses use to build tools that enhance their operations. To do that, they take advantage of machine learning algorithms that come in different shapes and sizes, servicing different purposes and working on different data sets. Choosing the right algorithm for the job is what makes machine learning and deep learning projects successful. That’s why being aware of all the different types of machine learning algorithms is so important – that’s how you get better results and build more advanced solutions.

Here’s an overview of the best machine learning algorithms you should know before starting your project.

What is meant by machine learning algorithms?

First things first, what is machine learning and how do algorithms fit into the picture? A machine learning (ML) algorithm is a process or set of procedures that allow a model to adapt to the data with a specific objective set as the goal.

An ML algorithm specifies how the data is transformed from the input to output, helping the model to learn the appropriate mapping from input to output. That model specifies the mapping functions and holds the parameters in place, while the machine learning algorithm updates the parameters to help the model match its goal.

What are the algorithms used in machine learning?

Algorithms can model problems in many different ways. The easiest way to differentiate between different ML algorithms is by comparing them by learning styles that they can adapt. Generally, machine learning algorithms can adapt to several learning styles that help to solve different problems.

Here are four learning styles in machine learning you need to know:

1 Supervised learning

In supervised learning, the input data serves as training data and comes with a known label or result – for example, the price at a time or spam/not-spam.

In this variant, the training process is critical for preparing a model that makes predictions and then is corrected when the predictions are wrong. The training process continues until the model achieves the appropriate level of accuracy. Classification and regression are examples of problems for this learning type.


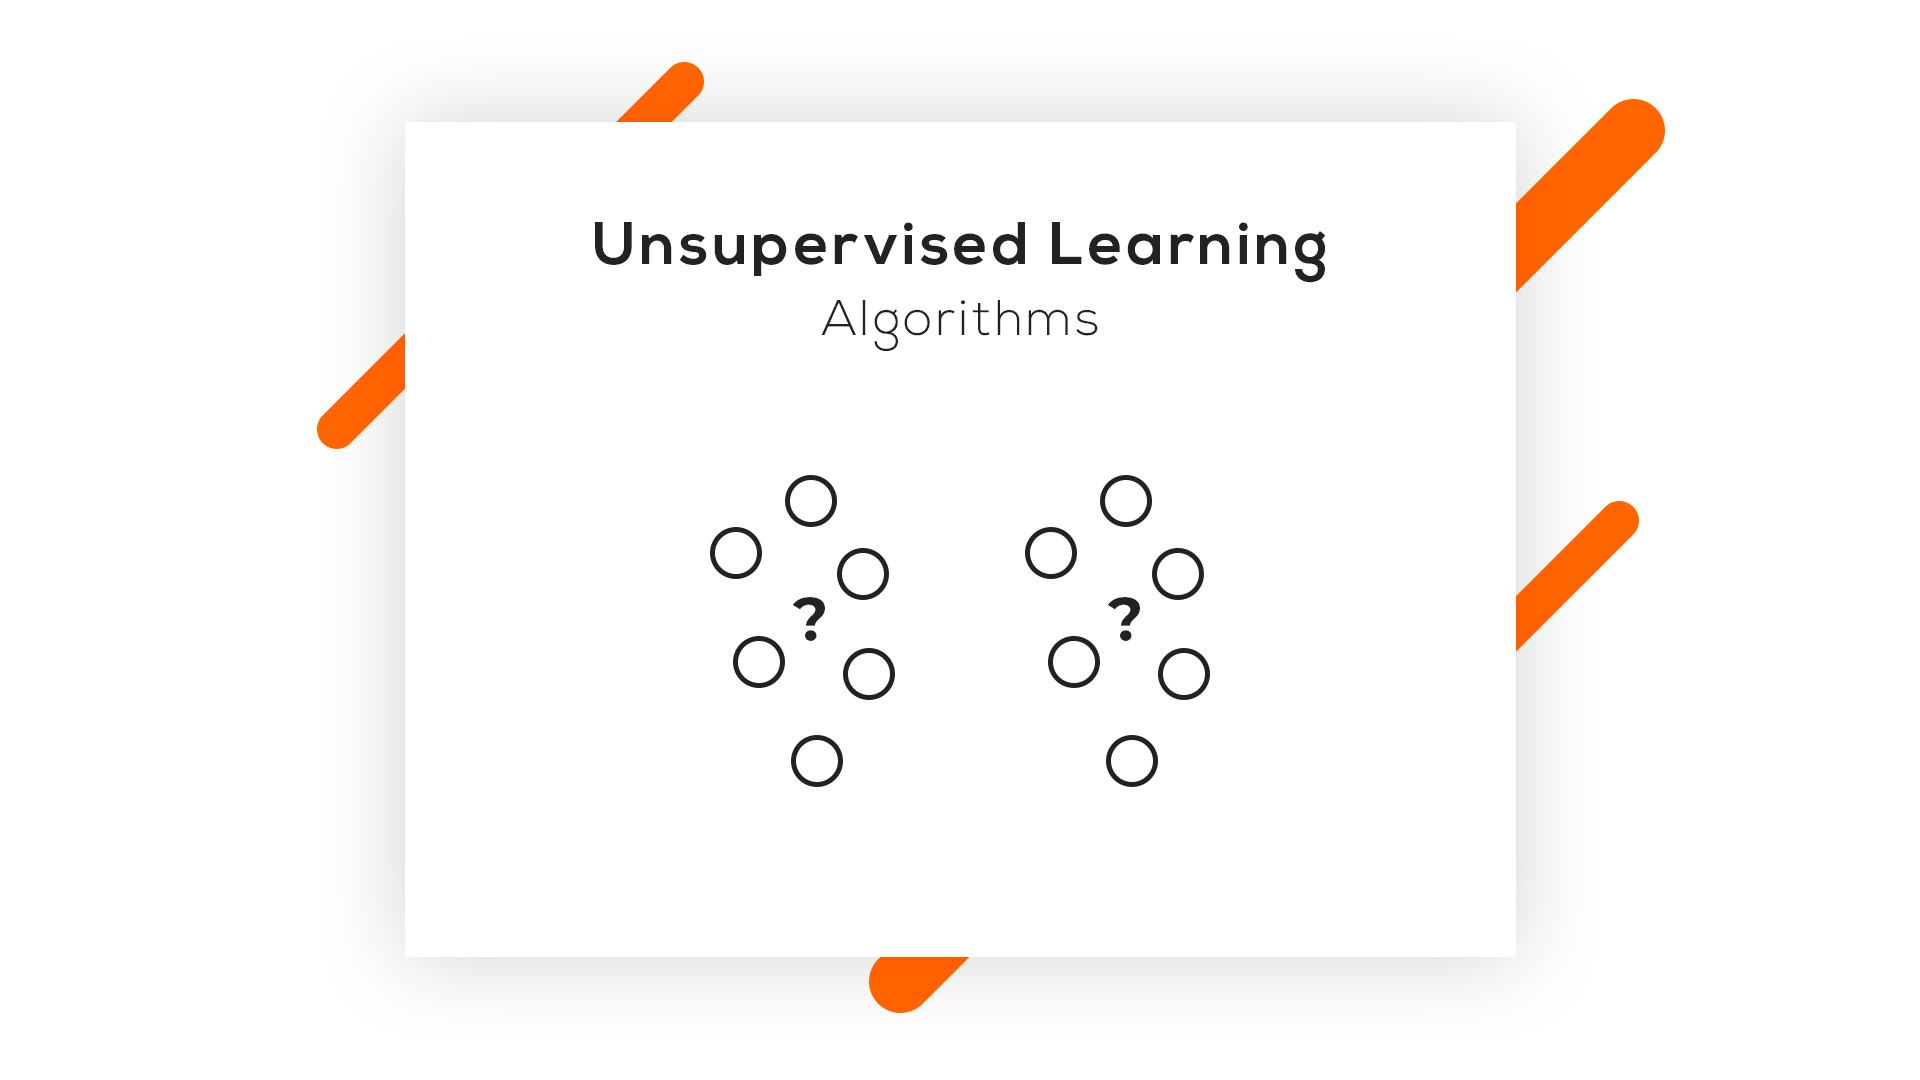
2 Unsupervised learning

In unsupervised learning, input data isn’t labeled and doesn’t come with a known result. Data scientists prepare models by deducing the structures in the input data to extract general rules or reduce redundancy through mathematical processes. Unsupervised learning addresses problems such as association rule learning, dimensionality reduction, and clustering.

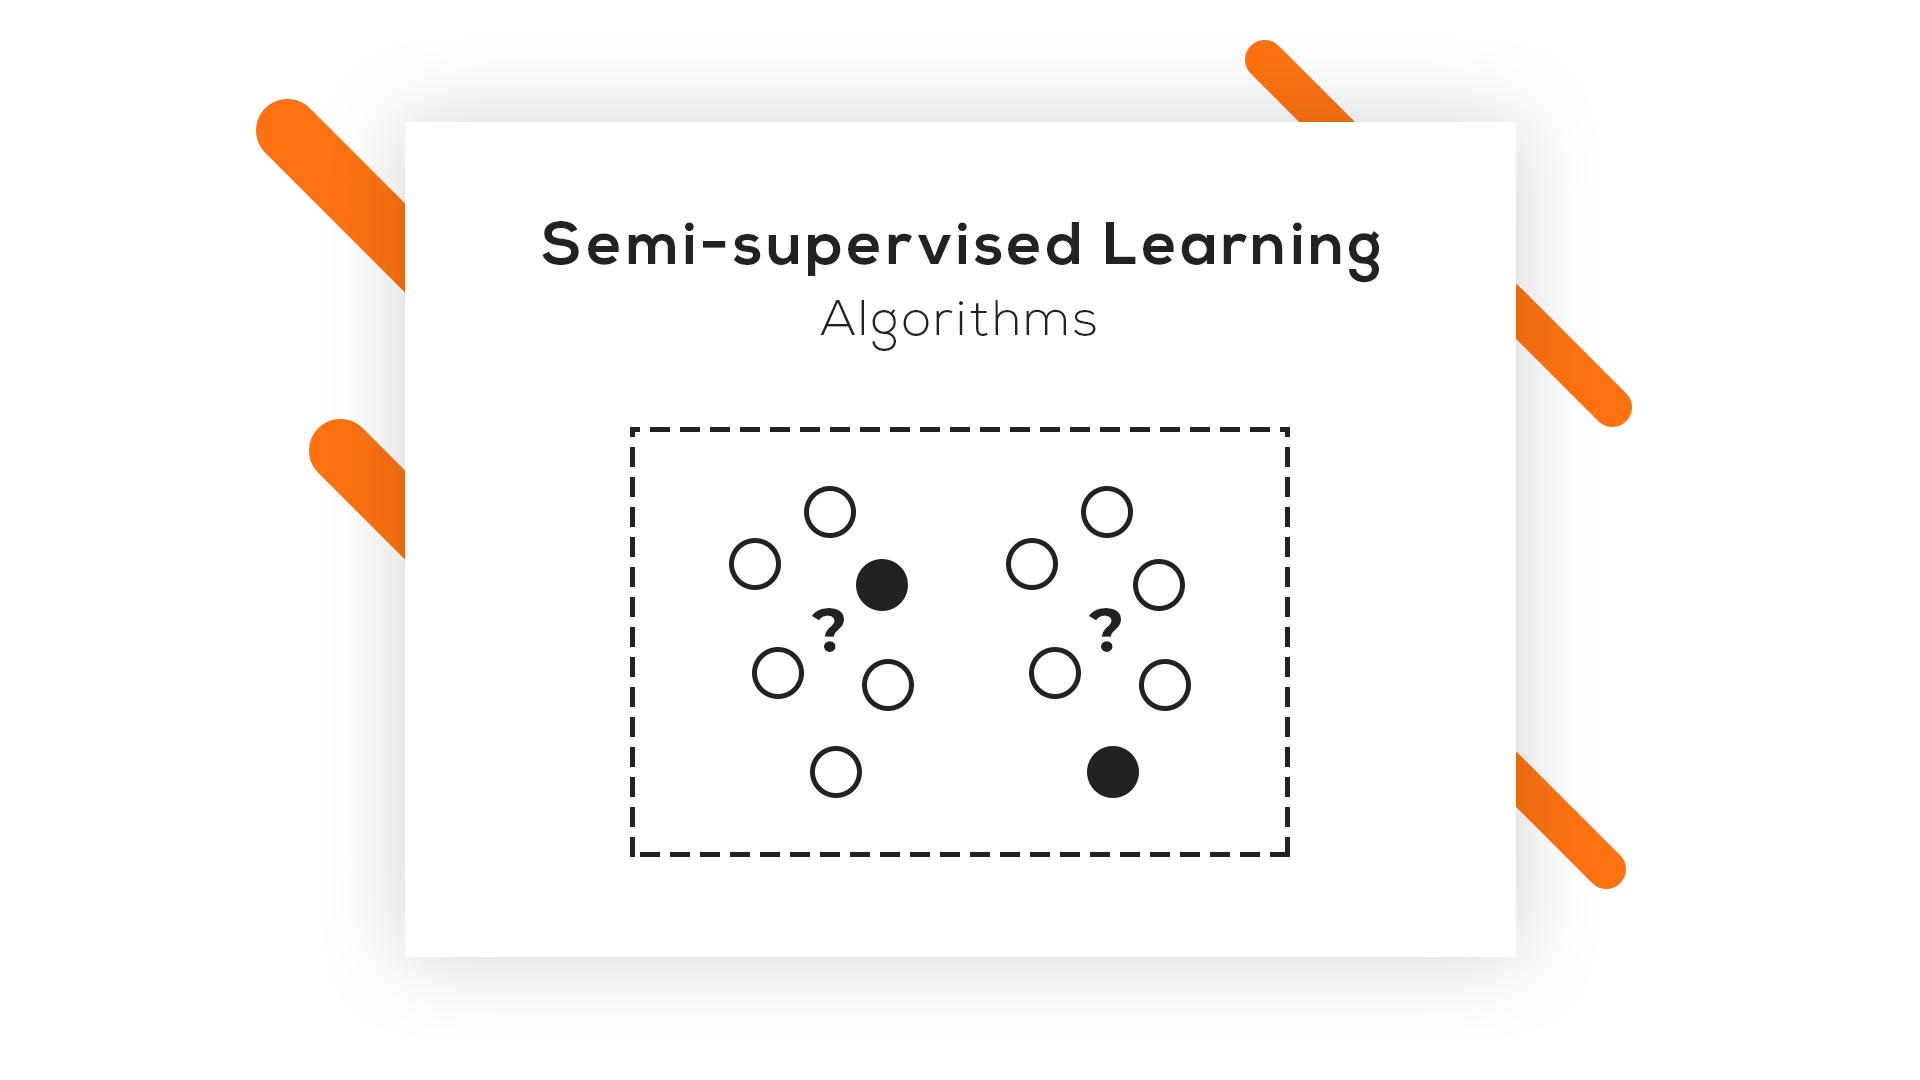
3 Semi-supervised learning

In this learning style, the input data is a mixture of labeled and unlabeled examples. The prediction problem is known, but the model needs to learn the structures for organizing data and making predictions on its own. This learning style is used to address problems such as regression and classification.

4 Reinforcement learning

One of three basic machine learning paradigms together with supervised learning and unsupervised learning, reinforcement learning (RL) is an area of machine learning that focuses on the ways in which software agents should take actions to maximize a specified notion of cumulative reward in a given environment.

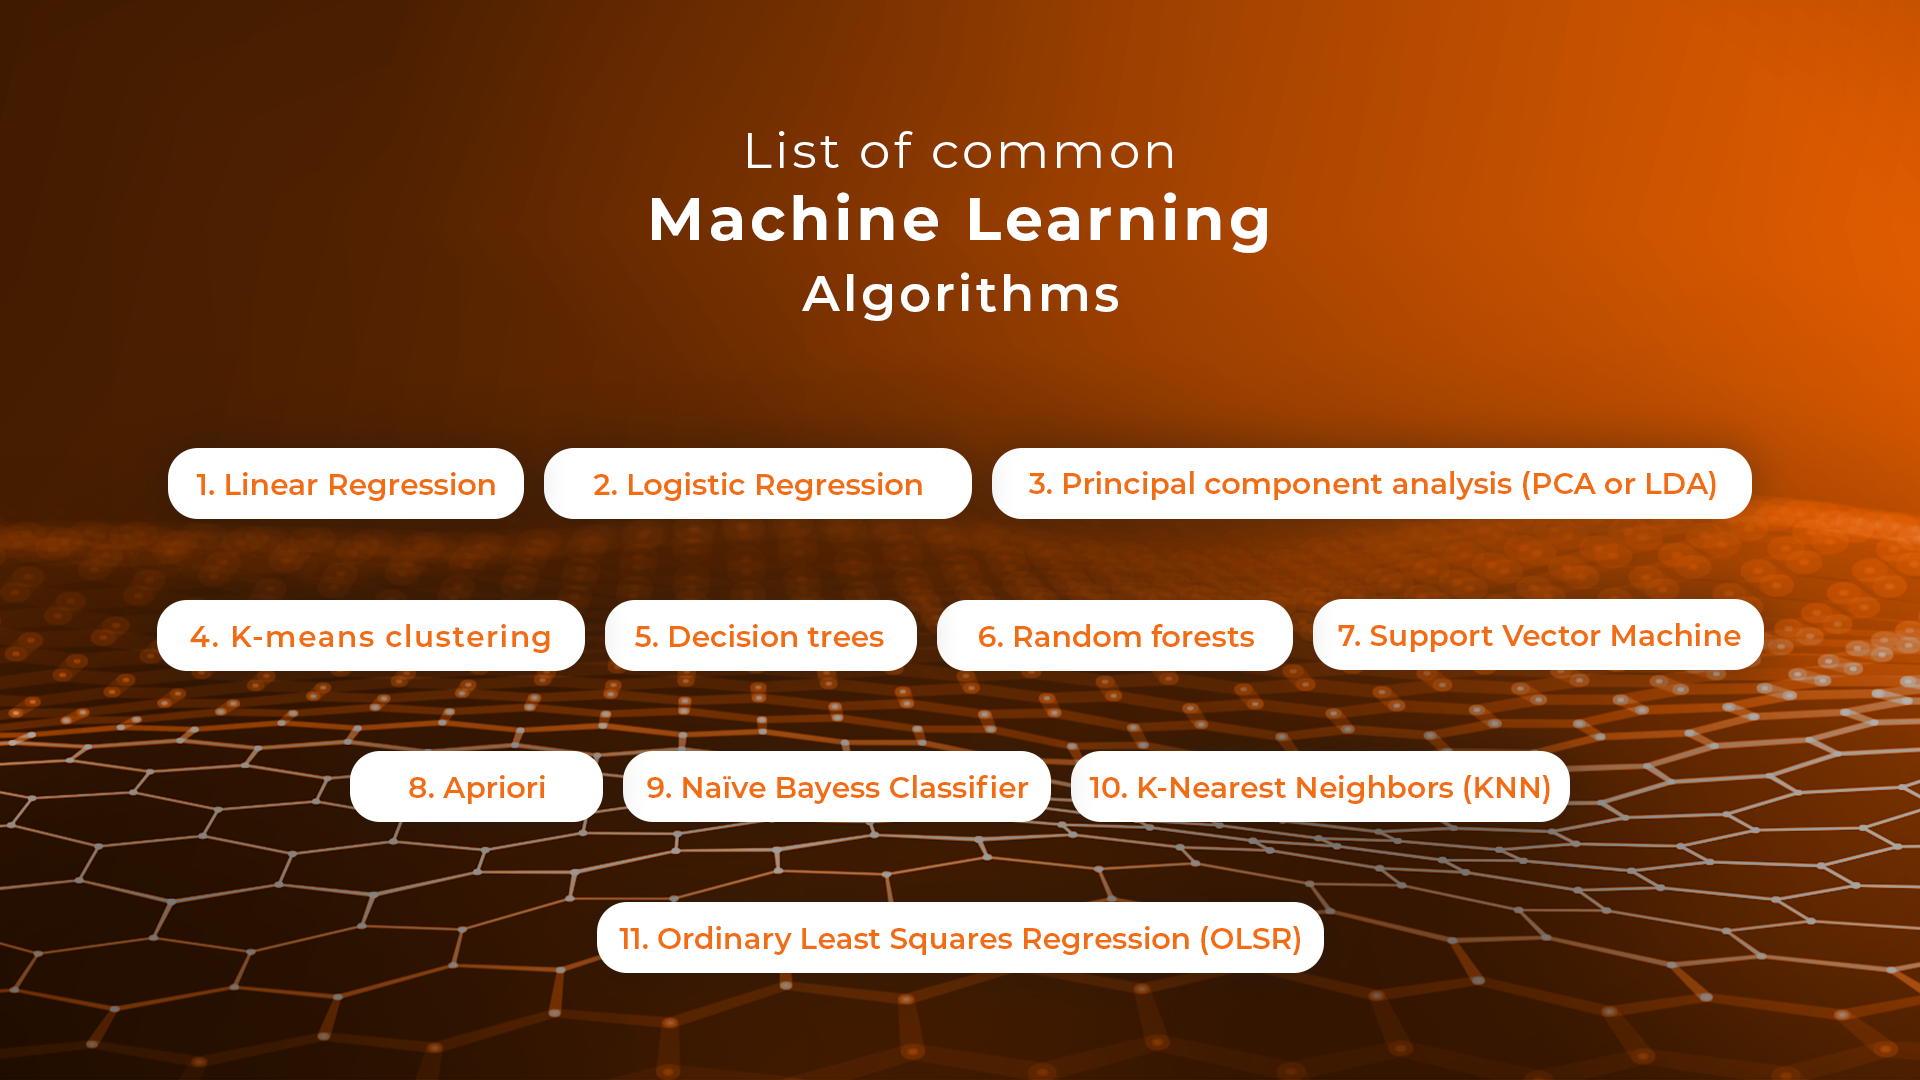
The best machine learning algorithms you should know

1 Linear Regression

Linear regression is an algorithm that correlates between two variables in the data set, examining the input and output sets to show a relationship between them. For example, the algorithm can show how changing one of the input variables affects the other variable. The relationship is represented by plotting a line on the graph.

Linear regression is one of the most popular algorithms in machine learning because it’s transparent and requires no tuning to work. Practical applications of this algorithm are risk assessment or sales forecasting solutions.

2 Logistic regression

Logistic regression is a type of constrained Linear Regression with a non-linearity application after you apply weights. Note that this algorithm is used for classification, not regression. The algorithm restricts the outputs close to +/- classes (and 1 and 0 in the case of sigmoid) and can be trained with Gradient Descent or L-BFGS.

Logistic regression is used in Natural Language Processing (NLP) applications, where it often appears under the name of Maximum Entropy Classifier.

3 Principal component analysis (PCA or LDA)

Principal component analysis is an unsupervised method that helps data scientists to understand better the global properties of a data set that consists of vectors. It analyzes the covariance matrix of data points to learn which dimensions/data points have high variance among themselves and low covariance with others. The algorithm helps data scientists to get data points with reduced dimensions.

4 K-means clustering

K- means clustering is a type of unsupervised clustering algorithm that sorts data sets through defined clusters. It offers results in the form of groups based on internal patterns.

For example, you can use a K-means algorithm for sorting web results for the word “cat,” and it will show all the results in the form of groups. The main advantage of this algorithm is its accuracy as it provides data groupings faster than other algorithms.


5 Decision trees

A decision tree is made of various branches that represent the outcome of many decisions. This algorithm collects and graphs data in multiple branches to predict response variables on the basis of past decisions. It comes in handy for mapping our decisions and presents results visually to communicate findings easily.

Decision trees work best for smaller data sets and relatively low-stake decisions – otherwise, the long-tail visuals can be hard to decipher. The key advantage of this algorithm is that it allows showing multiple outcomes and tests without having to involve data scientists – it’s easy to use.

6 Random forests

A random forest consists of a great number of individual decision trees where they all operate as an ensemble. An individual tree in the random forest generates a class prediction – the class which receives the highest number of votes becomes the model’s prediction. Having many relatively uncorrelated models (trees) operating as a committee easily outperforms individual constituent models.

The low correlation between these models is the strength of this approach because it allows producing ensemble predictions that are far more accurate than individual predictions. Note that decisions trees protect each other from individual errors. While some trees may generate false predictions, others will generate the right ones – as a group; they will be able to move in the right direction.

7 Support Vector Machine

Support Vector Machines (SVMs) are linear models similar to linear or logistic regression we’ve discussed earlier. However, there’s one difference – they have a different margin-based loss function, which can be optimized by using methods such as L-BFGS or SGD. SVMs internally analyze data sets into classes, which is helpful for future classifications.

The main idea behind SVM is separating data into classes and maximizing the margins of entering future data into classes. This type of algorithm works best for training data. However, it can also serve as a tool for processing nonlinear data. The financial sector makes use of Support Vector Machines thanks to its accuracy in classifying both current and future data sets.

8 Apriori

The Apriori algorithm is used a lot in market analysis. It’s based on the principle of Apriori and checks for positive and negative correlations between products after analyzing values in data sets.

For example, if two values often correlate in a data set, the algorithm will conclude that A will often lead to B, referring to the information in data sets. For example, if customers often buy product A and product B together, this relation will hold a high percentage and help companies like Google or Amazon to predict product searches and purchases.

9 Naive Bayes Classifier

This handy classification technique is based on Bayes’ Theorem, which assumes independence among predictors. The algorithm will assume that the presence of a specific feature in a class is not related to the presence of any other feature in the same class.

For example, a fruit may be considered a banana if it’s yellow, curved, and about 15 cm long. These features depend on each other, and on the existence of hooter features, they all independently contribute to the probability that this fruit is a banana. That’s why the algorithm bears the name “Naive.”

The algorithm offers a model that is easy to build and helpful in handling very large data sets. It can outperform the most sophisticated classification methods.

10 K-Nearest Neighbors (KNN)

This is one of the simplest algorithm types used in machine learning for classification and regression. KNN algorithms classify new data points on the basis of similarity measures, such as the distance function. They perform classification by using a majority vote of the data points’ neighbors. They then assign data to the class, which has the nearest neighbors. Together with increasing the number of nearest neighbors (the value of k), the accuracy may increase as well.

11 Ordinary Least Squares Regression (OLSR)

Ordinary Least Squares Regression (OLSR) is a generalized linear modeling technique data scientists use for estimating unknown parameters that are part of a linear regression model. OLSR describes the relationship between a dependent variable and one or more of its independent variables.

The algorithm is applied in diverse fields such as economics, finance, medicine, and social sciences. Companies use it in machine learning and predictive analytics to dynamically predict specific outcomes on the basis of variables that change dynamically.

We hope that this machine learning algorithms list helps you pick the right tools of the trade for your next machine learning project. If you’d like to learn more about Machine Learning, Data Science and Web Development, visit the Sunscrapers company blog.

Visual Question Answering with Keras – Part 1

This is Part I of II of the Article Series Visual Question Answering with Keras

Making Computers Intelligent to answer from images

If we look closer in the history of Artificial Intelligence (AI), the Deep Learning has gained more popularity in the recent years and has achieved the human-level performance in the tasks such as Speech Recognition, Image Classification, Object Detection, Machine Translation and so on. However, as humans, not only we but also a five-year child can normally perform these tasks without much inconvenience. But the development of such systems with these capabilities has always considered an ambitious goal for the researchers as well as for developers.

In this series of blog posts, I will cover an introduction to something called VQA (Visual Question Answering), its available datasets, the Neural Network approach for VQA and its implementation in Keras and the applications of this challenging problem in real life. 

Table of Contents:

1 Introduction

2 What is exactly Visual Question Answering?

3 Prerequisites

4 Datasets available for VQA

4.1 DAQUAR Dataset

4.2 CLEVR Dataset

4.3 FigureQA Dataset

4.4 VQA Dataset

5 Real-life applications of VQA

6 Conclusion


  1. Introduction:

Let’s say you are given a below picture along with one question. Can you answer it?

I expect confidently you all say it is the Kitchen without much inconvenience which is also the right answer. Even a five-year child who just started to learn things might answer this question correctly.

Alright, but can you write a computer program for such type of task that takes image and question about the image as an input and gives us answer as output?

Before the development of the Deep Neural Network, this problem was considered as one of the difficult, inconceivable and challenging problem for the AI researcher’s community. However, due to the recent advancement of Deep Learning the systems are capable of answering these questions with the promising result if we have a required dataset.

Now I hope you have got at least some intuition of a problem that we are going to discuss in this series of blog posts. Let’s try to formalize the problem in the below section.

  1. What is exactly Visual Question Answering?:

We can define, “Visual Question Answering(VQA) is a system that takes an image and natural language question about the image as an input and generates natural language answer as an output.”

VQA is a research area that requires an understanding of vision(Computer Vision)  as well as text(NLP). The main beauty of VQA is that the reasoning part is performed in the context of the image. So if we have an image with the corresponding question then the system must able to understand the image well in order to generate an appropriate answer. For example, if the question is the number of persons then the system must able to detect faces of the persons. To answer the color of the horse the system need to detect the objects in the image. Many of these common problems such as face detection, object detection, binary object classification(yes or no), etc. have been solved in the field of Computer Vision with good results.

To summarize a good VQA system must be able to address the typical problems of CV as well as NLP.

To get a better feel of VQA you can try online VQA demo by CloudCV. You just go to this link and try uploading the picture you want and ask the related question to the picture, the system will generate the answer to it.


  1. Prerequisites:

In the next post, I will walk you through the code for this problem using Keras. So I assume that you are familiar with:

  1. Fundamental concepts of Machine Learning
  2. Multi-Layered Perceptron
  3. Convolutional Neural Network
  4. Recurrent Neural Network (especially LSTM)
  5. Gradient Descent and Backpropagation
  6. Transfer Learning
  7. Hyperparameter Optimization
  8. Python and Keras syntax
  1. Datasets available for VQA:

As you know problems related to the CV or NLP the availability of the dataset is the key to solve the problem. The complex problems like VQA, the dataset must cover all possibilities of questions answers in real-world scenarios. In this section, I will cover some of the datasets available for VQA.

4.1 DAQUAR Dataset:

The DAQUAR dataset is the first dataset for VQA that contains only indoor scenes. It shows the accuracy of 50.2% on the human baseline. It contains images from the NYU_Depth dataset.

Example of DAQUAR dataset

Example of DAQUAR dataset

The main disadvantage of DAQUAR is the size of the dataset is very small to capture all possible indoor scenes.

4.2 CLEVR Dataset:

The CLEVR Dataset from Stanford contains the questions about the object of a different type, colors, shapes, sizes, and material.

It has

  • A training set of 70,000 images and 699,989 questions
  • A validation set of 15,000 images and 149,991 questions
  • A test set of 15,000 images and 14,988 questions

Image Source: https://cs.stanford.edu/people/jcjohns/clevr/?source=post_page


4.3 FigureQA Dataset:

FigureQA Dataset contains questions about the bar graphs, line plots, and pie charts. It has 1,327,368 questions for 100,000 images in the training set.

4.4 VQA Dataset:

As comapred to all datasets that we have seen so far VQA dataset is relatively larger. The VQA dataset contains open ended as well as multiple choice questions. VQA v2 dataset contains:

  • 82,783 training images from COCO (common objects in context) dataset
  • 40, 504 validation images and 81,434 validation images
  • 443,757 question-answer pairs for training images
  • 214,354 question-answer pairs for validation images.

As you might expect this dataset is very huge and contains 12.6 GB of training images only. I have used this dataset in the next post but a very small subset of it.

This dataset also contains abstract cartoon images. Each image has 3 questions and each question has 10 multiple choice answers.

  1. Real-life applications of VQA:

There are many applications of VQA. One of the famous applications is to help visually impaired people and blind peoples. In 2016, Microsoft has released the “Seeing AI” app for visually impaired people to describe the surrounding environment around them. You can watch this video for the prototype of the Seeing AI app.

Another application could be on social media or e-commerce sites. VQA can be also used for educational purposes.

  1. Conclusion:

I hope this explanation will give you a good idea of Visual Question Answering. In the next blog post, I will walk you through the code in Keras.

If you like my explanations, do provide some feedback, comments, etc. and stay tuned for the next post.

A Bird’s Eye View: How Machine Learning Can Help You Charge Your E-Scooters

Bird scooters in Columbus, Ohio

Bird scooters in Columbus, Ohio

Ever since I started using bike-sharing to get around in Seattle, I have become fascinated with geolocation data and the transportation sharing economy. When I saw this project leveraging the mobility data RESTful API from the Los Angeles Department of Transportation, I was eager to dive in and get my hands dirty building a data product utilizing a company’s mobility data API.

Unfortunately, the major bike and scooter providers (Bird, JUMP, Lime) don’t have publicly accessible APIs. However, some folks have seemingly been able to reverse-engineer the Bird API used to populate the maps in their Android and iOS applications.

One interesting feature of this data is the nest_id, which indicates if the Bird scooter is in a “nest” — a centralized drop-off spot for charged Birds to be released back into circulation.

I set out to ask the following questions:

  1. Can real-time predictions be made to determine if a scooter is currently in a nest?
  2. For non-nest scooters, can new nest location recommendations be generated from geospatial clustering?

To answer these questions, I built a full-stack machine learning web application, NestGenerator, which provides an automated recommendation engine for new nest locations. This application can help power Bird’s internal nest location generation that runs within their Android and iOS applications. NestGenerator also provides real-time strategic insight for Bird chargers who are enticed to optimize their scooter collection and drop-off route based on proximity to scooters and nest locations in their area.

Bird

The electric scooter market has seen substantial growth with Bird’s recent billion dollar valuation  and their $300 million Series C round in the summer of 2018. Bird offers electric scooters that top out at 15 mph, cost $1 to unlock and 15 cents per minute of use. Bird scooters are in over 100 cities globally and they announced in late 2018 that they eclipsed 10 million scooter rides since their launch in 2017.

Bird scooters in Tel Aviv, Israel

Bird scooters in Tel Aviv, Israel

With all of these scooters populating cities, there’s much-needed demand for people to charge them. Since they are electric, someone needs to charge them! A charger can earn additional income for charging the scooters at their home and releasing them back into circulation at nest locations. The base price for charging each Bird is $5.00. It goes up from there when the Birds are harder to capture.

Data Collection and Machine Learning Pipeline

The full data pipeline for building “NestGenerator”

Data

From the details here, I was able to write a Python script that returned a list of Bird scooters within a specified area, their geolocation, unique ID, battery level and a nest ID.

I collected scooter data from four cities (Atlanta, Austin, Santa Monica, and Washington D.C.) across varying times of day over the course of four weeks. Collecting data from different cities was critical to the goal of training a machine learning model that would generalize well across cities.

Once equipped with the scooter’s latitude and longitude coordinates, I was able to leverage additional APIs and municipal data sources to get granular geolocation data to create an original scooter attribute and city feature dataset.

Data Sources:

  • Walk Score API: returns a walk score, transit score and bike score for any location.
  • Google Elevation API: returns elevation data for all locations on the surface of the earth.
  • Google Places API: returns information about places. Places are defined within this API as establishments, geographic locations, or prominent points of interest.
  • Google Reverse Geocoding API: reverse geocoding is the process of converting geographic coordinates into a human-readable address.
  • Weather Company Data: returns the current weather conditions for a geolocation.
  • LocationIQ: Nearby Points of Interest (PoI) API returns specified PoIs or places around a given coordinate.
  • OSMnx: Python package that lets you download spatial geometries and model, project, visualize, and analyze street networks from OpenStreetMap’s APIs.

Feature Engineering

After extensive API wrangling, which included a four-week prolonged data collection phase, I was finally able to put together a diverse feature set to train machine learning models. I engineered 38 features to classify if a scooter is currently in a nest.

Full Feature Set

Full Feature Set

The features boiled down into four categories:

  • Amenity-based: parks within a given radius, gas stations within a given radius, walk score, bike score
  • City Network Structure: intersection count, average circuity, street length average, average streets per node, elevation level
  • Distance-based: proximity to closest highway, primary road, secondary road, residential road
  • Scooter-specific attributes: battery level, proximity to closest scooter, high battery level (> 90%) scooters within a given radius, total scooters within a given radius


Log-Scale Transformation

For each feature, I plotted the distribution to explore the data for feature engineering opportunities. For features with a right-skewed distribution, where the mean is typically greater than the median, I applied these log transformations to normalize the distribution and reduce the variability of outlier observations. This approach was used to generate a log feature for proximity to closest scooter, closest highway, primary road, secondary road, and residential road.

An example of a log transformation

Statistical Analysis: A Systematic Approach

Next, I wanted to ensure that the features I included in my model displayed significant differences when broken up by nest classification. My thinking was that any features that did not significantly differ when stratified by nest classification would not have a meaningful predictive impact on whether a scooter was in a nest or not.

Distributions of a feature stratified by their nest classification can be tested for statistically significant differences. I used an unpaired samples t-test with a 0.01% significance level to compute a p-value and confidence interval to determine if there was a statistically significant difference in means for a feature stratified by nest classification. I rejected the null hypothesis if a p-value was smaller than the 0.01% threshold and if the 99.9% confidence interval did not straddle zero. By rejecting the null-hypothesis in favor of the alternative hypothesis, it’s deemed there is a significant difference in means of a feature by nest classification.

Battery Level Distribution Stratified by Nest Classification to run a t-test

Battery Level Distribution Stratified by Nest Classification to run a t-test

Log of Closest Scooter Distribution Stratified by Nest Classification to run a t-test

Throwing Away Features

Using the approach above, I removed ten features that did not display statistically significant results.

Statistically Insignificant Features Removed Before Model Development

Model Development

I trained two models, a random forest classifier and an extreme gradient boosting classifier since tree-based models can handle skewed data, capture important feature interactions, and provide a feature importance calculation. I trained the models on 70% of the data collected for all four cities and reserved the remaining 30% for testing.

After hyper-parameter tuning the models for performance on cross-validation data it was time to run the models on the 30% of test data set aside from the initial data collection.

I also collected additional test data from other cities (Columbus, Fort Lauderdale, San Diego) not involved in training the models. I took this step to ensure the selection of a machine learning model that would generalize well across cities. The performance of each model on the additional test data determined which model would be integrated into the application development.

Performance on Additional Cities Test Data

The Random Forest Classifier displayed superior performance across the board

The Random Forest Classifier displayed superior performance across the board

I opted to move forward with the random forest model because of its superior performance on AUC score and accuracy metrics on the additional cities test data. AUC is the Area under the ROC Curve, and it provides an aggregate measure of model performance across all possible classification thresholds.

AUC Score on Test Data for each Model

AUC Score on Test Data for each Model

Feature Importance

Battery level dominated as the most important feature. Additional important model features were proximity to high level battery scooters, proximity to closest scooter, and average distance to high level battery scooters.

Feature Importance for the Random Forest Classifier

Feature Importance for the Random Forest Classifier

The Trade-off Space

Once I had a working machine learning model for nest classification, I started to build out the application using the Flask web framework written in Python. After spending a few days of writing code for the application and incorporating the trained random forest model, I had enough to test out the basic functionality. I could finally run the application locally to call the Bird API and classify scooter’s into nests in real-time! There was one huge problem, though. It took more than seven minutes to generate the predictions and populate in the application. That just wasn’t going to cut it.

The question remained: will this model deliver in a production grade environment with the goal of making real-time classifications? This is a key trade-off in production grade machine learning applications where on one end of the spectrum we’re optimizing for model performance and on the other end we’re optimizing for low latency application performance.

As I continued to test out the application’s performance, I still faced the challenge of relying on so many APIs for real-time feature generation. Due to rate-limiting constraints and daily request limits across so many external APIs, the current machine learning classifier was not feasible to incorporate into the final application.

Run-Time Compliant Application Model

After going back to the drawing board, I trained a random forest model that relied primarily on scooter-specific features which were generated directly from the Bird API.

Through a process called vectorization, I was able to transform the geolocation distance calculations utilizing NumPy arrays which enabled batch operations on the data without writing any “for” loops. The distance calculations were applied simultaneously on the entire array of geolocations instead of looping through each individual element. The vectorization implementation optimized real-time feature engineering for distance related calculations which improved the application response time by a factor of ten.

Feature Importance for the Run-time Compliant Random Forest Classifier

Feature Importance for the Run-time Compliant Random Forest Classifier

This random forest model generalized well on test-data with an AUC score of 0.95 and an accuracy rate of 91%. The model retained its prediction accuracy compared to the former feature-rich model, but it gained 60x in application performance. This was a necessary trade-off for building a functional application with real-time prediction capabilities.

Geospatial Clustering

Now that I finally had a working machine learning model for classifying nests in a production grade environment, I could generate new nest locations for the non-nest scooters. The goal was to generate geospatial clusters based on the number of non-nest scooters in a given location.

The k-means algorithm is likely the most common clustering algorithm. However, k-means is not an optimal solution for widespread geolocation data because it minimizes variance, not geodetic distance. This can create suboptimal clustering from distortion in distance calculations at latitudes far from the equator. With this in mind, I initially set out to use the DBSCAN algorithm which clusters spatial data based on two parameters: a minimum cluster size and a physical distance from each point. There were a few issues that prevented me from moving forward with the DBSCAN algorithm.

  1. The DBSCAN algorithm does not allow for specifying the number of clusters, which was problematic as the goal was to generate a number of clusters as a function of non-nest scooters.
  2. I was unable to hone in on an optimal physical distance parameter that would dynamically change based on the Bird API data. This led to suboptimal nest locations due to a distortion in how the physical distance point was used in clustering. For example, Santa Monica, where there are ~15,000 scooters, has a higher concentration of scooters in a given area whereas Brookline, MA has a sparser set of scooter locations.

An example of how sparse scooter locations vs. highly concentrated scooter locations for a given Bird API call can create cluster distortion based on a static physical distance parameter in the DBSCAN algorithm. Left:Bird scooters in Brookline, MA. Right:Bird scooters in Santa Monica, CA.

An example of how sparse scooter locations vs. highly concentrated scooter locations for a given Bird API call can create cluster distortion based on a static physical distance parameter in the DBSCAN algorithm. Left:Bird scooters in Brookline, MA. Right:Bird scooters in Santa Monica, CA.

Given the granularity of geolocation scooter data I was working with, geospatial distortion was not an issue and the k-means algorithm would work well for generating clusters. Additionally, the k-means algorithm parameters allowed for dynamically customizing the number of clusters based on the number of non-nest scooters in a given location.

Once clusters were formed with the k-means algorithm, I derived a centroid from all of the observations within a given cluster. In this case, the centroids are the mean latitude and mean longitude for the scooters within a given cluster. The centroids coordinates are then projected as the new nest recommendations.

NestGenerator showcasing non-nest scooters and new nest recommendations utilizing the K-Means algorithm

NestGenerator showcasing non-nest scooters and new nest recommendations utilizing the K-Means algorithm.

NestGenerator Application

After wrapping up the machine learning components, I shifted to building out the remaining functionality of the application. The final iteration of the application is deployed to Heroku’s cloud platform.

In the NestGenerator app, a user specifies a location of their choosing. This will then call the Bird API for scooters within that given location and generate all of the model features for predicting nest classification using the trained random forest model. This forms the foundation for map filtering based on nest classification. In the app, a user has the ability to filter the map based on nest classification.

Drop-Down Map View filtering based on Nest Classification

Drop-Down Map View filtering based on Nest Classification

Nearest Generated Nest

To see the generated nest recommendations, a user selects the “Current Non-Nest Scooters & Predicted Nest Locations” filter which will then populate the application with these nest locations. Based on the user’s specified search location, a table is provided with the proximity of the five closest nests and an address of the Nest location to help inform a Bird charger in their decision-making.

NestGenerator web-layout with nest addresses and proximity to nearest generated nests

NestGenerator web-layout with nest addresses and proximity to nearest generated nests

Conclusion

By accurately predicting nest classification and clustering non-nest scooters, NestGenerator provides an automated recommendation engine for new nest locations. For Bird, this application can help power their nest location generation that runs within their Android and iOS applications. NestGenerator also provides real-time strategic insight for Bird chargers who are enticed to optimize their scooter collection and drop-off route based on scooters and nest locations in their area.

Code

The code for this project can be found on my GitHub

Comments or Questions? Please email me an E-Mail!


Attribution Models in Marketing

Attribution Models

A Business and Statistical Case

INTRODUCTION

A desire to understand the causal effect of campaigns on KPIs

Advertising and marketing costs represent a huge and ever more growing part of the budget of companies. Studies have found out this share is as high as 10% and increases with the size of companies (CMO study by American Marketing Association and Duke University, 2017). Measuring precisely the impact of a specific marketing campaign on the sales of a company is a critical step towards an efficient allocation of this budget. Would the return be higher for an euro spent on a Facebook ad, or should we better spend it on a TV spot? How much should I spend on Twitter ads given the volume of sales this channel is responsible for?

Attribution Models have lately received great attention in Marketing departments to answer these issues. The transition from offline to online marketing methods has indeed permitted the collection of multiple individual data throughout the whole customer journey, and  allowed for the development of user-centric attribution models. In short, Attribution Models use the information provided by Tracking technologies such as Google Analytics or Webtrekk to understand customer journeys from the first click on a Facebook ad to the final purchase and adequately ponderate the different marketing campaigns encountered depending on their responsibility in the final conversion.

Issues on Causal Effects

A key question then becomes: how to declare a channel is responsible for a purchase? In other words, how can we isolate the causal effect or incremental value of a campaign ?

          1. A/B-Tests

One method to estimate the pure impact of a campaign is the design of randomized experiments, wherein a control and treated groups are compared.  A/B tests belong to this broad category of randomized methods. Provided the groups are a priori similar in every aspect except for the treatment received, all subsequent differences may be attributed solely to the treatment. This method is typically used in medical studies to assess the effect of a drug to cure a disease.

Main practical issues regarding Randomized Methods are:

  • Assuring that control and treated groups are really similar before treatment. Uually a random assignment (i.e assuring that on a relevant set of observable variables groups are similar) is realized;
  • Potential spillover-effects, i.e the possibility that the treatment has an impact on the non-treated group as well (Stable unit treatment Value Assumption, or SUTVA in Rubin’s framework);
  • The costs of conducting such an experiment, and especially the costs linked to the deliberate assignment of individuals to a group with potentially lower results;
  • The number of such experiments to design if multiple treatments have to be measured;
  • Difficulties taking into account the interaction effects between campaigns or the effect of spending levels. Indeed, usually A/B tests are led by cutting off temporarily one campaign entirely and measuring the subsequent impact on KPI’s compared to the situation where this campaign is maintained;
  • The dynamical reproduction of experiments if we assume that treatment effects may change over time.

In the marketing context, multiple campaigns must be tested in a dynamical way, and treatment effect is likely to be heterogeneous among customers, leading to practical issues in the lauching of A/B tests to approximate the incremental value of all campaigns. However, sites with a lot of traffic and conversions can highly benefit from A/B testing as it provides a scientific and straightforward way to approximate a causal impact. Leading companies such as Uber, Netflix or Airbnb rely on internal tools for A/B testing automation, which allow them to basically test any decision they are about to make.

References:

Books:

Experiment!: Website conversion rate optimization with A/B and multivariate testing, Colin McFarland, ©2013 | New Riders  

A/B testing: the most powerful way to turn clicks into customers. Dan Siroker, Pete Koomen; Wiley, 2013.

Blogs:

https://eng.uber.com/xp

https://medium.com/airbnb-engineering/growing-our-host-community-with-online-marketing-9b2302299324

Study:

https://cmosurvey.org/wp-content/uploads/sites/15/2018/08/The_CMO_Survey-Results_by_Firm_and_Industry_Characteristics-Aug-2018.pdf

        2. Attribution models

Attribution Models do not demand to create an experimental setting. They take into account existing data and derive insights from the variability of customer journeys. One key difficulty is then to differentiate correlation and causality in the links observed between the exposition to campaigns and purchases. Indeed, selection effects may bias results as exposure to campaigns is usually dependant on user-characteristics and thus may not be necessarily independant from the customer’s baseline conversion probabilities. For example, customers purchasing from a discount price comparison website may be intrinsically different from customers buying from FB ad and this a priori difference may alone explain post-exposure differences in purchasing bahaviours. This intrinsic weakness must be remembered when interpreting Attribution Models results.

                          2.1 General Issues

The main issues regarding the implementation of Attribution Models are linked to

  • Causality and fallacious reasonning, as most models do not take into account the aforementionned selection biases.
  • Their difficult evaluation. Indeed, in almost all attribution models (except for those based on classification, where the accuracy of the model can be computed), the additionnal value brought by the use of a given attribution models cannot be evaluated using existing historical data. This additionnal value can only be approximated by analysing how the implementation of the conclusions of the attribution model have impacted a given KPI.
  • Tracking issues, leading to an uncorrect reconstruction of customer journeys
    • Cross-device journeys: cross-device issue arises from the use of different devices throughout the customer journeys, making it difficult to link datapoints. For example, if a customer searches for a product on his computer but later orders it on his mobile, the AM would then mistakenly consider it an order without prior campaign exposure. Though difficult to measure perfectly, the proportion of cross-device orders can approximate 20-30%.
    • Cookies destruction makes it difficult to track the customer his the whole journey. Both regulations and consumers’ rising concerns about data privacy issues mitigate the reliability and use of cookies.1 – From 2002 on, the EU has enacted directives concerning privacy regulation and the extended use of cookies for commercial targeting purposes, which have highly impacted marketing strategies, such as the ‘Privacy and Electronic Communications Directive’ (2002/58/EC). A research was conducted and found out that the adoption of this ‘Privacy Directive’ had led to 64% decrease in advertising methods compared to the rest of the world (Goldfarb et Tucker (2011)). The effect was stronger for generalized sites (Yahoo) than for specialized sites.2 – Users have grown more and more conscious of data privacy issues and have adopted protective measures concerning data privacy, such as automatic destruction of cookies after a session is ended, or simply giving away less personnal information (Goldfarb et Tucker (2012) ) .Valuable user information may be lost, though tracking technologies evolution have permitted to maintain tracking by other means. This issue may be particularly important in countries highly concerned with data privacy issues such as Germany.
    • Offline/Online bridge: an Attribution Model should take into account all campaigns to draw valuable insights. However, the exposure to offline campaigns (TV, newspapers) are difficult to track at the user level. One idea to tackle this issue would be to estimate the proportion of conversions led by offline campaigns through AB testing and deduce this proportion from the credit assigned to the online campaigns accounted for in the Attribution Model.
    • Touch point information available: clicks are easy to follow but irrelevant to take into account the influence of purely visual campaigns such as display ads or video.

                          2.2 Today’s main practices

Two main families of Attribution Models exist:

  • Rule-Based Attribution Models, which have been used for in the last decade but from which companies are gradualy switching.

Attribution depends on the individual journeys that have led to a purchase and is solely based on the rank of the campaign in the journey. Some models focus on a single touch points (First Click, Last Click) while others account for multi-touch journeys (Bathtube, Linear). It can be calculated at the customer level and thus doesn’t require large amounts of data points. We can distinguish two sub-groups of rule-based Attribution Models:

  • One Touch Attribution Models attribute all credit to a single touch point. The First-Click model attributes all credit for a converion to the first touch point of the customer journey; last touch attributes all credit to the last campaign.
  • Multi-touch Rule-Based Attribution Models incorporate information on the whole customer journey are thus an improvement compared to one touch models. To this family belong Linear model where credit is split equally between all channels, Bathtube model where 40% of credit is given to first and last clicks and the remaining 20% is distributed equally between the middle channels, or time-decay models where credit assigned to a click diminishes as the time between the click and the order increases..

The main advantages of rule-based models is their simplicity and cost effectiveness. The main problems are:

– They are a priori known and can thus lead to optimization strategies from competitors
– They do not take into account aggregate intelligence on customer journeys and actual incremental values.
– They tend to bias (depending on the model chosen) channels that are over-represented at the beggining or end of the funnel, according to theoretical assumptions that have no observationnal back-ups.

  • Data-Driven Attribution Models

These models take into account the weaknesses of rule-based models and make a relevant use of available data. Being data-driven, following attribution models cannot be computed using single user level data. On the contrary values are calculated through data aggregation and thus require a certain volume of customer journey information.

References:

https://dspace.mit.edu/handle/1721.1/64920


        3. Data-Driven Attribution Models in practice

                          3.1 Issues

Several issues arise in the computation of campaigns individual impact on a given KPI within a data-driven model.

  • Selection biases: Exposure to certain types of advertisement is usually highly correlated to non-observable variables which are in turn correlated to consumption practices. Differences in the behaviour of users exposed to different campaigns may thus only be driven by core differences in conversion probabilities between groups whether than by the campaign effect.
  • Complementarity: it may be that campaigns A and B only have an effect when combined, so that measuring their individual impact would lead to misleading conclusions. The model could then try to assess the effect of combinations of campaigns on top of the effect of individual campaigns. As the number of possible non-ordered combinations of k campaigns is 2k, it becomes clear that inclusing all possible combinations would however be time-consuming.
  • Order-sensitivity: The effect of a campaign A may depend on the place where it appears in the customer journey, meaning the rank of a campaign and not merely its presence could be accounted for in the model.
  • Relative Order-sensitivity: it may be that campaigns A and B only have an effect when one is exposed to campaign A before campaign B. If so, it could be useful to assess the effect of given combinations of campaigns as well. And this for all campaigns, leading to tremendous numbers of possible combinations.
  • All previous phenomenon may be present, increasing even more the potential complexity of a comprehensive Attribution Model. The number of all possible ordered combination of k campaigns is indeed :


                          3.2 Main models

                                  A) Logistic Regression and Classification models

If non converting journeys are available, Attribition Model can be shaped as a simple classification issue. Campaign types or campaigns combination and volume of campaign types can be included in the model along with customer or time variables. As we are interested in inference (on campaigns effect) whether than prediction, a parametric model should be used, such as Logistic Regression. Non paramatric models such as Random Forests or Neural Networks can also be used though the interpretation of campaigns value would be more difficult to derive from the model results.

A common pitfall is the usual issue of spurious correlations on one hand and the correct interpretation of coefficients in business terms.

An advantage if the possibility to evaluate the relevance of the model using common model validation methods to evaluate its predictive power (validation set \ AUC \pseudo R squared).

                                  B) Shapley Value

Theory

The Shapley Value is based on a Game Theory framework and is named after its creator, the Nobel Price Laureate Lloyd Shapley. Initially meant to calculate the marginal contribution of players in cooperative games, the model has received much attention in research and industry and has lately been applied to marketing issues. This model is typically used by Google Adords and other ad bidding vendors. Campaigns or marketing channels are in this model seen as compementary players looking forward to increasing a given KPI.
Contrarily to Logistic Regressions, it is a non-parametric model. Contrarily to Markov Chains, all results are built using existing journeys, and not simulated ones.

Channels are considered to enter the game sequentially under a certain joining order. Shapley value try to The Shapley value of channel i is the weighted sum of the marginal values that channel i adds to all possible coalitions that don’t contain channel i.
In other words, the main logic is to analyse the difference of gains when a channel i is added after a coalition Ck of k channels, k<=n. We then sum all the marginal contributions over all possible ordered combination Ck of all campaigns excluding i, with k<=n-1.

Subsets framework

A first an most usual way to compute the Shapley Vaue is to consider that when a channel enters coalition, its additionnal value is the same irrelevant of the order in which previous channels have appeared. In other words, journeys (A>B>C) and (B>A>C) trigger the same gains.
Shapley value is computed as the gains associated to adding a channel i to a subset of channels, weighted by the number of (ordered) sequences that the (unordered) subset represents, summed up on all possible subsets of the total set of campaigns where the channel i is not present.
The Shapley value of the channel ???????? is then:

where |S| is the number of campaigns of a coalition S and the sum extends over all subsets S that do not not contain channel j. ????(????)  is the value of the coalition S and ????(???? ∪ {????????})  the value of the coalition formed by adding ???????? to coalition S. ????(???? ∪ {????????}) − ????(????) is thus the marginal contribution of channel ???????? to the coalition S.

The formula can be rewritten and understood as:

This method is convenient when data on the gains of on all possible permutations of all unordered k subsets of the n campaigns are available. It is also more convenient if the order of campaigns prior to the introduction of a campaign is thought to have no impact.

Ordered sequences

Let us define ????((A>B)) as the value of the sequence A then B. What is we let ????((A>B)) be different from ????((B>A)) ?
This time we would need to sum over all possible permutation of the S campaigns present before  ???????? and the N-(S+1) campaigns after ????????. Doing so we will sum over all possible orderings (i.e all permutations of the n campaigns of the grand coalition containing all campaigns) and we can remove the permutation coefficient s!(p-s+1)!.

This method is convenient when the order of channels prior to and after the introduction of another channel is assumed to have an impact. It is also necessary to possess data for all possible permutations of all k subsets of the n campaigns, and not only on all (unordered) k-subsets of the n campaigns, k<=n. In other words, one must know the gains of A, B, C, A>B, B>A, etc. to compute the Shapley Value.

Differences between the two approaches

We simulate an ordered case where the value for each ordered sequence k for k<=3 is known. We compare it to the usual Shapley value calculated based on known gains of unordered subsets of campaigns. So as to compare relevant values, we have built the gains matrix so that the gains of a subset A, B i.e  ????({B,A}) is the average of the gains of ordered sequences made up with A and B (assuming the number of journeys where A>B equals the number of journeys where B>A, we have ????({B,A})=0.5( ????((A>B)) + ????((B>A)) ). We let the value of the grand coalition be different depending on the order of campaigns-keeping the constraints that it averages to the value used for the unordered case.

Note: mvA refers to the marginal value of A in a given sequence.
With traditionnal unordered coalitions:

With ordered sequences used to compute the marginal values:


We can see that the two approaches yield very different results. In the unordered case, the Shapley Value campaign C is the highest, culminating at 20, while A and B have the same Shapley Value mvA=mvB=15. In the ordered case, campaign A has the highest Shapley Value and all campaigns have different Shapley Values.

This example illustrates the inherent differences between the set and sequences approach to Shapley values. Real life data is more likely to resemble the ordered case as conversion probabilities may for any given set of campaigns be influenced by the order through which the campaigns appear.

Advantages

Shapley value has become popular in allocation problems in cooperative games because it is the unique allocation which satisfies different axioms:

  • Efficiency: Shaple Values of all channels add up to the total gains (here, orders) observed.
  • Symmetry: if channels A and B bring the same contribution to any coalition of campaigns, then their Shapley Value i sthe same
  • Null player: if a channel brings no additionnal gains to all coalitions, then its Shapley Value is zero
  • Strong monotony: the Shapley Value of a player increases weakly if all its marginal contributions increase weakly

These properties make the Shapley Value close to what we intuitively define as a fair attribution.

Issues

  • The Shapley Value is based on combinatory mathematics, and the number of possible coalitions and ordered sequences becomes huge when the number of campaigns increases.
  • If unordered, the Shapley Value assumes the contribution of campaign A is the same if followed by campaign B or by C.
  • If ordered, the number of combinations for which data must be available and sufficient is huge.
  • Channels rarely present or present in long journeys will be played down.
  • Generally, gains are supposed to grow with the number of players in the game. However, it is plausible that in the marketing context a journey with a high number of channels will not necessarily bring more orders than a journey with less channels involved.

References:

R package: GameTheoryAllocation

Article:
Zhao & al, 2018 “Shapley Value Methods for Attribution Modeling in Online Advertising “
https://link.springer.com/content/pdf/10.1007/s13278-017-0480-z.pdf
Courses: https://www.lamsade.dauphine.fr/~airiau/Teaching/CoopGames/2011/coopgames-7%5b8up%5d.pdf
Blogs: https://towardsdatascience.com/one-feature-attribution-method-to-supposedly-rule-them-all-shapley-values-f3e04534983d

                                  B) Markov Chains

Markov Chains are used to model random processes, i.e events that occur in a sequential manner and in such a way that the probability to move to a certain state only depends on the past steps. The number of previous steps that are taken into account to model the transition probability is called the memory parameter of the sequence, and for the model to have a solution must be comprised between 0 and 4. A Markov Chain process is thus defined entirely by its Transition Matrix and its initial vector (i.e the starting point of the process).

Markov Chains are applied in many scientific fields. Typically, they are used in weather forecasting, with the sequence of Sunny and Rainy days following a Markov Process of memory parameter 0, so that for each given day the probability that the next day will be rainy or sunny only depends on the weather of the current day. Other applications can be found in sociology to understand the dynamics of social classes intergenerational reproduction. To get more both mathematical and applied illustration, I recommend the reading of this course.

In the marketing context, Markov Chains are an interesting way to model the conversion funnel. To go from the from the Markov Model to the Attribution logic, we calculate the Removal Effect of each channel, i.e the difference in conversions that happen if the channel is removed. Please read below for an introduction to the methodology.

The first step in a Markov Chains Attribution Model is to build the transition matrix that captures the transition probabilities between the campaigns accross existing customer journeys. This Matrix is to be read as a “From state A to state B” table, from the left to the right. A first difficulty is finding the right memory parameter to use. A large memory parameter would allow to take more into account interraction effects within the conversion funnel but would lead to increased computationnal time, a non-readable transition matrix, and be more sensitive to noisy data. Please note that this transition matrix provides useful information on the conversion funnel and on the relationships between campaigns and can be used as such as an analytical tool. I suggest the clear and easily R code which can be found here or here.

Here is an illustration of a Markov Chain with memory Parameter of 0: the probability to go to a certain campaign B in the next step only depend on the campaign we are currently at:

The associated Transition Matrix is then (with null probabilities left as Blank):

The second step is  to compute the actual responsibility of a channel in total conversions. As mentionned above, the main philosophy to do so is to calculate the Removal Effect of each channel, i.e the changes in the number of conversions when a channel is entirely removed. All customer journeys which went through this channel are settled out to be unsuccessful. This calculation is done by applying the transition matrix with and without the removed channels to an initial vector that contains the number of desired simulations.

Building on our current example, we can then settle an initial vector with the desired number of simulations, e.g 10 000:


It is possible at this stage to add a constraint on the maximum number of times the matrix is applied to the data, i.e on the maximal number of campaigns a simulated journey is allowed to have.

Advantages

  • The dynamic journey is taken into account, as well as the transition between two states. The funnel is not assumed to be linear.
  • It is possile to build a conversion graph that maps the customer journey provides valuable insights.
  • It is possible to evaluate partly the accuracy of the Attribution Model based on Markov Chains. It is for example possible to see how well the transition matrix help predict the future by analysing the number of correct predictions at any given step over all sequences.

Disadvantages

  • It can be somewhat difficult to set the memory parameter. Complementarity effects between channels are not well taken into account if the memory is low, but a parameter too high will lead to over-sensitivity to noise in the data and be difficult to implement if customer journeys tend to have a number of campaigns below this memory parameter.
  • Long journeys with different channels involved will be overweighted, as they will count many times in the Removal Effect.  For example, if there are n-1 channels in the customer journey, this journey will be considered as failure for the n-1 channel-RE. If the volume effects (i.e the impact of the overall number of channels in a journey, irrelevant from their type° are important then results may be biased.

References:

R package: ChannelAttribution

Git:

https://github.com/MatCyt/Markov-Chain/blob/master/README.md

Course:

https://www.ssc.wisc.edu/~jmontgom/markovchains.pdf

Article:

“Mapping the Customer Journey: A Graph-Based Framework for Online Attribution Modeling”; Anderl, Eva and Becker, Ingo and Wangenheim, Florian V. and Schumann, Jan Hendrik, 2014. Available at SSRN: https://ssrn.com/abstract=2343077 or http://dx.doi.org/10.2139/ssrn.2343077

“Media Exposure through the Funnel: A Model of Multi-Stage Attribution”, Abhishek & al, 2012

“Multichannel Marketing Attribution Using Markov Chains”, Kakalejčík, L., Bucko, J., Resende, P.A.A. and Ferencova, M. Journal of Applied Management and Investments, Vol. 7 No. 1, pp. 49-60.  2018

Blogs:

https://analyzecore.com/2016/08/03/attribution-model-r-part-1

https://analyzecore.com/2016/08/03/attribution-model-r-part-2

                          3.3 To go further: Tackling selection biases with Quasi-Experiments

Exposure to certain types of advertisement is usually highly correlated to non-observable variables. Differences in the behaviour of users exposed to different campaigns may thus only be driven by core differences in converison probabilities between groups whether than by the campaign effect. These potential selection effects may bias the results obtained using historical data.

Quasi-Experiments can help correct this selection effect while still using available observationnal data.  These methods recreate the settings on a randomized setting. The goal is to come as close as possible to the ideal of comparing two populations that are identical in all respects except for the advertising exposure. However, populations might still differ with respect to some unobserved characteristics.

Common quasi-experimental methods used for instance in Public Policy Evaluation are:

  • Discontinuity Regressions
  • Matching Methods, such as Exact Matching,  Propensity-score matching or k-nearest neighbourghs.

References:

Article:

“Towards a digital Attribution Model: Measuring the impact of display advertising on online consumer behaviour”, Anindya Ghose & al, MIS Quarterly Vol. 40 No. 4, pp. 1-XX, 2016

https://pdfs.semanticscholar.org/4fa6/1c53f281fa63a9f0617fbd794d54911a2f84.pdf

        4. First Steps towards a Practical Implementation

Identify key points of interests

  • Identify the nature of touchpoints available: is the data based on clicks? If so, is there a way to complement the data with A/B tests to measure the influence of ads without clicks (display, video) ? For example, what happens to sales when display campaign is removed? Analysing this multiplier effect would give the overall responsibility of display on sales, to be deduced from current attribution values given to click-based channels. More interestingly, what is the impact of the removal of display campaign on the occurences of click-based campaigns ? This would give us an idea of the impact of display ads on the exposure to each other campaigns, which would help correct the attribution values more precisely at the campaign level.
  • Define the KPI to track. From a pure Marketing perspective, looking at purchases may be sufficient, but from a financial perspective looking at profits, though a bit more difficult to compute, may drive more interesting results.
  • Define a customer journey. It may seem obvious, but the notion needs to be clarified at first. Would it be defined by a time limit? If so, which one? Does it end when a conversion is observed? For example, if a customer makes 2 purchases, would the campaigns he’s been exposed to before the first order still be accounted for in the second order? If so, with a time decay?
  • Define the research framework: are we interested only in customer journeys which have led to conversions or in all journeys? Keep in mind that successful customer journeys are a non-representative sample of customer journeys. Models built on the analysis of biased samples may be conservative. Take an extreme example: 80% of customers who see campaign A buy the product, VS 1% for campaign B. However, campaign B exposure is great and 100 Million people see it VS only 1M for campaign A. An Attribution Model based on successful journeys will give higher credit to campaign B which is an auguable conclusion. Taking into account costs per campaign (in the case where costs are calculated by clicks) may of course tackle this issue partly, as campaign A could then exhibit higher returns, but a serious fallacious reasonning is at stake here.

Analyse the typical customer journey    

  • Performing a duration analysis on the data may help you improve the definition of the customer journey to be used by your organization. After which days are converison probabilities null? Should we consider the effect of campaigns disappears after x days without orders? For example, if 99% of orders are placed in the 30 days following a first click, it might be interesting to define the customer journey as a 30 days time frame following the first oder.
  • Look at the distribution of the number of campaigns in a typical journey. If you choose to calculate the effect of campaigns interraction in your Attribution Model, it may indeed help you determine the maximum number of campaigns to be included in a combination. Indeed, you may not need to assess the impact of channel combinations with above than 4 different channels if 95% of orders are placed after less then 4 campaigns.
  • Transition matrixes: what if a campaign A systematically leads to a campaign B? What happens if we remove A or B? These insights would give clues to ask precise questions for a latter AB test, for example to find out if there is complementarity between channels A and B – (implying none should be removed) or mere substitution (implying one can be given up).
  • If conversion rates are available: it can be interesting to perform a survival analysis i.e to analyse the likelihood of conversion based on duration since first click. This could help us excluse potential outliers or individuals who have very low conversion probabilities.

Summary

Attribution is a complex topic which will probably never be definitively solved. Indeed, a main issue is the difficulty, or even impossibility, to evaluate precisely the accuracy of the attribution model that we’ve built. Attribution Models should be seen as a good yet always improvable approximation of the incremental values of campaigns, and be presented with their intrinsinc limits and biases.