Interview – The Importance of Machine Learning for the Data Driven Business

To become more data-driven, organizations must mature their analytics and automate more of their decision making processes for innovation and differentiation. Data science seems like the right approach, yet is a new and fast moving field that seems to have as many dead ends as it has high ways to value. Cloudera Fast Forward Labs, led by Hilary Mason, shows companies the way.

Alice Albrecht is a research engineer at Cloudera Fast Forward Labs.  She spends her days researching the latest and greatest in machine learning and artificial intelligence and bringing that knowledge to working prototypes and delivering concrete advice for clients.  Prior to joining Fast Forward Labs, Alice worked in both finance and technology companies as a practicing data scientist, data science leader, and – most recently – a data product manager.  In addition to teaching machines to do cool things, Alice is passionate about mentoring and helping others grow in their careers.  Alice holds a PhD from Yale in cognitive neuroscience where she studied how humans summarize sensory information from the world around them and the neural substrates that underlie those summaries.

Read this article in German:
“Interview – Die Bedeutung von Machine Learning für das Data Driven Business“

Data Science Blog: Ms. Albrecht, you are a well-known keynote speaker for data science and artificial intelligence. While data science has arrived business already, deep learning seems to be the new trend. Is artificial intelligence for business already normal business or is it an overrated hype?

I’d say it isn’t either of those two options.  Data science is now widely adopted but companies still struggle to integrate this new discipline into their existing businesses.  As for deep learning, it really depends on the company that’s looking into using this technique.  I wouldn’t say that deep learning is by any means part of business as usual- nor should it be.  It’s a tool like any other and building a capacity for using a tool without clearly defined business needs is a recipe for disaster.

Data Science Blog: Just to make sure what we are talking about: What are the differences and overlaps between data analytics, data science, machine learning, deep learning and artificial intelligence?

Here at Cloudera Fast Forward Labs, we like to think of data analytics as collecting data and counting things (mostly for quick charts and reports).  Data science solves business problems by counting cleverly and predicting things with the data that’s collected.  Machine learning is about solving problems with new kinds of feedback loops that improve with more data.  Deep learning is a particular type of machine learning and is not itself a separate concept or type of tool.  Artificial intelligence taps into something more complicated than what we’re seeing today – it’s much broader than training machines to repetitively do very specialized tasks or solve very narrow problems.

Data Science Blog: And how can we add the context to big data?

From a theoretical perspective, data science has been around for decades. The building blocks for modern day machine learning, deep learning and artificial intelligence are based on mathematical theorems  that go back to the 1940’s and 1950’s. The challenge was that at the time, compute power and data storage capacity were simply too expensive for the approaches to be implemented. Today that’s all changed.. Not only has the cost of data storage dropped considerably, open source technology like Apache Hadoop has made it possible to store any volume of data at costs approaching zero. Compute power, even highly specialised chip architectures, are now also available on demand and only for the time organisations need them through public and private cloud solutions. The decreased cost of both data storage and compute power, together with a growing list of tools and resources readily available via the open source community allows companies of any size to benefit from data (no matter that size of that data).

Data Science Blog: What are the challenges for organizations in getting started with data science?

I see two big challenges when getting started with data science.  One is ensuring that you have organizational alignment around exactly what type of work data scientists will deliver (and timing for those projects).  The second hurdle is around ensuring that you have the right data in place before you start hiring data scientists. This can be tricky if you don’t have in-house expertise in this area, so sometimes it’s better to hire a data engineer or a data strategist (or director of data science) before you ever get started building out a data science team.

Data Science Blog: There are many discussions about how to build a data-driven business. Is it just about using data science to get a better understanding of customer behavior?

No, being data driven doesn’t just mean better understanding your customers (though that is one way that data science can help in an organization).  Aside from building an organization that relies on data and analytics to help them make decisions (about customer behavior or otherwise), being a data-driven business means that data is powering your core products.

Data Science Blog: The number of technologies, tools and frameworks is increasing. For organizations this also means increasing complexity. Do companies need to stay always up-to-date or could it be an advice to wait and imitate pioneers later?

While it’s not critical (or advisable) for organizations to adopt every new advancement that comes along, it is critical for them to stay abreast of emerging frameworks.  If a business waits to see what others are doing, and therefore don’t invest in understanding how new advancements can affect their particular business, they’ve likely already missed the boat.

Data Science Blog: Global players have big budgets just for doing research and setting up data labs. Middle-sized companies need to see the break even point soon. How can we accelerate the value generation of data science?

Having a team that is highly focused on a specific set of projects that are well-scoped and aligned to the business makes all the difference.  Data science and machine learning don’t have to sacrifice doing research and being innovative in order to produce value.  The biggest difference is that smaller teams will have to be more aware of how their choice of project fits into emerging frameworks and their particular acute and near term business needs.

Data Science Blog: How does Cloudera Fast Forward Labs help other organizations to accelerate their start with machine learning?

We advise organizations, based on their particular needs, on what the latest advancements are in machine learning and data science, how to build and structure their data teams to develop the capabilities they need to meet their goals, and how to quickly implement custom forward-looking solutions using their own data and in-house expertise.

Data Science Blog: Finally, a question for our younger readers who are looking for a career as a data expert: What makes a good data scientist? Do you like to work with introverted coding nerds or the data loving business experts?

A good data scientists should be deeply curious and have a love for the ways in which data can lead to new discoveries and power the next generation of products.  We expect the people who thrive in this field to come from a variety of backgrounds and experiences.

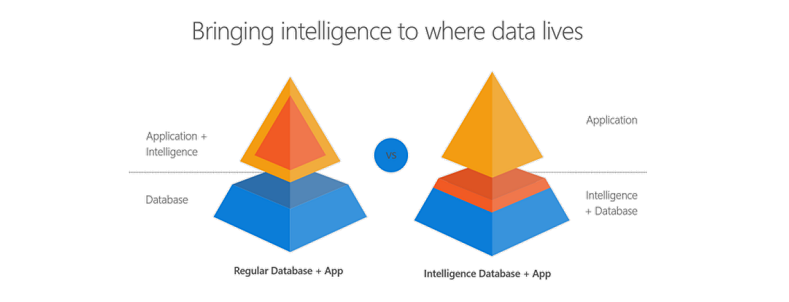
Bringing intelligence to where data lives: Python & R embedded in T-SQL

Introduction

Did you know that you can write R and Python code within your T-SQL statements? Machine Learning Services in SQL Server eliminates the need for data movement. Instead of transferring large and sensitive data over the network or losing accuracy with sample csv files, you can have your R/Python code execute within your database. Easily deploy your R/Python code with SQL stored procedures making them accessible in your ETL processes or to any application. Train and store machine learning models in your database bringing intelligence to where your data lives.

You can install and run any of the latest open source R/Python packages to build Deep Learning and AI applications on large amounts of data in SQL Server. We also offer leading edge, high-performance algorithms in Microsoft’s RevoScaleR and RevoScalePy APIs. Using these with the latest innovations in the open source world allows you to bring unparalleled selection, performance, and scale to your applications.

If you are excited to try out SQL Server Machine Learning Services, check out the hands on tutorial below. If you do not have Machine Learning Services installed in SQL Server,you will first want to follow the getting started tutorial I published here: 

How-To Tutorial

In this tutorial, I will cover the basics of how to Execute R and Python in T-SQL statements. If you prefer learning through videos, I also published the tutorial on YouTube.

Basics

Open up SQL Server Management Studio and make a connection to your server. Open a new query and paste this basic example: (While I use Python in these samples, you can do everything with R as well)

EXEC sp_execute_external_script @language = N'Python',
@script = N'print(3+4)'

Sp_execute_external_script is a special system stored procedure that enables R and Python execution in SQL Server. There is a “language” parameter that allows us to choose between Python and R. There is a “script” parameter where we can paste R or Python code. If you do not see an output print 7, go back and review the setup steps in this article.

Parameter Introduction

Now that we discussed a basic example, let’s start adding more pieces:

EXEC sp_execute_external_script  @language =N'Python', 
@script = N' 
OutputDataSet = InputDataSet;
',
@input_data_1 =N'SELECT 1 AS Col1';

Machine Learning Services provides more natural communications between SQL and R/Python with an input data parameter that accepts any SQL query. The input parameter name is called “input_data_1”.
You can see in the python code that there are default variables defined to pass data between Python and SQL. The default variable names are “OutputDataSet” and “InputDataSet” You can change these default names like this example:

EXEC sp_execute_external_script  @language =N'Python', 
@script = N' 
MyOutput = MyInput;
',
@input_data_1_name = N'MyInput',
@input_data_1 =N'SELECT 1 AS foo',
@output_data_1_name =N'MyOutput';

As you executed these examples, you might have noticed that they each return a result with “(No column name)”? You can specify a name for the columns that are returned by adding the WITH RESULT SETS clause to the end of the statement which is a comma separated list of columns and their datatypes.

EXEC sp_execute_external_script  @language =N'Python', 
@script=N' 
MyOutput = MyInput;
',
@input_data_1_name = N'MyInput',
@input_data_1 =N'
SELECT 1 AS foo,
2 AS bar
',
@output_data_1_name =N'MyOutput'
WITH RESULT SETS ((MyColName int, MyColName2 int));

Input/Output Data Types

Alright, let’s discuss a little more about the input/output data types used between SQL and Python. Your input SQL SELECT statement passes a “Dataframe” to python relying on the Python Pandas package. Your output from Python back to SQL also needs to be in a Pandas Dataframe object. If you need to convert scalar values into a dataframe here is an example:

EXEC sp_execute_external_script  @language =N'Python', 
@script=N' 
import pandas as pd
c = 1/2
d = 1*2
s = pd.Series([c,d])
df = pd.DataFrame(s)
OutputDataSet = df
'

Variables c and d are both scalar values, which you can add to a pandas Series if you like, and then convert them to a pandas dataframe. This one shows a little bit more complicated example, go read up on the python pandas package documentation for more details and examples:

EXEC sp_execute_external_script  @language =N'Python', 
@script=N' 
import pandas as pd
s = {"col1": [1, 2], "col2": [3, 4]}
df = pd.DataFrame(s)
OutputDataSet = df
'

You now know the basics to execute Python in T-SQL!

Did you know you can also write your R and Python code in your favorite IDE like RStudio and Jupyter Notebooks and then remotely send the execution of that code to SQL Server? Check out these documentation links to learn more: https://aka.ms/R-RemoteSQLExecution https://aka.ms/PythonRemoteSQLExecution

Check out the SQL Server Machine Learning Services documentation page for more documentation, samples, and solutions. Check out these E2E tutorials on github as well.

Would love to hear from you! Leave a comment below to ask a question, or start a discussion!

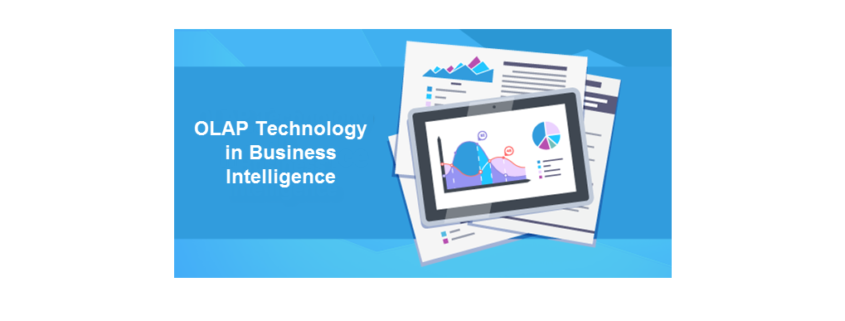
OLAP Technology in Business Intelligence

Data in Business Intelligence
Business processes traditionally comprise three stages of data management: collecting, analyzing, and reporting. First, data should be gathered from all the sources through ETL tools (Extract, Transform, Load). After this, there are often issues occurring connected with data consistency hence the data should be cleaned and structured using the function of metadata. Once the data are provided to the end-user in a readable and transparent way it is ready to be analyzed. There are multiple applications ensuring data analysis including Data Mining, OLAP, BI. In order to carry out in-depth and coherent analysis, the best approach is to initially determine KPI as these are the criteria to assess the progress in relation to the goals set.

OLAP definition
OLAP tool belongs to Business Intelligence concept intended for big data management and is short for Online Analytical Processing. OLAP conducts multidimensional data analysis and enables end-users to perform complicated calculations, trend analysis, ‘what-if’ scenarios and the like. Furthermore, owing to OLAP it’s possible to conduct planning and forecasting, budgeting and financial reporting, analysis, and data modeling which contributes to successful decision making in business.

OLAP Structure
An OLAP cube is composed of dimensions containing aggregated information referred to and measures which include numerical data. Dimensions are arranged in hierarchies which in their turn are indicators to determine the rate of granularity; the rate is called a level. The most common dimensions are location, product, and time. The lowest granularity level of a time dimension may be hours while the highest one can present years. This way when there is a query to be responded the measures contribute to filter out the data and select the right object inside the dimension. In the center of the cube there is a star or a snowflake schema which all the dimensions refer to.

OLAP main characteristics
Here are the main features characterizing the OLAP tool”:

– The data in OLAP is structured as a multidimensional cube.
– The cube structure allows users to see the information from various angles given location, products, demographics, time, etc.
– Rapid data access and analysis due to precalculated aggregations.
– Simple and intuitive interface.
– OLAP doesn’t require IT skills or SQL knowledge (as some other business intelligence software tools). Hence its operation eases the burden of IT department.
– The tool supports complex custom calculations
– The OLAP databases maintain historical data and are updated not constantly but regularly.
– The cube design and building process is the pivotal step on the way to successful data processing.

OLAP requirements
When the OLAP technology was invented there were twelve rules generated to follow so that it complies with the concept of online data processing:

Multidimensional
Not only the OLAP view has to be multidimensional but the data should as well be stored in this way of structure in order to provide the multidimensional analysis.

Transparent
The architecture has to be transparent to let the user see and understand the functionality and the client server of the application.

Accessible
The end user must have an opportunity to access the information in its consistent view without any issues related to the sources where the data come from or the way the data are maintained in OLAP.

Consistent Reporting
The data are regularly upgraded and its volume grows progressively although the user shouldn’t see problems changes in the process of scheduled reporting regarding that.

Client-Server
OLAP application has to manage client-server architecture as it manages vast volumes of data often requiring a core server for storage and maintenance.

Common Dimensionality
The main feature of the dimension structure in OLAP must be the same for all the dimensions to keep the data consistent, accurate, valid, complete, etc. Thus the dimensions have to possess common operation capabilities and be equal in structure.

Dynamic Sparse Matrix Handling
A usual OLAP application must manage to deal with sparse matrices and shouldn’t let the cube expand excessively as a usual OLAP cube is relatively sparse.

Multi-User
OLAP technology is originally supposed to provide an opportunity to access the data for multiple users simultaneously. The process of data management must at the same time be ensured with security and integrity.

Unrestricted Cross-dimensional Operations
A typical OLAP application is meant to handle all calculations and operations (such as slice-and-dice, drill up-down, drill through etc.) without the participation of the user. Commonly the tool delivers a language to exploit while requiring specified information.

Intuitive Data Manipulation
All OLAP operations which handle dimensions, measures, hierarchies, levels etc. have to be user-friendly and easily adopted without requiring additional technical skills. An average employee is considered to cope with the data navigation and management through clear displaying and handy operations.

Flexible Reporting
The main function – reporting must be flexible with a view to organizing all the rows, columns, and page setup containing a requisite number of dimensions and hierarchies from the data. As a result, the user has to gain a report comprising all the needed members and the relations between them.

Unlimited Dimensions and Aggregation Levels
When the technology was designed it was intended to be able to contain up to twenty dimensions in the cube. Each dimension had to provide as many aggregation levels inside a hierarchy as required. The idea was to manage great volumes of data keeping end-users absolutely aware of the performance of the organization.

Advantages of OLAP
Speed
Before OLAP was invented and introduced to the market there hadn’t been a tool to rapidly run the queries and it had taken long to retrieve the required information from the data. Thus the main advantage of the OLAP application is its speed gained due to precomputation of the data aggregations.

MDX designer and ad-hoc reports
MDX Designer is aimed at creating interactive ad-hoc reports. The reports provide a better understanding of the business processes and the organization’s performance in the market.

Visualization
OLAP provides its users with sophisticated data analytics allowing them to see data from different perspectives. There are numerous formats to visualize the requisite data: pie charts, graphs, heat maps, reports, pyramids, etc. Moreover, OLAP includes a number of operations to handle data: rotate, drill up and down, slice and dice, etc. Besides, there’s also an opportunity to apply a ‘what-if’ scenario due to a write-back option. All mentioned above can significantly contribute to decision-making process regarding the ongoing situation.

Flexibility
OLAP table displayed is flexible with column and row labels depending on the requirements of the user. Moreover, the reporting generated is available in multiple dimensions.

Data Science Modeling and Featurization

Overview

Data modeling is an essential part of the data science pipeline. This, combined with the fact that it is a very rewarding process, makes it the one that often receives the most attention among data science learners. However, things are not as simple as they may seem, since there is much more to it than applying a function from a particular class of a package and applying it on the data available.

A big part of data science modeling involves evaluating a model, for example, making sure that it is robust and therefore reliable. Also, data science modeling is closely linked to creating an information rich feature set. Moreover, it entails a variety of other processes that ensure that the data at hand is harnessed as much as possible.

What Is a Robust Data Model?

When it comes to robust models, worthy of making it to production, these need to tick several boxes. First of all, they need to have a good performance, based on various metrics. Oftentimes a single metric can be misleading, as how well a model performs has many aspects, especially for classification problems.

In addition, a robust model has good generalization. This means that the model performs well for various datasets, not just the one it has been trained on.

Sensitivity analysis is another aspect of a data science modeling, something essential for thoroughly testing a model to ensure it is robust enough. Sensitivity is a condition whereby a model’s output is bound to change significantly if the inputs change even slightly. This is quite undesirable and needs to be checked since a robust model ought to be stable.

Finally, interpretability is an important aspect too, though it’s not always possible. This has to do with how easy it is to interpret a model’s results. Many modern models, however, are more like black boxes, making it particularly difficult to interpret them. Nevertheless, it is often preferable to opt for an interpretable model, especially if we need to defend its outputs to others.

How Is Featurization Accomplished?

In order for a model to maximize its potential, it needs an information rich set of features. The latter can be created in various ways. Whatever the case, cleaning up the data is a prerequisite. This involves removing or correcting problematic data points, filling in missing values wherever possible, and in some cases removing noisy variables.

Before you can use variables in a model, you need to perform normalization on them. This is usually accomplished through a linear transformation ensuring that the variable’s values are around a certain range. Oftentimes, normalization is sufficient for turning your variables into features, once they are cleaned.

Binning is another process that can aid in featurization. This entails creating nominal (discreet) variables, which can in turn be broken down into binary features, to be used in a data model.

Finally, some dimensionality reduction method (e.g. PCA) can be instrumental in shaping up your feature-set. This has to do with creating linear combinations of features, aka meta-features, which express the same information in fewer dimensions.

Some Useful Considerations

Beyond these basic attributes of data science modeling there several more that every data scientist has in mind in order to create something of value from the available data. Things like in-depth testing using sensitivity analysis, specialized sampling, and various aspects of model performance (as well as tweaking the model to optimize for a particular performance metric) are parts of data science modeling that require meticulous study and ample practice. After all, even though this part of data science is fairly easy to pick up, it takes a while to master, while performing well in it is something that every organization can benefit from.

Resources

To delve more into all this, there are various relevant resources you can leverage, helping you in not just the methodologies involved but also in the mindset behind them. Here are two of the most useful ones.

  1. Data Science Modeling Tutorial on the Safari platform
  2. Data Science Mindset, Methodologies and Misconceptions book (Technics Publications)

Process Analytics – Data Analysis for Process Audit & Improvement

Process Mining: Innovative data analysis for process optimization and audit

Step-by-Step: New ways to detect compliance violations with Process Analytics

In the course of the advancing digitization, an enormous upheaval of everyday work is currently taking place to ensure the complete recording of all steps in IT systems. In addition, companies are increasingly confronted with increasingly demanding regulatory requirements on their IT systems.


Read this article in German:
“Process Mining: Innovative Analyse von Datenspuren für Audit und Forensik “


The unstoppable trend towards a connected world will further increase the possibilities of process transparency, but many processes in the company area are already covered by one or more IT systems. Each employee, as well as any automated process, leaves many data traces in IT backend systems, from which processes can be replicated retroactively or in real time. These include both obvious processes, such as the entry of a recorded purchase order or invoice, as well as partially hidden processes, such as the modification of certain entries or deletion of these business objects.

1 Understanding Process Analytics

Process Analytics is a data-driven methodology of the actual process analysis, which originates in forensics. In the wake of the increasing importance of computer crime, it became necessary to identify and analyze the data traces that potential criminals left behind in IT systems in order to reconstruct the event as much as possible.

With the trend towards Big Data Analytics, Process Analytics has not only received new data bases, but has also been further developed as an analytical method. In addition, the visualization enables the analyst or the report recipient to have a deeper understanding of even more complex business processes.

While conventional process analysis primarily involves employee interviews and monitoring of the employees at the desk in order to determine actual processes, Process Analytics is a leading method, which is purely fact-based and thus objectively approaching the processes. It is not the employees who are asked, but the IT systems, which not only store all the business objects recorded in a table-oriented manner, but also all process activities. Every IT system for enterprise purposes log all relevant activities of the whole business process, in the background and invisible to the users, such as orders, invoices or customer orders, with a time stamp.

2 The right choice of the processes to analyze

Today almost every company works with at least one ERP system. As other systems are often used, it is clear which processes can not be analyzed: Those processes, which are still carried out exclusively on paper and in the minds of the employees, which are typical decision-making processes at the strategic level and not logged in IT systems.

Operational processes, however, are generally recorded almost seamlessly in IT systems. Furthermore, almost all operational decisions are recorded by status flags in datasets.

The operational processes, which can be reconstructed and analyzed with Process Mining very well and which are of equal interest from the point of view of compliance, include for example:

– Procurement

– Logistics / Transport

– Sales / Ordering

– Warranty / Claim Management

– Human Resource Management

Process Analytics enables the greatest possible transparency across all business processes, regardless of the sector and the department. Typical case IDs are, for example, sales order number, procurement order number, customer or material numbers.

3 Selection of relevant IT systems

In principle, every IT system used in the company should be examined with regard to the relevance for the process to be analyzed. As a rule, only the ERP system (SAP ERP or others) is relevant for the analysis of the purchasing processes. However, for other process areas there might be other IT systems interesting too, for example separate accounting systems, a CRM or a MES system, which must then also be included.

Occasionally, external data should also be integrated if they provide important process information from externally stored data sources – for example, data from logistics partners.

4 Data Preparation

Before the start of the data-driven process analysis, the data directly or indirectly indicating process activities must be identified, extracted and processed in the data sources. The data are stored in database tables and server logs and are collected via a data warehousing procedure and converted into a process protocol or – also called – event log.

The event log is usually a very large and wide table which, in addition to the actual process activities, also contains parameters which can be used to filter cases and activities. The benefit of this filter option is, for example, to show only process flows where special product groups, prices, quantities, volumes, departments or employee groups are involved.

5 Analysis Execution

The actual inspection is done visually and thus intuitively with an interactive process flow diagram, which represents the actual processes as they could be extracted from the IT systems. The event log generated by the data preparation is loaded into a data visualization software (e.g. Celonis PM Software), which displays this log by using the case IDs and time stamps and transforms this information in a graphical process network. The process flows are therefore not modeled by human “process thinkers”, as is the case with the target processes, but show the real process flows given by the IT systems. Process Mining means, that our enterprise databases “talk” about their view of the process.

The process flows are visualized and statistically evaluated so that concrete statements can be made about the process performance and risk estimations relevant to compliance.

6 Deviation from target processes

The possibility of intuitive filtering of the process presentation also enables an analysis of all deviation of our real process from the desired target process sequences.

The deviation of the actual processes from the target processes is usually underestimated even by IT-affine managers – with Process Analytics all deviations and the general process complexity can now be investigated.

6 Detection of process control violations

The implementation of process controls is an integral part of a professional internal control system (ICS), but the actual observance of these controls is often not proven. Process Analytics allows circumventing the dual control principle or the detection of functional separation conflicts. In addition, the deliberate removal of internal control mechanisms by executives or the incorrect configuration of the IT systems are clearly visible.

7 Detection of previously unknown behavioral patterns

After checking compliance with existing controls, Process Analytics continues to be used to recognize previously unknown patterns in process networks, which point to risks or even concrete fraud cases and are not detected by any control due to their previously unknown nature. In particular, the complexity of everyday process interlacing, which is often underestimated as already mentioned, only reveals fraud scenarios that would previously not have been conceivable.

8 Reporting – also possible in real time

As a highly effective audit analysis, Process Analytics is already an iterative test at intervals of three to twelve months. After the initial implementation, compliance violations, weak or even ineffective controls, and even cases of fraud, are detected reliably. The findings can be used in the aftermath to stop the weaknesses. A further implementation of the analysis after a waiting period makes it possible to assess the effectiveness of the measures taken.

In some application scenarios, the seamless integration of the process analysis with the visual dashboard to the IT system landscape is recommended so that processes can be monitored in near real-time. This connection can also be supplemented by notification systems, so that decision makers and auditors are automatically informed about the latest process bottlenecks or violations via SMS or e-mail.

Fazit

Process Analytics is, in the course of the digitalization, the highly effective methodology from the area of ​​Big Data Analysis for detecting compliance-relevant events throughout the company and also providing visual support for forensic data analysis. Since this is a method, and not a software, an expansion of the IT system landscape, especially for entry, is not absolutely necessary, but can be carried out by internal or external employees at regular intervals.

Data Science Knowledge Stack – Abstraction of the Data Science Skillset

What must a Data Scientist be able to do? Which skills does as Data Scientist need to have? This question has often been asked and frequently answered by several Data Science Experts. In fact, it is now quite clear what kind of problems a Data Scientist should be able to solve and which skills are necessary for that. I would like to try to bring this consensus into a visual graph: a layer model, similar to the OSI layer model (which any data scientist should know too, by the way).
I’m giving introductory seminars in Data Science for merchants and engineers and in those seminars I always start explaining what we need to work out together in theory and practice-oriented exercises. Against this background, I came up with the idea for this layer model. Because with my seminars the problem already starts: I am giving seminars for Data Science for Business Analytics with Python. So not for medical analyzes and not with R or Julia. So I do not give a general knowledge of Data Science, but a very specific direction.

A Data Scientist must deal with problems at different levels in any Data Science project, for example, the data access does not work as planned or the data has a different structure than expected. A Data Scientist can spend hours debating its own source code or learning the ropes of new DataScience packages for its chosen programming language. Also, the right algorithms for data evaluation must be selected, properly parameterized and tested, sometimes it turns out that the selected methods were not the optimal ones. Ultimately, we are not doing Data Science all day for fun, but for generating value for a department and a data scientist is also faced with special challenges at this level, at least a basic knowledge of the expertise of that department is a must have.


Read this article in German:
“Data Science Knowledge Stack – Was ein Data Scientist können muss“


Data Science Knowledge Stack

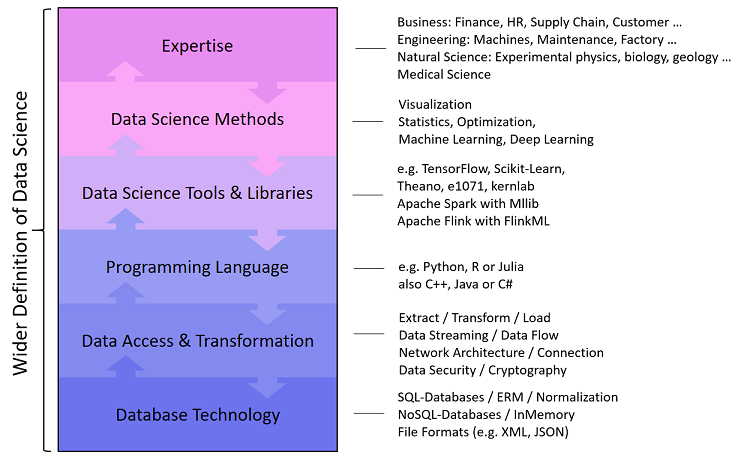
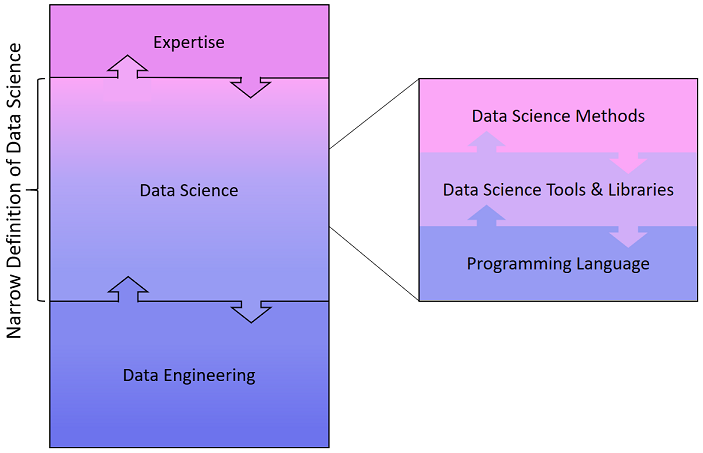
With the Data Science Knowledge Stack, I would like to provide a structured insight into the tasks and challenges a Data Scientist has to face. The layers of the stack also represent a bidirectional flow from top to bottom and from bottom to top, because Data Science as a discipline is also bidirectional: we try to answer questions with data, or we look at the potentials in the data to answer previously unsolicited questions.

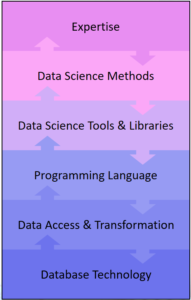
The DataScience Knowledge Stack consists of six layers:

Database Technology Knowledge

A Data Scientist works with data which is rarely directly structured in a CSV file, but usually in one or more databases that are subject to their own rules. In particular, business data, for example from the ERP or CRM system, are available in relational databases, often from Microsoft, Oracle, SAP or an open source alternative. A good Data Scientist is not only familiar with Structured Query Language (SQL), but is also aware of the importance of relational linked data models, so he also knows the principle of data table normalization.

Other types of databases, so-called NoSQL databases (Not only SQL) are based on file formats, column or graph orientation, such as MongoDB, Cassandra or GraphDB. Some of these databases use their own programming languages ​​(for example JavaScript at MongoDB or the graph-oriented database Neo4J has its own language called Cypher). Some of these databases provide alternative access via SQL (such as Hive for Hadoop).

A data scientist has to cope with different database systems and has to master at least SQL – the quasi-standard for data processing.

Data Access & Transformation Knowledge

If data are given in a database, Data Scientists can perform simple (and not so simple) analyzes directly on the database. But how do we get the data into our special analysis tools? To do this, a Data Scientist must know how to export data from the database. For one-time actions, an export can be a CSV file, but which separators and text qualifiers should be used? Possibly, the export is too large, so the file must be split.
If there is a direct and synchronous data connection between the analysis tool and the database, interfaces like REST, ODBC or JDBC come into play. Sometimes a socket connection must also be established and the principle of a client-server architecture should be known. Synchronous and asynchronous encryption methods should also be familiar to a Data Scientist, as confidential data are often used, and a minimum level of security is most important for business applications.

Many datasets are not structured in a database but are so-called unstructured or semi-structured data from documents or from Internet sources. And again we have interfaces, a frequent entry point for Data Scientists is, for example, the Twitter API. Sometimes we want to stream data in near real-time, let it be machine data or social media messages. This can be quite demanding, so the data streaming is almost a discipline with which a Data Scientist can come into contact quickly.

Programming Language Knowledge

Programming languages ​​are tools for Data Scientists to process data and automate processing. Data Scientists are usually no real software developers and they do not have to worry about software security or economy. However, a certain basic knowledge about software architectures often helps because some Data Science programs can be going to be integrated into an IT landscape of the company. The understanding of object-oriented programming and the good knowledge of the syntax of the selected programming languages ​​are essential, especially since not every programming language is the most useful for all projects.

At the level of the programming language, there is already a lot of snares in the programming language that are based on the programming language itself, as each has its own faults and details determine whether an analysis is done correctly or incorrectly: for example, whether data objects are copied or linked as reference, or how NULL/NaN values ​​are treated.

Data Science Tool & Library Knowledge

Once a data scientist has loaded the data into his favorite tool, for example, one of IBM, SAS or an open source alternative such as Octave, the core work just began. However, these tools are not self-explanatory and therefore there is a wide range of certification options for various Data Science tools. Many (if not most) Data Scientists work mostly directly with a programming language, but this alone is not enough to effectively perform statistical data analysis or machine learning: We use Data Science libraries (packages) that provide data structures and methods as a groundwork and thus extend the programming language to a real Data Science toolset. Such a library, for example Scikit-Learn for Python, is a collection of methods implemented in the programming language. The use of such libraries, however, is intended to be learned and therefore requires familiarization and practical experience for reliable application.

When it comes to Big Data Analytics, the analysis of particularly large data, we enter the field of Distributed Computing. Tools (frameworks) such as Apache Hadoop, Apache Spark or Apache Flink allows us to process and analyze data in parallel on multiple servers. These tools also provide their own libraries for machine learning, such as Mahout, MLlib and FlinkML.

Data Science Method Knowledge

A Data Scientist is not simply an operator of tools, he uses the tools to apply his analysis methods to data he has selected for to reach the project targets. These analysis methods are, for example, descriptive statistics, estimation methods or hypothesis tests. Somewhat more mathematical are methods of machine learning for data mining, such as clustering or dimensional reduction, or more toward automated decision making through classification or regression.

Machine learning methods generally do not work immediately, they have to be improved using optimization methods like the gradient method. A Data Scientist must be able to detect under- and overfitting, and he must prove that the prediction results for the planned deployment are accurate enough.

Special applications require special knowledge, which applies, for example, to the fields of image recognition (Visual Computing) or the processing of human language (Natural Language Processiong). At this point, we open the door to deep learning.

Expertise

Data Science is not an end in itself, but a discipline that would like to answer questions from other expertise fields with data. For this reason, Data Science is very diverse. Business economists need data scientists to analyze financial transactions, for example, to identify fraud scenarios or to better understand customer needs, or to optimize supply chains. Natural scientists such as geologists, biologists or experimental physicists also use Data Science to make their observations with the aim of gaining knowledge. Engineers want to better understand the situation and relationships between machinery or vehicles, and medical professionals are interested in better diagnostics and medication for their patients.

In order to support a specific department with his / her knowledge of data, tools and analysis methods, every data scientist needs a minimum of the appropriate skills. Anyone who wants to make analyzes for buyers, engineers, natural scientists, physicians, lawyers or other interested parties must also be able to understand the people’s profession.

Engere Data Science Definition

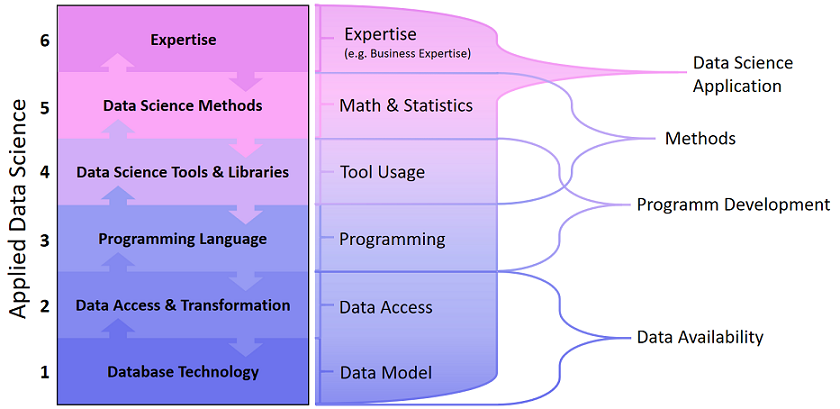
While the Data Science pioneers have long established and highly specialized teams, smaller companies are still looking for the Data Science Allrounder, which can take over the full range of tasks from the access to the database to the implementation of the analytical application. However, companies with specialized data experts have long since distinguished Data Scientists, Data Engineers and Business Analysts. Therefore, the definition of Data Science and the delineation of the abilities that a data scientist should have, varies between a broader and a more narrow demarcation.


A closer look at the more narrow definition shows, that a Data Engineer takes over the data allocation, the Data Scientist loads it into his tools and runs the data analysis together with the colleagues from the department. According to this, a Data Scientist would need no knowledge of databases or APIs, neither an expertise would be necessary …

In my experience, DataScience is not that narrow, the task spectrum covers more than just the core area. This misunderstanding comes from Data Science courses and – for me – I should point to the overall picture of Data Science again and again. In courses and seminars, which want to teach Data Science as a discipline, the focus will of course be on the core area: programming, tools and methods from mathematics & statistics.

Is Data Science the new Statistics?

Table of Contents

1 Introduction

2 Emerging of Data Science

3 Big data technologies

4 Two data worlds: Predictive vs inferential statistics

5 How to study data science

6 Conclusions

7 References

Introduction

As a student of Statistics and the winner of Data Science Scholarship I am often surrounded by computer scientists, mathematicians, physicists and of course statisticians. During conversation, I was asked questions such as “So what actually do I do? What is Data Science?”. These are some very difficult questions and as like you will see during reading this document many before me tried to answer those questions. There is a dispute between statisticians and computer scientists what is the origin of data science and who should teach it. According to the Institute of Mathematical Statistics in the: “The IMS presidential address: let us own data science” we can find a simple recipe for data scientist. [1]

“Putting the traits of Turner and Carver together gives a good portrait of a data scientist:

  • Statistics (S)
  • Domain/Science knowledge (D)
  • Computing (C)
  • Collaboration/teamwork (C)
  • Communication to outsiders (C)

That is, data science = SDCCC = S DC3

However, despite all the challenges that I will need to overcome in answering those questions I will try to do it. I will refer to ideas from several reputable sources, in which I will also tell you: what is in the data science that I am really fascinated about? What is magical in this creation of statistics and computer science that I am drawn to?

Emerging of Data Science

On Tuesday, the 8th of September 2015, University of Michigan announced the 100 million dollars “Data Science Initiative” (DSI), hired 35 new faculty members. On the DSI website we can read about this initiative:

“This coupling of scientific discovery and practice involves the collection, management, processing, analysis, visualisation, and interpretation of vast amounts of heterogeneous data associated with a diverse array of scientific, translational and interdisciplinary applications”2

But that sounds like a bread and butter for statisticians. So, is it really a new creation or is it something that exists for many years but it didn’t sound so sexy as data science? In the article written by Karl Broman, (the University of Wisconsin) we can read:

“When physicists do mathematics, they’re don’t say they’re doing “number science”. They’re doing math. If you’re analyzing data, you’re doing statistics. You can call it data science or informatics or analytics or whatever, but it ‘s still statistics. If you say that one kind of data analysis is statistics and another kind is not, you’re not allowing innovation. We need to define the field broadly. You may not like what some statisticians do. You may feel they don’t share your values. They may embarrass you. But that shouldn’t lead us to abandon the term “statistics”.

Reading the definition of data science on the Data Science Association’s “Professional Code of Conduct”:

“Data scientist means a professional who uses scientific methods to liberate and create meaning from raw data”

These sound like K. Browman maybe right. Maybe I should go on MSc Statistics like many before me did. Maybe Data Science is simply a new sexy name for statistician only data is big, technology more advanced rather than it used to be so you need to have programming skills to handle the data. Maybe let say loudly data science is a modern version of statistics? But maybe not? Because we can also find statements like the following:

“Statistics is the least important part of data science”. [3]

Further, we can read:

“There ‘s so, much that goes on with data that is about computing, not statistics. I do think it would be fair to consider statistics (which includes sampling, experimental design, and data collection as well as data analysis (which itself includes model building, visualization, and model checking as well as inference)) as a subset of data science. . . .”.[3]

So maybe people from computer science are right. Maybe I should go and study programming and forget about expanding my knowledge in statistics? After all, we all know that computer science always had much bigger funding and having MSc computer science was always like a magic star for employers. What should I do? Let me research further.

Big data technologies

Is the data size important to distinguish between data science and statistics? Going back to the “Let us own data science” article we can read that a statistician, Hollerith, invented the punched card reader to allow e cient compilation of a US census, the first elements of machine learning. So, no, machine learning is not an invention of computer scientists. It was well known for statistician for decades already. What about different techniques used in DOE (Design of Experiments) or sampling methods to decrease the sample size. If the data used by statisticians would be only small they wouldn’t have to discover methods such PCA (Principle component analysis) or dimensionality reduction techniques. So, no, data can be big and/or small for statisticians, so what is the difference between data science and statistics and what department should I choose?

When I spoke to computer scientists they try to convince me to choose computer science department. Their reasons being that there are many different programmes that I need to know to deal with large datasets. For instance: Java, Hadoop, SQL, Python, and much more. Moreover, programming can only be taught to the best standard through computer science courses Is it true? Can’t we do the same calculations using statistical software such as R, SAS or even Matlab? But on the other hand, doesn’t the newest technology always work faster? And if so, wouldn’t be better to use the newest technology when we program and write loops?

But, I don’t want to underestimate the effort made by statisticians and data analyst over last 50 years in developing statistical programmes. Their efforts have resulted in the emergence of today’s technology. Early statistical packages such as SPSS or Minitab (from 1960’s) allowed to develop more advanced programmes having roots in mini computer era such as STATA or my favourite R which in turn allowed progress to advanced technology even further and create Python, Hadoop, SQL and so on. Becker and Chambers (with S) and later Ihaka, Gentleman, and members of the R Core team (with R) worked on developing the statistical software. These names should be convincing about how powerful statistical programming languages can be. Many operations that we can do in Hadoop or SQL we can also do easily in R.

Two data worlds: Predictive vs inferential statistics

So maybe Data Science is a creature merged by statisticians working on computer science department? Maybe there are two different approaches to statistics: mathematical statistics and computer science statistics and the computer science statisticians are data scientists because according to Yanir Seroussi in his blog:

“A successful data scientist needs to be able to “become one with the data” by exploring it and applying rigorous statistical analysis (right-hand side of the continuum). But good data scientists also understand what it takes to deploy production systems, and are ready to get their hands dirty by writing code that cleans up the data or performs core system functionality (lefthand side of the continuum). Gaining all these skills takes time.”[4]

Okay, so my reasoning that some statisticians work on computer science department is right, as well as there exists subject like computational statistics, so maybe I should go for computer science department but study statistics.

In fact, I am not the first one to arrive at the conclusion. Everything started from a confession made by John Tukey in “The Future of Data Analysis” article published in “The Annals of Mathematical Statistics” :

For a long time, I have thought I was a statistician, interested in inferences from the particular to the general. But as I have watched mathematical statistics evolve, I have had cause to wonder and to doubt. … All in all I have come to feel that my central interest is in data analysis, which I take to include, among other things: procedures for analyzing data, techniques for interpreting the results of such procedures, ways of planning the gathering of data to make its analysis easier, more precise or more accurate, and all the machinery and results of (mathematical) statistics which apply to analyzing data

If I am right then above confession was a critical moment. The time when mathematical statistics become more inferential and computational statistics concentrated more on predictive statistics. Applied statisticians working on predictive analytics that are more interested in applying the knowledge rather than developing long proofs decided to move on computer science department.

Additionally, the following is crucial discussion made by Leo Biermann in his paper published in Statistical Science titled “Statistical modelling: the two cultures”. It enables us to understand and differentiate views from both types of statistician, namely mathematical and statistical.

Statistics starts with data. Think of the data as being generated by a black box in which a vector of input variables x (independent variables) go in one side, and on the other side the response variables y come out. Inside the black box, nature functions to associate the predictor variables with the response variables … There are two goals in analyzing the data:

  • Prediction. To be able to predict what the responses are going to be to future input variables
  • InferenceTo [infer] how nature is associating the response variables to the input variables.”

Furthermore, in the same dispute we can read:

“The statistical community has been committed to the almost exclusive use of [generative] models. This commitment has led to irrelevant theory, questionable conclusions, and has kept statisticians from working on a large range of interesting current problems. [Predictive] modeling, both in theory and practice, has developed rapidly in fields outside statistics. It can be used both on large complex data sets and as a more accurate and informative alternative to data modeling on smaller data sets. If our goal as a field is to use data to solve problems, then we need to move away from exclusive dependence on [generative] models …”

So, we can say that Data Science evolved from Predictive Analytics which in turn evolved from Statistics but it becomes separate science. Tukey and Wilk 1969 compared this new science to established sciences and further circumscribed the role of Statistics within it:

“ … data analysis is a very di cult field. It must adapt itself to what people can and need to do with data. In the sense that biology is more complex than physics, and the behavioural sciences are more complex than either, it is likely that the general problems of data analysis are more complex than those of all three. It is too much to ask for close and effective guidance for data analysis from any highly formalized structure, either now or in the near future. Data analysis can gain much from formal statistics, but only if the connection is kept adequately loose”

How to study data science

So, what is exactly predictive analytics culture? I think that everyone who used Kaggle competition before can agree with me that description of common task framework (CTF) formulated by Marc Liberman in 2009 is a perfect description of Kaggle competitions, and hackathons events; where latter has worked as training sessions for newbies in the data world. An instance of the CTF has these ingredients:

  1. A publicly available training data set involving, for each observation, a list of (possibly many) feature measurements, and a class label for that observation.
  2. A set of enrolled competitors whose common task is to infer a class prediction rule from the training data.
  3. A scoring referee, to which competitors can submit their prediction rule. The referee runs the prediction rule against a testing dataset which is sequestered behind a Chinese wall. The referee objectively and automatically reports the score (prediction accuracy) achieved by the submitted rule

Kaggle competitions are not only training platforms for newbies like me but also very challenging statistical competitions where experienced statisticians can win “pocket money”. A famous example is the Netflix Challenge where the common task was to predict Netflix user movie selection. The winning team (which included ATT Statistician Bob Bell) won 1 mln dollars.

Comparing modules that are available on master in data science at University of Berkley[6]:

  1. Both
  • Applied machine learning
  • Experiments and causality
  1. Statistics
  • Research design and application for data and analysis
  • Statistics for Data Science
  • Behind the data: humans and values
  • Statistical methods for discrete response, Time Series and panel data
  • Data visualisation
  1. Computer Science
  • Python for Data Science
  • Storing and Retrieving Data
  • Scalling up! Really Big Data
  • Machine Learning at scale
  • Natural Language Processing with Deep Learning

We can really see that data science is a subject that demands skills from both computer science and statistics. So, it is another confirmation for me that it is the best time to change department for my postgraduate study, that is, to study statistics on computer science department.

In the 50 Years of Data Science article we can read: “The activities of Greater Data Science are classified into 6 divisions:

  1. Data exploration and preparation
  2. Data representation and transformation
  3. Computing with data
  4. Data visualization and presentation
  5. Data Modelling
  6. Science about data science [5]

I will quickly go through all of them using my Ebola research example, this required using machine learning on time series data.

  1. The most demanding part. Many people told me before starting this project that: collecting, cleaning, wrangling and preparing data take 60% of all the time that you need to spend on data science project. I didn’t realise how much this 60% means in real time. I didn ‘t realise that the 60 percent will take so much time and that after this I will be exhausted. Exhausted but ready for the next step.
  2. This point is actually part of the first one, or maybe just like many other things in statistics: everything is one huge connected bunch.Data that you can find can be very nice, well behaving, written in CSV or JSON or any other format file that you can quickly download and use, but what if not? What if your data is ‘dirty’and not stored as a file (e.g. only appear on a website)? What if data is coded? Do you need to decode it?
  3. The even bigger challenge, but what a fun? You need to know a few different programming languages or least as I do know a little bit of R, a little bit of Python, quite well Tableau and Excel. So you can use different program in different scenarios or for different tasks. For example, using Panda to do EDA and ggplot 2 to do data vis.
  4. Graphs are pretty, right? If you are still reading my article, I bet you know what is heat map, spatial vis in big cities or different infographics. Surely, I would like to highlight, that we respect only the ones that are not only pretty but also valid. Nevertheless, time that is required to create these visualisations is another matter.
  5. The data modelling, finally? I don’t need to say a lot about this. All forms of inferential and predictive analytic are allowed and accepted.
  6. My favourite part, not the end yet. All the conferences and meetups that I can attend on. All the seminars where we all present our current projects.

Conclusions

After graduation, I will be graduated Statistician. Even more, I will be a mathematical statistician whom mostly during degree dealt with inferential statistics. On the other hand, winning data science scholarship gave me exposure to predictive analytic which I highly enjoyed. Therefore, for my next stage, I will just change my department and concentrate more on predictive analytic. There are many statisticians working on computer science department. They possess both statistical knowledge and advanced software engineering skills, they are called data scientists. It would be a pleasure for me to join them. I don’t mind if it will be MSc. Computer Science, MSc. Data Science, MSc. Big Data or whatever the name will be. I do mind to have sufficient exposure to deal with “dirty” data using statistical modelling and machine learning using modern technology. This is what data science is for me. Maybe for you, it will be something else. Maybe you will be more satisfied with expanding massively programming skills. But for me, programming is a tool, modern technology is my friend and my bread and butter will be predictive analytic.

References

  1. IMS Presidential Address: Let us own data science
  2. Data science is statistics
  3. A Gelman, Columbia University
  4. Yanir Seroussi: What is data Science?
  5. 50 Years Data Science
  6. Curriculum: data science@Berkley

The Future of CRM Systems

Growth comes hand in hand with technology advancement. Today CRM software help in handling all customer data including buying habits for as long as they are attached to the company. With all the data collected, what next? How can CRM systems make things better? Most companies find themselves with a lot of data on their hands but fewer tools to capitalize on it.

To have a glimpse at the future of CRM systems, we ought to recognize the problems businesses have now. The critical issue for most companies is to offer personalized communication and products. What should we expect from these systems in the future? Why the need for improved CRM systems?

Retaining customers is easier than pitching new ones. Your clients also become an essential marketing tool. Most of the referrals you get will be from proud customers. With this said, there is the need of a system that enables a business to offer targeted information and products to the customers.

Systems that can Collect all Customer Data even from Other Markets

At the moment, your client information is only based on what you have collected internally. But wouldn’t you want to have a sneak preview of what your customer’s buying habits are outside your business? This will help you come up with relevant data that will meet customer needs. When there is a centralized unit that collects customer data from several sources and shares appropriately, business owners benefit more from the information they garner.

The Birth of Intelligent Units for Business Owners

In the future, we see business owners accessing software or multiple units that can bring order in data collection, analyzing and grouping. With all the data collected, companies are overwhelmed when it comes to utilization. Intelligent systems can analyze and even recommend proper usage of each set of data. This means customized products, recommendations, and appropriate sales formulas.

With all the data collected, businesses are overwhelmed when coming up with sales campaigns. Most of the effort is not recognized because it is not unique to customer needs. Many clients don’t even open emails from shopping outlets because they deem it as a waste of time. It is time to change this notion.

The Need to Use Different Marketing Channels

What if based on the customer data you have collected, you can reach clients through various means? Technology allows a person to use different devices all at the same time. Mobile marketing has not been delved into exhaustively, yet mobile devices are more popular nowadays because of the convenience they bring along. Some people no longer use PCs. When systems target mobile devices, chances of getting a better response are higher.

Social Media Integration

How can you profit from your clients’ social trends? Marketing can be easier when CRMs take into account social media habits. These should be customer specific with approaches that are both friendly, engaging and to the point.

Personalized Services

CRMs in the future will be able to detect customer preferences, styles, and tastes. What is your favorite color? How do you like your products packaged? Have you changed your address? Future systems will be able to detect this quickly and even update business data. No more wrong shipments or guessing what your customers would prefer? The systems will even be able to identify future buying trends that companies can use to their advantage. Customer understanding is vital when offering personalized services.

Customer Involvement

Through improved CRM systems customers can find it easier to make recommendations, offer suggestions and even get involved in the developments in the company. The more interactive a business is, the longer the clients will stay around meaning more sales. Systems can periodically interact with customers on given topics such as new product suggestions, the feedback of which can be useful for growth.

Customer interaction is also essential in promoting product knowledge. All the emails, inquiries and questions coming in can be overwhelming, but when a business has artificial intelligent units handling the incoming traffic, things get easier and tailor made to satisfy customer requests.

Sales Automation

In the future, the need to go through every order and dispatch will be a thing of the past. Systems will automatically detect orders, specifications and make appropriate shipments. This will make things easier and even reduce time spent on each order. CRMs will be able to work on multiple orders efficiently without human supervision. This will enhance a 24-hour working economy. The intelligent units will work day and night meaning that most business operations will go on past the regular working hours without having to employ more staff.

Efficient CRM use will reduce operating costs for most businesses. The need to have many employees or bigger operational space will go down. Customer expectations will be met which will mean better relations. This will result in a vibrant economy.

Ways AI & ML Are Changing How We Live

From Amazon’s Alexa, a personal assistant that can do anything from making your to-do list to giving a wide range of real-time information about the world around you, to Google’s DeepMind that has very recently made headlines for possibly being able to predict the future, AI and ML are the biggest development in human history.

Machine Learning Used by Hospitals

We hear a lot about Artificial Intelligence (AI) in the realm of insurance Big Data, but there isn’t much buzz around how AI and ML are revolutionising hospitals. The national health expenditures were around $3.4 trillion and estimated to increase from 17.8 percent of GDP to 19.9 percent between 2015 and 2025. By 2021, industry analysts have predicted that the AI health market will reach $6.6 billion. By 2026, such increases in AI technology in the healthcare sector will save the economy around $150 billion annually.

Some of the most popular Artificial Intelligence applications used in hospitals now are:

  • Predictive Health Trackers – Technology that has the ability to monitor patients’ health status using real-time data collection. One such technology is the Health and Environmental Tracker (HET) which can predict if someone is about to have an asthma attack.
  • Chatbots – It isn’t only retail customer service that uses chatbots to deal with consumers. Now hospitals have automated physicians that inquire and route clinicians to the right specialists.
  • Predictive AnalyticsCleveland Clinics have partnered with Microsoft (Cortana) while John Hopkins has partnered up with GE in order to create Machine Learning technology that has the ability to monitor patients and prevent patient emergencies before they happen. It does this by analysing data for primary indicators of potential risks.

Cognitive Marketing – Content Marketing on Steroids

Customer experience and content marketing are terms often tossed around in the world of business and advertising these days. Why do we bring them up now, you ask? Well, things are about to be kicked into sixth gear, thanks to Cognitive Marketing. To explain what that is, let’s go back a bit: remember when Google’s DeepMind AlphaGo bested the top human player at the game? This wasn’t some computer beating a bored office clerk at the game of Solitaire. In order to achieve that victory, Google’s AI had to “actually show its cognitive capability to ‘think’ like humans, because to win the game, ‘intuition’ was needed rather than just ‘logical reasoning’.” Similar algorithm-powered AI’s are enabling machines to learn and grow on their own. Soon, they’ll reach the potential to create content for marketeers at a massive scale. Not only that, but they’ll always deliver the right content, to the right kind of audience, at just the right time.

More Ways Than One: How Retail Is Harnessing AI & ML

  1. Developing Store That Don’t Need Checkout Lines

Tech companies and online retail giants such as Amazon want to create cashier-free stores, at least they are trying to. Last year Amazon launched its Amazon Go which uses sensors and hundreds of cameras to track what customers pick up and then charge the amount to an application on their smart phone, put simply. But only months into the experiment Amazon has said they need to work out some kinks in the system. As of now, Amazon Go’s system can only handle 20 or so customers at a time.

Among other issues, The Guardian, citing an unnamed source, wrote in an article, stated “…if an item has been moved from its specific spot on the shelf.”  Located in Seattle, Washington, Amazon Go is now running in “beta mode” only for Amazon employees as it tests its systems. And these tests are showing that Amazon’s attempt at a cashier-free brick-and-mortar convenience store is far from ready for the real world. A Journal report stated, “For now, the technology functions flawlessly only if there are a small number of customers present, or when their movements are slow.”

  1. Could Drones Be Delivering Goods to Your Home One Day?

Imagine ordering something online from, let’s say, Amazon, and it arrives at your door in 30 minutes or so via drone. Does that sound like something out of the movie The Fifth Element? Maybe, but this technology is already is already here.

Amazon Prime Air made its first delivery to a customer via a GPS-guided flying drone on December 7th, 2016. It only took 13 minutes for the drone to deliver the merchandise to the customer. This sort of technology will be a huge game changer for retail. The supply chain industry is headed for a revolution – drone delivery is coming, and retailers who want to keep up really should adopt such technologies.

Even in 2016, consumers were totally ready to accept drone delivery. The Walk Sands Future of Retail 2016 Study showed that 79 percent of US consumers said they would be “very likely” or “somewhat likely” to choose drone delivery if their product could be delivered within an hour. For me, I’d choose it just to see how cool it was. I think it would be pretty rad to have a drone land in my yard with my package, don’t you? Furthermore, other consumers stated they would pay up to $10 for a drone delivery. Lastly, 26 percent of consumers are already expecting to have their packages delivered to them in the next two years or so.

Driverless Delivery Vehicles Already Here as Well

There was a movie I watched some months ago – you most likely heard of it or even watched it. It was the latest movie about Wolverine titled Logan. There was a certain scene that never left my memory (basically because I found it awesome) where Logan and his companions were driving along a freeway full of driverless tractor trailers that had no tractor.

In an article written for pastemagazine.com, Carlos Alvarez of Getty wrote: “… Logan’s writer and director James Mangold’s inclusion of the self-driving trucking machines make it clear that the filmmaker understands the writing on the wall about the future of shipping. It’s a future without truck drivers.” He continues to explain that the movie takes place a little over 10 years from now in 2029.

“The change may well be here long before 2029. It’s only 2017, and already we’re seeing the beginnings of automated trucking taking over the industry. At the 2017 Consumer Electronics Show this January, Peloton Technology demonstrated “platooning,” where trucks are kept in a row on the highway to reduce wind resistance and save fuel. The trucks are controlled by computers on a “Level One” of autonomous driving,” Alvarez continued in his article.

Now in Germany, Mercedes-Benz is has been developing and testing their Actros truck which is fitted with a ‘highway pilot’ system, which acts like an auto-pilot and includes a radar and stereo camera system. So far, German carmaker Daimler has restricted testing on a German autobahn. The autobahn is generally safer than testing in city conditions since the curves are not as steep. Since the tests have started, this autonomous truck has already driven over 20,000 kilometres.

Did I Say Flying Taxis? Huh, Yeah I Did!

But, if you are still not amazed, then I am about to blow your socks off. Dubai has promised to build a fully autonomous public transportation system by 2030, including autonomous flying drone taxis! Now that is really something. And it isn’t a matter of when they’ll be produced and in use because they already are.

Manufactured in China by the drone-making firm EHang, these really freaking cool quad drones on steroids can carry one person weighing up to 100 kilogrammes (I weigh over that, guess I’m walking) plus maybe a backpack or suitcase. They can fly about 30 kilometres (or 19 miles), at a speed of 60 miles per hour, give or take. And, if that isn’t the cool part, you won’t need any lessons on how to fly it. Simply push a button and it flies you from point A to point B. Whether or not you have to give it directions, don’t know. Either way, this is mostly likely the coolest piece of tech out there right now.

Copyright @ CBS Interactive Inc.

Establish a Collaborative Culture – Process Mining Rule 4 of 4

This is article no. 4 of the four-part article series Privacy, Security and Ethics in Process Mining.

Read this article in German:
Datenschutz, Sicherheit und Ethik beim Process Mining – Regel 4 von 4

Perhaps the most important ingredient in creating a responsible process mining environment is to establish a collaborative culture within your organization. Process mining can make the flaws in your processes very transparent, much more transparent than some people may be comfortable with. Therefore, you should include change management professionals, for example, Lean practitioners who know how to encourage people to tell each other “the truth”, in your team.

Furthermore, be careful how you communicate the goals of your process mining project and involve relevant stakeholders in a way that ensures their perspective is heard. The goal is to create an atmosphere, where people are not blamed for their mistakes (which only leads to them hiding what they do and working against you) but where everyone is on board with the goals of the project and where the analysis and process improvement is a joint effort.

Do:

  • Make sure that you verify the data quality before going into the data analysis, ideally by involving a domain expert already in the data validation step. This way, you can build trust among the process managers that the data reflects what is actually happening and ensure that you have the right understanding of what the data represents.
  • Work in an iterative way and present your findings as a starting point for discussion in each iteration. Give people the chance to explain why certain things are happening and let them ask additional questions (to be picked up in the next iteration). This will help to improve the quality and relevance of your analysis as well as increase the buy-in of the process stakeholders in the final results of the project.

Don’t:

  • Jump to conclusions. You can never assume that you know everything about the process. For example, slower teams may be handling the difficult cases, people may deviate from the process for good reasons, and you may not see everything in the data (for example, there might be steps that are performed outside of the system). By consistently using your observations as a starting point for discussion, and by allowing people to join in the interpretation, you can start building trust and the collaborative culture that process mining needs to thrive.
  • Force any conclusions that you expect, or would like to have, by misrepresenting the data (or by stating things that are not actually supported by the data). Instead, keep track of the steps that you have taken in the data preparation and in your process mining analysis. If there are any doubts about the validity or questions about the basis of your analysis, you can always go back and show, for example, which filters have been applied to the data to come to the particular process view that you are presenting.