All about Big Data Storage and Analytics

Simple RNN

Prerequisites for understanding RNN at a more mathematical level

Writing the A gentle introduction to the tiresome part of understanding RNN Article Series on recurrent neural network (RNN) is nothing like a creative or ingenious idea. It is quite an ordinary topic. But still I am going to write my own new article on this ordinary topic because I have been frustrated by lack of sufficient explanations on RNN for slow learners like me.

I think many of readers of articles on this website at least know that RNN is a type of neural network used for AI tasks, such as time series prediction, machine translation, and voice recognition. But if you do not understand how RNNs work, especially during its back propagation, this blog series is for you.

After reading this articles series, I think you will be able to understand RNN in more mathematical and abstract ways. But in case some of the readers are allergic or intolerant to mathematics, I tried to use as little mathematics as possible.

Ideal prerequisite knowledge:

  • Some understanding on densely connected layers (or fully connected layers, multilayer perception) and how their forward/back propagation work.
  •  Some understanding on structure of Convolutional Neural Network.

*In this article “Densely Connected Layers” is written as “DCL,” and “Convolutional Neural Network” as “CNN.”

1, Difficulty of Understanding RNN

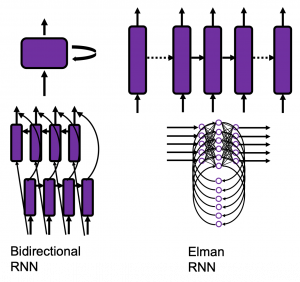
I bet a part of difficulty of understanding RNN comes from the variety of its structures. If you search “recurrent neural network” on Google Image or something, you will see what I mean. But that cannot be helped because RNN enables a variety of tasks.

Another major difficulty of understanding RNN is understanding its back propagation algorithm. I think some of you found it hard to understand chain rules in calculating back propagation of densely connected layers, where you have to make the most of linear algebra. And I have to say backprop of RNN, especially LSTM, is a monster of chain rules. I am planing to upload not only a blog post on RNN backprop, but also a presentation slides with animations to make it more understandable, in some external links.

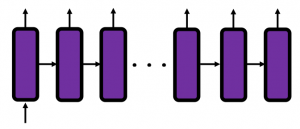
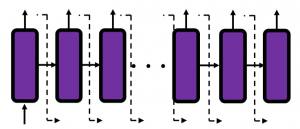
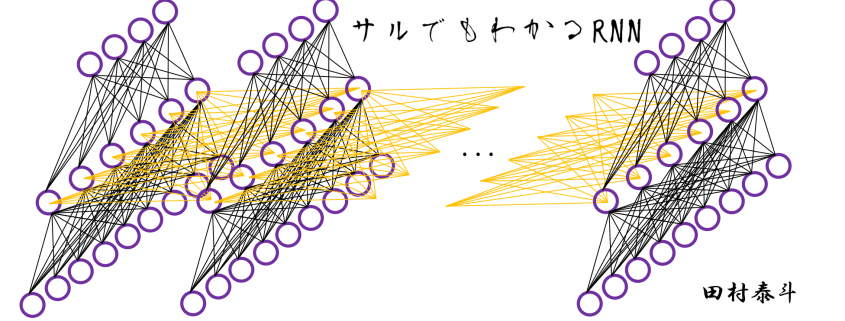
In order to avoid such confusions, I am going to introduce a very simplified type of RNN, which I call a “simple RNN.” The RNN displayed as the head image of this article is a simple RNN.

2, How Neurons are Connected

    \begin{equation*}   1 = 3 - 2 \end{equation*}

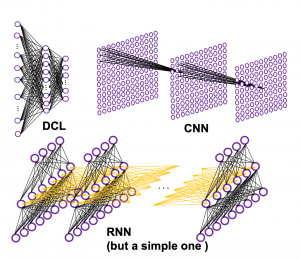
How to connect neurons and how to activate them is what neural networks are all about. Structures of those neurons are easy to grasp as long as that is about DCL or CNN. But when it comes to the structure of RNN, many study materials try to avoid showing that RNNs are also connections of neurons, as well as DCL or CNN(*If you are not sure how neurons are connected in CNN, this link should be helpful. Draw a random digit in the square at the corner.). In fact the structure of RNN is also the same, and as long as it is a simple RNN, and it is not hard to visualize its structure.

Even though RNN is also connections of neurons, usually most RNN charts are simplified, using blackboxes. In case of simple RNN, most study material would display it as the chart below.

But that also cannot be helped because fancier RNN have more complicated connections of neurons, and there are no longer advantages of displaying RNN as connections of neurons, and you would need to understand RNN in more abstract way, I mean, as you see in most of textbooks.

I am going to explain details of simple RNN in the next article of this series.

3, Neural Networks as Mappings

If you still think that neural networks are something like magical spider webs or models of brain tissues, forget that. They are just ordinary mappings.

If you have been allergic to mathematics in your life, you might have never heard of the word “mapping.” If so, at least please keep it in mind that the equation y=f(x), which most people would have seen in compulsory education, is a part of mapping. If you get a value x, you get a value y corresponding to the x.

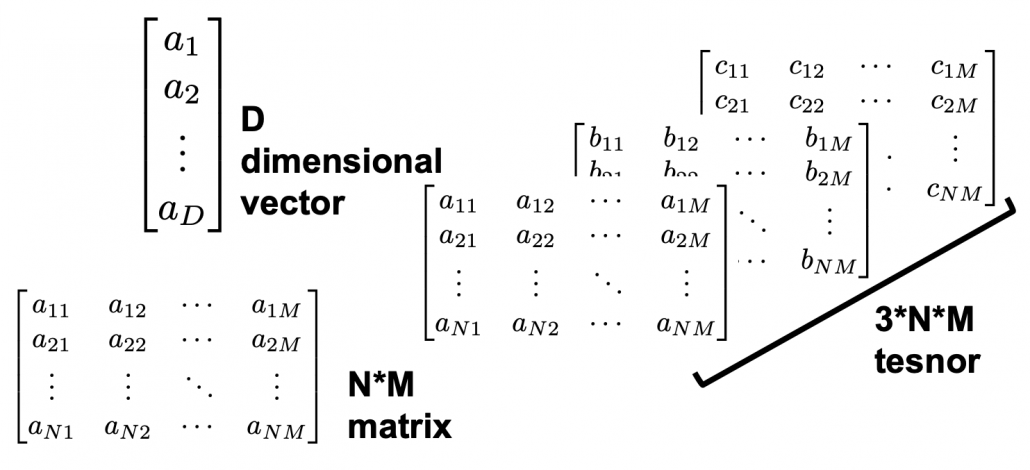
But in case of deep learning, x is a vector or a tensor, and it is denoted with \boldsymbol{x} . If you have never studied linear algebra , imagine that a vector is a column of Excel data (only one column), a matrix is a sheet of Excel data (with some rows and columns), and a tensor is some sheets of Excel data (each sheet does not necessarily contain only one column.)

CNNs are mainly used for image processing, so their inputs are usually image data. Image data are in many cases (3, hight, width) tensors because usually an image has red, blue, green channels, and the image in each channel can be expressed as a hight*width matrix (the “height” and the “width” are number of pixels, so they are discrete numbers).

The convolutional part of CNN (which I call “feature extraction part”) maps the tensors to a vector, and the last part is usually DCL, which works as classifier/regressor. At the end of the feature extraction part, you get a vector. I call it a “semantic vector” because the vector has information of “meaning” of the input image. In this link you can see maps of pictures plotted depending on the semantic vector. You can see that even if the pictures are not necessarily close pixelwise, they are close in terms of the “meanings” of the images.

In the example of a dog/cat classifier introduced by François Chollet, the developer of Keras, the CNN maps (3, 150, 150) tensors to 2-dimensional vectors, (1, 0) or (0, 1) for (dog, cat).

Wrapping up the points above, at least you should keep two points in mind: first, DCL is a classifier or a regressor, and CNN is a feature extractor used for image processing. And another important thing is, feature extraction parts of CNNs map images to vectors which are more related to the “meaning” of the image.

Importantly, I would like you to understand RNN this way. An RNN is also just a mapping.

*I recommend you to at least take a look at the beautiful pictures in this link. These pictures give you some insight into how CNN perceive images.

4, Problems of DCL and CNN, and needs for RNN

Taking an example of RNN task should be helpful for this topic. Probably machine translation is the most famous application of RNN, and it is also a good example of showing why DCL and CNN are not proper for some tasks. Its algorithms is out of the scope of this article series, but it would give you a good insight of some features of RNN. I prepared three sentences in German, English, and Japanese, which have the same meaning. Assume that each sentence is divided into some parts as shown below and that each vector corresponds to each part. In machine translation we want to convert a set of the vectors into another set of vectors.

Then let’s see why DCL and CNN are not proper for such task.

  • The input size is fixed: In case of the dog/cat classifier I have mentioned, even though the sizes of the input images varies, they were first molded into (3, 150, 150) tensors. But in machine translation, usually the length of the input is supposed to be flexible.
  • The order of inputs does not mater: In case of the dog/cat classifier the last section, even if the input is “cat,” “cat,” “dog” or “dog,” “cat,” “cat” there’s no difference. And in case of DCL, the network is symmetric, so even if you shuffle inputs, as long as you shuffle all of the input data in the same way, the DCL give out the same outcome . And if you have learned at least one foreign language, it is easy to imagine that the orders of vectors in sequence data matter in machine translation.

*It is said English language has phrase structure grammar, on the other hand Japanese language has dependency grammar. In English, the orders of words are important, but in Japanese as long as the particles and conjugations are correct, the orders of words are very flexible. In my impression, German grammar is between them. As long as you put the verb at the second position and the cases of the words are correct, the orders are also relatively flexible.

5, Sequence Data

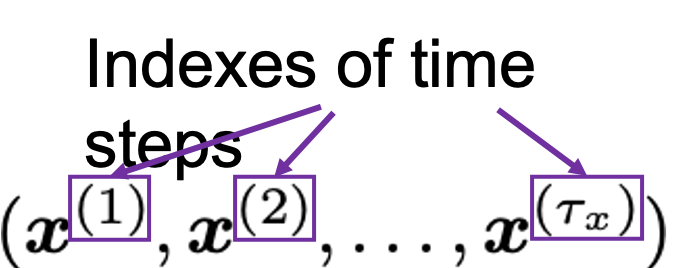
We can say DCL and CNN are not useful when you want to process sequence data. Sequence data are a type of data which are lists of vectors. And importantly, the orders of the vectors matter. The number of vectors in sequence data is usually called time steps. A simple example of sequence data is meteorological data measured at a spot every ten minutes, for instance temperature, air pressure, wind velocity, humidity. In this case the data is recorded as 4-dimensional vector every ten minutes.

But this “time step” does not necessarily mean “time.” In case of natural language processing (including machine translation), which you I mentioned in the last section, the numberings of each vector denoting each part of sentences are “time steps.”

And RNNs are mappings from a sequence data to another sequence data.

*At least I found a paper on the RNN’s capability of universal approximation on many-to-one RNN task. But I have not found any papers on universal approximation of many-to-many RNN tasks. Please let me know if you find any clue on whether such approximation is possible. I am desperate to know that. 

6, Types of RNN Tasks

RNN tasks can be classified into some types depending on the lengths of input/output sequences (the “length” means the times steps of input/output sequence data).

If you want to predict the temperature in 24 hours, based on several time series data points in the last 96 hours, the task is many-to-one. If you sample data every ten minutes, the input size is 96*6=574 (the input data is a list of 574 vectors), and the output size is 1 (which is a value of temperature). Another example of many-to-one task is sentiment classification. If you want to judge whether a post on SNS is positive or negative, the input size is very flexible (the length of the post varies.) But the output size is one, which is (1, 0) or (0, 1), which denotes (positive, negative).

*The charts in this section are simplified model of RNN used for each task. Please keep it in mind that they are not 100% correct, but I tried to make them as exact as possible compared to those in other study materials.

Music/text generation can be one-to-many tasks. If you give the first sound/word you can generate a phrase.

Next, let’s look at many-to-many tasks. Machine translation and voice recognition are likely to be major examples of many-to-many tasks, but here name entity recognition seems to be a proper choice. Name entity recognition is task of finding proper noun in a sentence . For example if you got two sentences “He said, ‘Teddy bears on sale!’ ” and ‘He said, “Teddy Roosevelt was a great president!” ‘ judging whether the “Teddy” is a proper noun or a normal noun is name entity recognition.

Machine translation and voice recognition, which are more popular, are also many-to-many tasks, but they use more sophisticated models. In case of machine translation, the inputs are sentences in the original language, and the outputs are sentences in another language. When it comes to voice recognition, the input is data of air pressure at several time steps, and the output is the recognized word or sentence. Again, these are out of the scope of this article but I would like to introduce the models briefly.

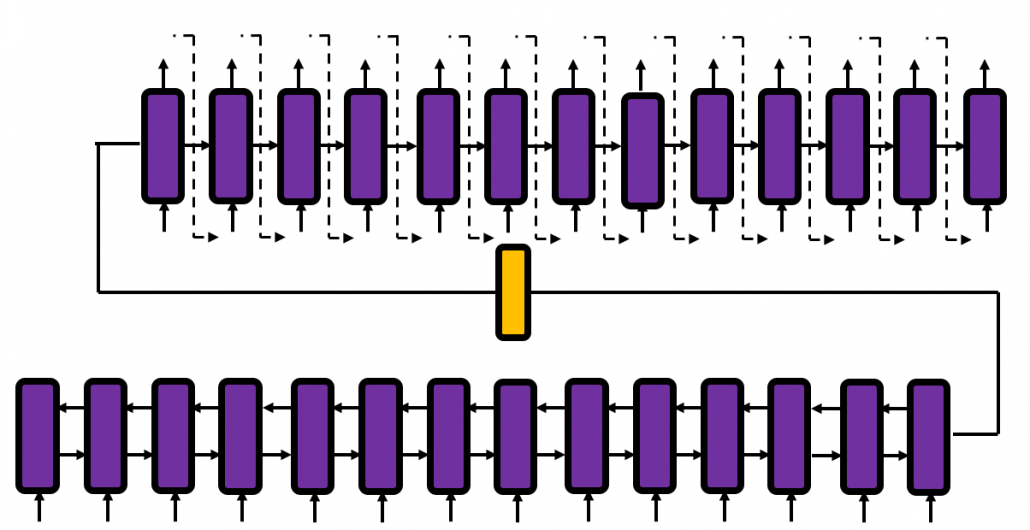
Machine translation uses a type of RNN named sequence-to-sequence model (which is often called seq2seq model). This model is also very important for other natural language processes tasks in general, such as text summarization. A seq2seq model is divided into the encoder part and the decoder part. The encoder gives out a hidden state vector and it used as the input of the decoder part. And decoder part generates texts, using the output of the last time step as the input of next time step.

Voice recognition is also a famous application of RNN, but it also needs a special type of RNN.

*To be honest, I don’t know what is the state-of-the-art voice recognition algorithm. The example in this article is a combination of RNN and a collapsing function made using Connectionist Temporal Classification (CTC). In this model, the output of RNN is much longer than the recorded words or sentences, so a collapsing function reduces the output into next output with normal length.

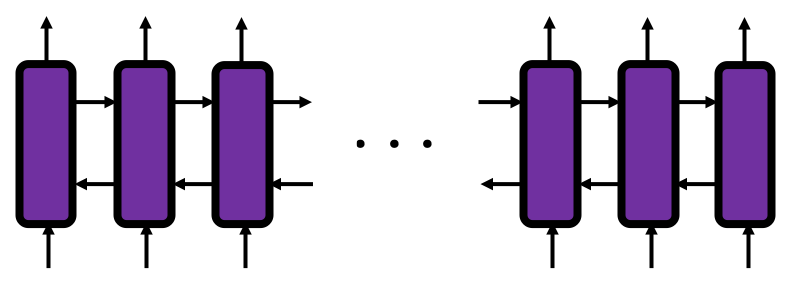
You might have noticed that RNNs in the charts above are connected in both directions. Depending on the RNN tasks you need such bidirectional RNNs.  I think it is also easy to imagine that such networks are necessary. Again, machine translation is a good example.

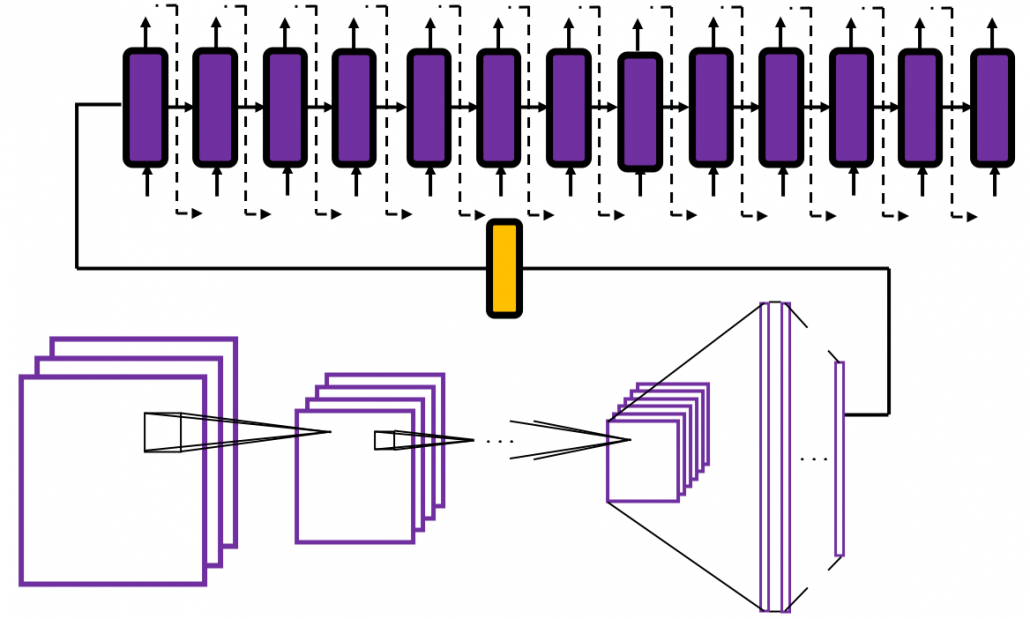
And interestingly, image captioning, which enables a computer to describe a picture, is one-to-many-task. As the output is a sentence, it is easy to imagine that the output is “many.” If it is a one-to-many task, the input is supposed to be a vector.

Where does the input come from? I told you that I was obsessed with the beauty of the last vector of the feature extraction part of CNN. Surprisingly the the “beautiful” vector, which I call a “semantic vector” is the input of image captioning task (after some transformations, depending on the network models).

I think this articles includes major things you need to know as prerequisites when you want to understand RNN at more mathematical level. In the next article, I would like to explain the structure of a simple RNN, and how it forward propagate.

* I make study materials on machine learning, sponsored by DATANOMIQ. I do my best to make my content as straightforward but as precise as possible. I include all of my reference sources. If you notice any mistakes in my materials, please let me know (email: yasuto.tamura@datanomiq.de). And if you have any advice for making my materials more understandable to learners, I would appreciate hearing it.

Integrate Unstructured Data into Your Enterprise to Drive Actionable Insights

In an ideal world, all enterprise data is structured – classified neatly into columns, rows, and tables, easily integrated and shared across the organization.

The reality is far from it! Datamation estimates that unstructured data accounts for more than 80% of enterprise data, and it is growing at a rate of 55 – 65 percent annually. This includes information stored in images, emails, spreadsheets, etc., that cannot fit into databases.

Therefore, it becomes imperative for a data-driven organization to leverage their non-traditional information assets to derive business value. We have outlined a simple 3-step process that can help organizations integrate unstructured sources into their data eco-system:

1. Determine the Challenge

The primary step is narrowing down the challenges you want to solve through the unstructured data flowing in and out of your organization. Financial organizations, for instance, use call reports, sales notes, or other text documents to get real-time insights from the data and make decisions based on the trends. Marketers make use of social media data to evaluate their customers’ needs and shape their marketing strategy.

Figuring out which process your organization is trying to optimize through unstructured data can help you reach your goal faster.

2. Map Out the Unstructured Data Sources Within the Enterprise

An actionable plan starts with identifying the range of data sources that are essential to creating a truly integrated environment. This enables organizations to align the sources with business objectives and streamline their data initiatives.

Deciding which data should be extracted, analyzed, and stored should be a primary concern in this regard. Even if you can ingest data from any source, it doesn’t mean that you should.

Collecting a large volume of unstructured data is not enough to generate insights. It needs to be properly organized and validated for quality before integration. Full, incremental, online, and offline extraction methods are generally used to mine valuable information from unstructured data sources.

3. Transform Unstructured Assets into Decision-Ready Insights

Now that you have all the puzzle pieces, the next step is to create a complete picture. This may require making changes in your organization’s infrastructure to derive meaning from your unstructured assets and get a 360-degree business view.

IDC recommends creating a company culture that promotes the collection, use, and sharing of both unstructured and structured business assets. Therefore, finding an enterprise-grade integration solution that offers enhanced connectivity to a range of data sources, ideally structured, unstructured, and semi-structured, can help organizations generate the most value out of their data assets.

Automation is another feature that can help speed up integration processes, minimize error probability, and generate time-and-cost savings. Features like job scheduling, auto-mapping, and workflow automation can optimize the process of extracting information from XML, JSON, Excel or audio files, and storing it into a relational database or generating insights.

The push to become a data-forward organization has enterprises re-evaluating the way to leverage unstructured data assets for decision-making. With an actionable plan in place to integrate these sources with the rest of the data, organizations can take advantage of the opportunities offered by analytics and stand out from the competition.

Introduction to Recommendation Engines

This is the second article of article series Getting started with the top eCommerce use cases. If you are interested in reading the first article you can find it here.

What are Recommendation Engines?

Recommendation engines are the automated systems which helps select out similar things whenever a user selects something online. Be it Netflix, Amazon, Spotify, Facebook or YouTube etc. All of these companies are now using some sort of recommendation engine to improve their user experience. A recommendation engine not only helps to predict if a user prefers an item or not but also helps to increase sales, ,helps to understand customer behavior, increase number of registered users and helps a user to do better time management. For instance Netflix will suggest what movie you would want to watch or Amazon will suggest what kind of other products you might want to buy. All the mentioned platforms operates using the same basic algorithm in the background and in this article we are going to discuss the idea behind it.

What are the techniques?

There are two fundamental algorithms that comes into play when there’s a need to generate recommendations. In next section these techniques are discussed in detail.

Content-Based Filtering

The idea behind content based filtering is to analyse a set of features which will provide a similarity between items themselves i.e. between two movies, two products or two songs etc. These set of features once compared gives a similarity score at the end which can be used as a reference for the recommendations.

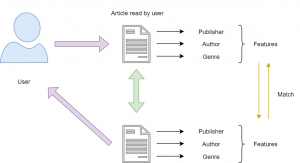
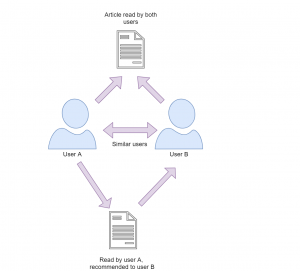
There are several steps involved to get to this similarity score and the first step is to construct a profile for each item by representing some of the important features of that item. In other terms, this steps requires to define a set of characteristics that are discovered easily. For instance, consider that there’s an article which a user has already read and once you know that this user likes this article you may want to show him recommendations of similar articles. Now, using content based filtering technique you could find the similar articles. The easiest way to do that is to set some features for this article like publisher, genre, author etc. Based on these features similar articles can be recommended to the user (as illustrated in Figure 1). There are three main similarity measures one could use to find the similar articles mentioned below.


Figure 1: Content-Based Filtering


Minkowski distance

Minkowski distance between two variables can be calculated as:

(x,y)= (\sum_{i=1}^{n}{|X_{i} - Y_{i}|^{p}})^{1/p}


Cosine Similarity

Cosine similarity between two variables can be calculated as :

  \mbox{Cosine Similarity} = \frac{\sum_{i=1}^{n}{x_{i} y_{i}}} {\sqrt{\sum_{i=1}^{n}{x_{i}^{2}}} \sqrt{\sum_{i=1}^{n}{y_{i}^{2}}}} \


Jaccard Similarity


  J(X,Y) = |X ∩ Y| / |X ∪ Y|


These measures can be used to create a matrix which will give you the similarity between each movie and then a function can be defined to return the top 10 similar articles.


Collaborative filtering

This filtering method focuses on finding how similar two users or two products are by analyzing user behavior or preferences rather than focusing on the content of the items. For instance consider that there are three users A,B and C.  We want to recommend some movies to user A, our first approach would be to find similar users and compare which movies user A has not yet watched and recommend those movies to user A.  This approach where we try to find similar users is called as User-User Collaborative Filtering.  

The other approach that could be used here is when you try to find similar movies based on the ratings given by others, this type is called as Item-Item Collaborative Filtering. The research shows that item-item collaborative filtering works better than user-user collaborative filtering as user behavior is really dynamic and changes over time. Also, there are a lot more users and increasing everyday but on the other side item characteristics remains the same. To calculate the similarities we can use Cosine distance.


Figure 2: Collaborative Filtering


Recently some companies have started to take advantage of both content based and collaborative filtering techniques to make a hybrid recommendation engine. The results from both models are combined into one hybrid model which provides more accurate recommendations. Five steps are involved to make a recommendation engine work which are collection of data, storing of data, analyzing the data, filtering the data and providing recommendations. There are a lot of attributes that are involved in order to collect user data including browsing history, page views, search logs, order history, marketing channel touch points etc. which requires a strong data architecture.  The collection of data is pretty straightforward but it can be overwhelming to analyze this amount of data. Storing this data could get tricky on the other hand as you need a scalable database for this kind of data. With the rise of graph databases this area is also improving for many use cases including recommendation engines. Graph databases like Neo4j can also help to analyze and find similar users and relationship among them. Analyzing the data can be carried in different ways, depending on how strong and scalable your architecture you can run real time, batch or near real time analysis. The fourth step involves the filtering of the data and here you can use any of the above mentioned approach to find similarities to finally provide the recommendations.

Having a good recommendation engine can be time consuming initially but it is definitely beneficial in the longer run. It not only helps to generate revenue but also helps to to improve your product catalog and customer service.

Glorious career paths of a Big Data Professional

Are you wondering about the career profiles you may get to fill if you get into Big Data industry? If yes, then Bingo! This is the post that will inform you just about that. Big data is just an umbrella term. There are a lot of profiles and career paths that are covered under this umbrella term. Let us have a look at some of these profiles.

Data Visualisation Specialist

The process of visualizing data is turning out to be critical in guaranteeing information-driven representatives get the upfront investment required to actualize goal-oriented and significant Big Data extends in their organization. Making your data to tell a story and the craft of envisioning information convincingly has turned into a significant piece of the Big Data world and progressively associations need to have these capacities in-house. Besides, as a rule, these experts are relied upon to realize how to picture in different instruments, for example, Spotfire, D3, Carto, and Tableau – among numerous others. Information Visualization Specialists should be versatile and inquisitive to guarantee they stay aware of most recent patterns and answers for a recount to their information stories in the most intriguing manner conceivable with regards to the board room. 


Big Data Architect

This is the place the Hadoop specialists come in. Ordinarily, a Big Data planner tends to explicit information issues and necessities, having the option to portray the structure and conduct of a Big Data arrangement utilizing the innovation wherein they practice – which is, as a rule, mostly Hadoop.

These representatives go about as a significant connection between the association (and its specific needs) and Data Scientists and Engineers. Any organization that needs to assemble a Big Data condition will require a Big Data modeler who can serenely deal with the total lifecycle of a Hadoop arrangement – including necessity investigation, stage determination, specialized engineering structure, application plan, and advancement, testing the much-dreaded task of deploying lastly.

Systems Architect 

This Big data professional is in charge of how your enormous information frameworks are architected and interconnected. Their essential incentive to your group lies in their capacity to use their product building foundation and involvement with huge scale circulated handling frameworks to deal with your innovation decisions and execution forms. You’ll need this individual to construct an information design that lines up with the business, alongside abnormal state anticipating the improvement. The person in question will consider different limitations, adherence to gauges, and varying needs over the business.

Here are some responsibilities that they play:

    • Determine auxiliary prerequisites of databases by investigating customer tasks, applications, and programming; audit targets with customers and assess current frameworks.
    • Develop database arrangements by planning proposed framework; characterize physical database structure and utilitarian abilities, security, back-up and recuperation particulars.
    • Install database frameworks by creating flowcharts; apply ideal access methods, arrange establishment activities, and record activities.
    • Maintain database execution by distinguishing and settling generation and application advancement issues, figuring ideal qualities for parameters; assessing, incorporating, and putting in new discharges, finishing support and responding to client questions.
    • Provide database support by coding utilities, reacting to client questions, and settling issues.


Artificial Intelligence Developer

The certain promotion around Artificial Intelligence is additionally set to quicken the number of jobs publicized for masters who truly see how to apply AI, Machine Learning, and Deep Learning strategies in the business world. Selection representatives will request designers with broad learning of a wide exhibit of programming dialects which loan well to AI improvement, for example, Lisp, Prolog, C/C++, Java, and Python.

All said and done; many people estimate that this popular demand for AI specialists could cause a something like what we call a “Brain Drain” organizations poaching talented individuals away from the universe of the scholarly world. A month ago in the Financial Times, profound learning pioneer and specialist Yoshua Bengio, of the University of Montreal expressed: “The industry has been selecting a ton of ability — so now there’s a lack in the scholarly world, which is fine for those organizations. However, it’s not extraordinary for the scholarly world.” It ; howeverusiasm to perceive how this contention among the scholarly world and business is rotated in the following couple of years.

Data Scientist

The move of Big Data from tech publicity to business reality may have quickened, yet the move away from enrolling top Data Scientists isn’t set to change in 2020. An ongoing Deloitte report featured that the universe of business will require three million Data Scientists by 2021, so if their expectations are right, there’s a major ability hole in the market. This multidisciplinary profile requires specialized logical aptitudes, specialized software engineering abilities just as solid gentler abilities, for example, correspondence, business keenness, and scholarly interest.

Data Engineer

Clean and quality data is crucial in the accomplishment of Big Data ventures. Consequently, we hope to see a lot of opening in 2020 for Data Engineers who have a predictable and awesome way to deal with information transformation and treatment. Organizations will search for these special data masters to have broad involvement in controlling data with SQL, T-SQL, R, Hadoop, Hive, Python and Spark. Much like Data Scientists. They are likewise expected to be innovative with regards to contrasting information with clashing information types with have the option to determine issues. They additionally frequently need to make arrangements which enable organizations to catch existing information in increasingly usable information groups – just as performing information demonstrations and their modeling.

IT/Operations Manager Job Description

In Big data industry, the IT/Operations Manager is a profitable expansion to your group and will essentially be in charge of sending, overseeing, and checking your enormous information frameworks. You’ll depend on this colleague to plan and execute new hardware and administrations. The person in question will work with business partners to comprehend the best innovation ventures to address their procedures and concerns—interpreting business necessities to innovation plans. They’ll likewise work with venture chiefs to actualize innovation and be in charge of effective progress and general activities.

Here are some responsibilities that they play:

  • Manage and be proactive in announcing, settling and raising issues where required 
  • Lead and co-ordinate issue the executive’s exercises, notwithstanding ceaseless procedure improvement activities  
  • Proactively deal with our IT framework 
  • Supervise and oversee IT staffing, including enrollment, supervision, planning, advancement, and assessment
  • Verify existing business apparatuses and procedures remain ideally practical and worth included 
  • Benchmark, dissect, report on and make suggestions for the improvement and development of the IT framework and IT frameworks 
  • Advance and keep up a corporate SLA structure

Conclusion

These are some of the best career paths that big data professionals can play after entering the industry. Honesty and hard work can always take you to the zenith of any field that you choose to be in. Also, keep upgrading your skills by taking newer certifications and technologies. Good Luck 

6 Important Reasons for the Java Experts to learn Hadoop Skills

You must be well aware of the fact that Java and Hadoop Skills are in high demand these days. Gone are the days when advancement work moved around Java and social database. Today organizations are managing big information. It is genuinely big. From gigabytes to petabytes in size and social databases are exceptionally restricted to store it. Additionally, organizations are progressively outsourcing the Java development jobs to different groups who are as of now having big data experts.

Ever wondered what your future would have in store for you if you possess Hadoop as well as Java skills? No? Let us take a look. Today we shall discuss the point that why is it preferable for Java Developers to learn Hadoop.

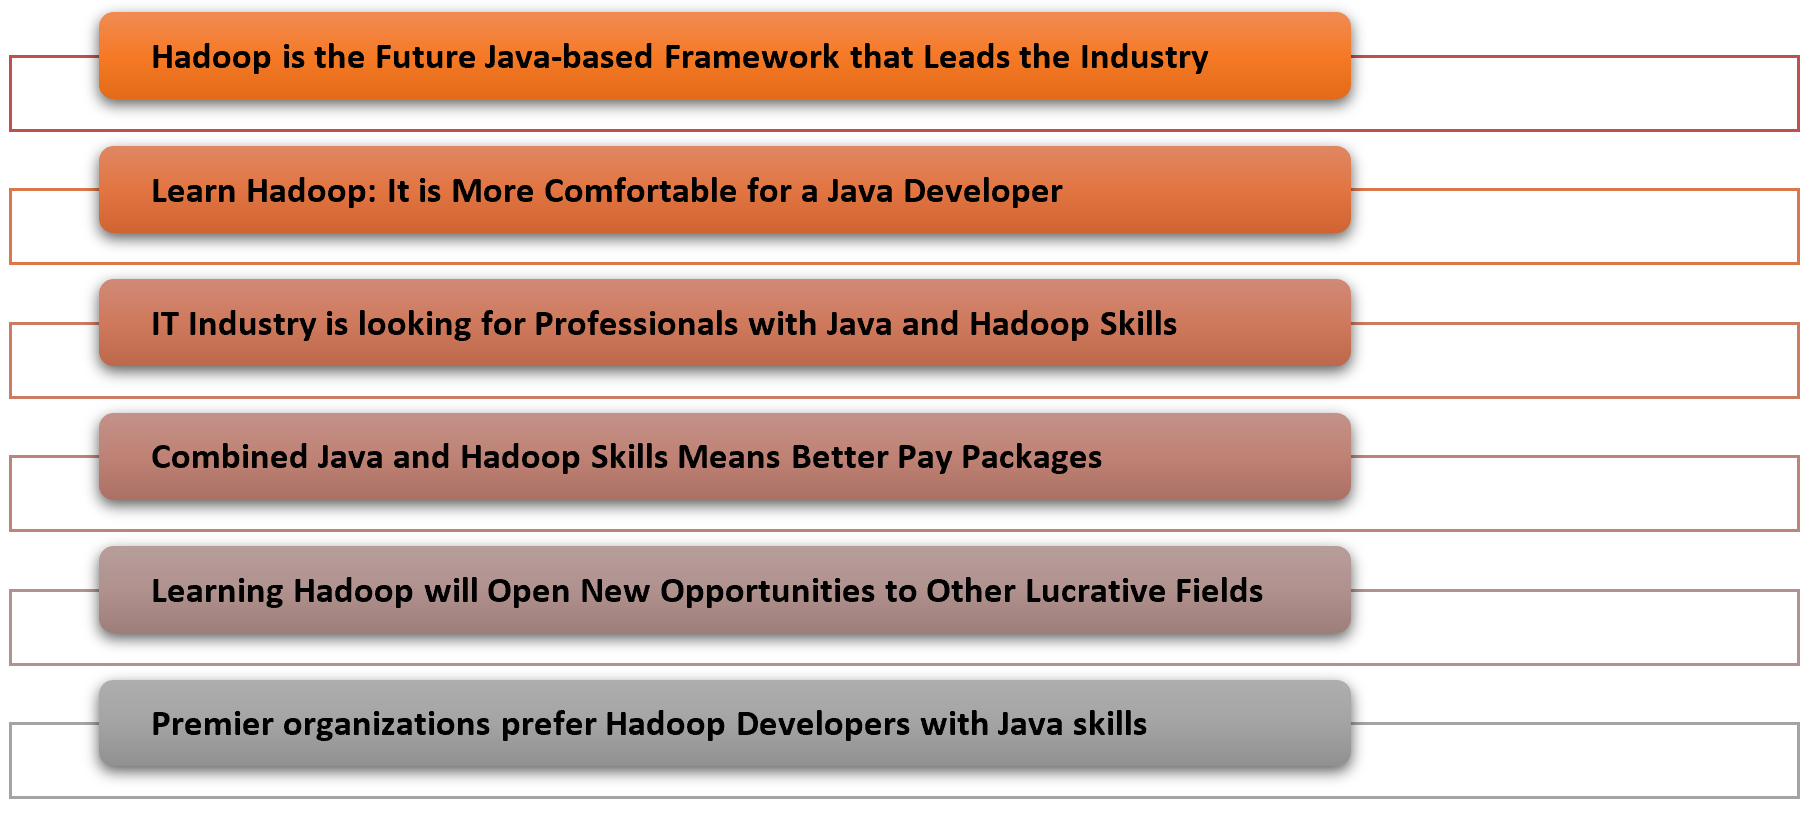
Hadoop is the Future Java-based Framework that Leads the Industry

Data analysis is the current marketing strategy that the companies are adopting these days. What’s more, Hadoop is to process and comprehend all the Big Data that is generated all the time. As a rule, Hadoop is broadly utilized by practically all organizations from big and small and in practically all business spaces. It is an open-source stage where Java owes a noteworthy segment of its success

The processing channel of Hadoop, which is MapReduce, is written in Java. Thus, a Hadoop engineer needs to compose MapReduce contents in Java for Big data analysis. Notwithstanding that, HDFS, which is the record arrangement of Hadoop, is additionally Java-based programming language at its core. Along these lines, a Hadoop developer needs to compose documents from local framework to HDFS through deployment, which likewise includes Java programming.

Learn Hadoop: It is More Comfortable for a Java Developer

Hadoop is more of an environment than a standalone innovation. Also, Hadoop is a Java-based innovation. Regardless of whether it is Hadoop 1 which was about HDFS and MapReduce or Hadoop2 biological system that spreads HDFS, Spark, Yarn, MapReduce, Tez, Flink, Giraph, Storm, JVM is the base for all. Indeed, even a portion of the broadly utilized programming languages utilized in a portion of the Hadoop biological system segments like Spark is JVM based. The run of the mill models is Scala and Clojure.

Consequently, if you have a Java foundation, understanding Hadoop is progressively easier for you. Also, here, a Hadoop engineer needs Java programming information to work in MapReduce or Spark structure. Thus, if you are as of now a Java designer with a logical twist of the brain, you are one stage ahead to turn into a Hadoop developer.

IT Industry is looking for Professionals with Java and Hadoop Skills

If you pursue the expected set of responsibilities and range of abilities required for a Hadoop designer in places of work, wherever you will watch the reference of Java. As Hadoop needs solid Java foundation, from this time forward associations are searching for Java designers as the best substitution for Hadoop engineers. It is savvy asset usage for organizations as they don’t have to prepare Java for new recruits to learn Hadoop for tasks.

Nonetheless, the accessible market asset for Hadoop is less. Therefore, there is a noteworthy possibility for Java designers in the Hadoop occupation field. Henceforth, as a Java designer, on the off chance that you are not yet arrived up in your fantasy organization, learning Hadoop, will without a doubt help you to discover the chance to one of your top picks.

Combined Java and Hadoop Skills Means Better Pay Packages

You will be progressively keen on learning Hadoop on the off chance that you investigate Gartner report on big information industry. According to the report, the Big Data industry has just come to the $50 billion points. Additionally, over 64% of the main 720 organizations worldwide are prepared to put resources into big information innovation. Notwithstanding that when you are a mix of a Java and Hadoop engineer, you can appreciate 250% pay climb with a normal yearly compensation of $150,000.It is about the yearly pay of a senior Hadoop developer.

Besides, when you change to Big Data Hadoop, it very well may be useful to improve the nature of work. You will manage unpredictable and greater tasks. It does not just give you a better extension to demonstrate your expertise yet, in addition, to set up yourself as a profitable asset who can have any kind of effect.

Adapting Big Data Hadoop can be exceptionally advantageous because it will assist you in dealing with greater, complex activities a lot simpler and convey preferable yield over your associates. To be considered for examinations, you should be somebody who can have any kind of effect in the group, and that is the thing that Hadoop lets you be.

Learning Hadoop will open New Opportunities to Other Lucrative Fields

Big data is only not going to learn Hadoop. When you are in Big information space, you have sufficient chance to jump other Java and Hadoop engineer. There are different exceedingly requesting zones in big information like Artificial Intelligence, Machine Learning, Data Science. You can utilize your Java and Hadoop engineer expertise as a springboard to take your vocation to the following level. In any case, the move will give you the best outcome once you move from Java to Hadoop and increase fundamental working knowledge.

Java with Hadoop opens new skylines of occupation jobs, for example, data scientist, data analyst business intelligence analyst, DBA, etc.

Premier organizations prefer Hadoop Developers with Java skills

Throughout the years the Internet has been the greatest driver of information, and the new data produced in 2012 remained at 2500 Exabyte. The computerized world developed by 62% a year ago to 800K petabytes and will keep on developing to the tune of 1.2 zeta bytes during the present year. Gartner gauges the market of Hadoop Ecosystem to $77 million and predicts it will come to the $813 million marks by 2016.

A review of LinkedIn profiles referencing Hadoop as their abilities uncovered that just about 17000 individuals are working in Companies like Cisco, HP, TCS, Oracle, Amazon, Yahoo, and Facebook, and so on. Aside from this Java proficient who learn Hadoop can begin their vocations with numerous new businesses like Platfora, Alpine information labs, Trifacta, Datatorrent, and so forth.

Conclusion

You can see that combining your Java skills with Hadoop skills can open the doors of several new opportunities for you. You can get better remuneration for your efforts, and you will always be in high demand. It is high time to learn Hadoop online now if you are a java developer.

The Future of AI in Dental Technology

As we develop more advanced technology, we begin to learn that artificial intelligence can have more and more of an impact on our lives and industries that we have gotten used to being the same over the past decades. One of those industries is dentistry. In your lifetime, you’ve probably not seen many changes in technology, but a boom around artificial intelligence and technology has opened the door for AI in dental technologies.

How Can AI Help?

Though dentists take a lot of pride in their craft and career, most acknowledge that AI can do some things that they can’t do or would make their job easier if they didn’t have to do. AI can perform a number of both simple and advanced tasks. Let’s take a look at some areas that many in the dental industry feel that AI can be of assistance.

Repetitive, Menial Tasks

The most obvious area that AI can help out when it comes to dentistry is with repetitive and menial simple tasks. There are many administrative tasks in the dentistry industry that can be sped up and made more cost-effective with the use of AI. If we can train a computer to do some of these tasks, we may be able to free up more time for our dentists to focus on more important matters and improve their job performance as well. One primary use of AI is virtual consultations that offices like Philly Braces are offering. This saves patients time when they come in as the Doctor already knows what the next steps in their treatment will be.

Using AI to do some basic computer tasks is already being done on a small scale by some, but we have yet to see a very large scale implementation of this technology. We would expect that to happen soon, with how promising and cost-effective the technology has proven to be.

Reducing Misdiagnosis

One area that many think that AI can help a lot in is misdiagnosis. Though dentists do their best, there is still a nearly 20% misdiagnosis rate when reading x-rays in dentistry. We like to think that a human can read an x-ray better, but this may not be the case. AI technology can certainly be trained to read an x-ray and there have been some trials to suggest that they can do it better and identify key conditions that we often misread.

A world with AI diagnosis that is accurate and quicker will save time, money, and lead to better dental health among patients. It hasn’t yet come to fruition, but this seems to be the next major step for AI in dentistry.

Artificial Intelligence Assistants

Once it has been demonstrated that AI can perform a range of tasks that are useful to dentists, the next logical step is to combine those skills to make a fully-functional AI dental assistant. A machine like this has not yet been developed, but we can imagine that it would be an interface that could be spoken to similar to Alexa. The dentist would request vital information and other health history data from a patient or set of patients to assist in the treatment process. This would undoubtedly be a huge step forward and bring a lot of computing power into the average dentist office.

Conclusion

It’s clear that AI has a bright future in the dental industry and has already shown some of the essential skills that it can help with in order to provide more comprehensive and accurate care to dental patients. Some offices like Westwood Orthodontics already use AI in the form of a virtual consult to diagnose issues and provide treatment options before patients actually step foot in the office. Though not nearly all applications that AI can provide have been explored, we are well on our way to discovering the vast benefits of artificial intelligence for both patients and practices in the dental healthcare industry.


Lisa Gao, DDS, MS | Westwood Orthodontics 1033 Gayley Ave #106, Los Angeles California 90024, 310-870-1823

The New Age of Big Data: Is It the Death of Hadoop?

Big Data had gone through several transformations through the years, growing into the phrase we identify it as today. From its first identified use on the back of Hadoop and MapReduce, a new age of Big Data has been ushered in with the spread of new technologies such as Kubernetes, Spark, and NoSQL databases.

These might not serve the exact same purpose as Hadoop individually, but they fill the same niche and do the same job with features the original platform designers never envisioned.

The multi-cloud architecture boom and increasing emphasis on real-time data may just mean the end of Big Data as we know it, and Hadoop with it.

A brief history of Big Data

The use of data for making business decisions can be traced back to ancient civilizations in Mesopotamia. However, the age of Big Data as we know it is only as old as 2005 when O’Reilly Media launched the phrase. It was used to describe the massive amounts of data that the world was beginning to produce on the internet.

The newly-dubbed Web 2.0 needed to be indexed and easily searchable, and, Yahoo, being the behemoth that it was, was just the right company for the job. Hadoop was born off the efforts of Yahoo engineers, depending on Google’s MapReduce under the hood. A new era of Big Data had begun, and Hadoop was at the forefront of the revolution.

The new technologies led to a fundamental shift in the way the world regarded data processing. Traditional assumptions of atomicity, consistency, isolation, and durability (ACID) began to fade, and new use cases for previously unusable data began to emerge.

Hadoop would begin its life as a commercial platform with the launch of Cloudera in 2008, followed by rivals such as Hortonworks, EMC and MapR. It continued its momentous run until it seemingly hit its peak in 2015, and its place in the enterprise market would never be guaranteed again

Where Hadoop Couldn’t Keep Up

Hadoop made its mark in the world of Big Data by being a platform to collect, store and analyze large swathes of data. However, not even a technology as revolutionary and versatile as Hadoop could exist without its drawbacks.

Some of these would be so costly developers would rather design whole new systems to deal with them. With time, Hadoop started to lose its charm, unable to grow past its initial vision as a Big Data software.

Hadoop is a machine made up of smaller moving parts that are incredibly efficient at what they do – crunch data. This ultimately results in one of the first drawbacks of Hadoop – it does not come with built-in support for analytics data. Hadoop works well to process your data, but not likely as you need – visual reports about how the data is being processed, for instance.

MapReduce was also built from the ground up to be file-intensive. This makes it a great piece of software for simple requests, but not so much for iterative data. For smaller datasets, it turns out to be a rather inefficient solution.

Another area Hadoop lands flat on its face is with regards to real-time processing and reporting. Hadoop suffers from the curse of time. It relies on technologies that even its very founders (Google in particular) no longer rely on.

With MapReduce, every time you want to analyze a modified dataset (say, after adding or deleting data), you have to stream over the whole dataset again. Thanks to this feature, Hadoop is horrible at real-time reporting – a feature that led to the creation of Percolator, MapReduce’s replacement within Google.

The emergence of better technology has also meant a rise in the number of threats to said technology and a corresponding increase in the emphasis that is placed on it.

Unfortunately, Hadoop is nowhere close to being secure. As a matter of fact, its security settings are off by default, and it has too much inertia to simply change that. To make things worse, plugging in security measures isn’t that much easier.

The Fall of Hadoop

With these and more shortcomings in the data science world, new tools such as Hive, Pig and Spark were created to work on top of Hadoop to overcome its weaknesses. But it simply couldn’t grow out of the shoes it had been made for.

The growth of NoSQL databases such as Hazelcast and MongoDB also meant that problems Hadoop was designed to support were now being solved by single players rather than the ‘all or nothing’ approach Hadoop was designed with. It wasn’t flexible enough to evolve beyond simply being a batch processing software.

Over time, new Big Data challenges began to emerge that a large monolithic software like Hadoop couldn’t deal with, either. Being primarily file-intensive, it couldn’t keep up with the variety of data sources that were now available, the lack of support for dynamic schemas, on-the-fly queries, and the rise of cloud infrastructure all caused people to seek different solutions. Hadoop had lost its grip on the enterprise world.

Businesses whose primary concern was dealing with Hadoop infrastructure like Cloudera and Hortonworks were seeing less and less adoption. This led to the eventual merger of the two companies in 2019, and the same message rang out from different corners of the world at the same time: ‘Hadoop is dead.’

Is Hadoop Really Dead?

Hadoop still has a place in the enterprise world – the problems it was designed to solve still exist to this day. Technologies such as Spark have largely taken over the same space that Hadoop once occupied.

The question of Hadoop or Spark is one every data scientist has to contend with at some point, and most seem to be settling in the latter of these, thanks to the great advantages is speed it offers.

It’s unlikely Hadoop will see much more adoption with newer marker entrants, especially considering the pace with which technology moves. It also doesn’t help that a lot of alternatives have a much smaller learning curve than the convoluted monolith that is Hadoop. Companies like MapR and Cloudera have also begun to pivot away from Hadoop-only infrastructure to more robust cloud-based solutions. Hadoop still has its place, but maybe not for long.

A Bird’s Eye View: How Machine Learning Can Help You Charge Your E-Scooters

Bird scooters in Columbus, Ohio

Bird scooters in Columbus, Ohio

Ever since I started using bike-sharing to get around in Seattle, I have become fascinated with geolocation data and the transportation sharing economy. When I saw this project leveraging the mobility data RESTful API from the Los Angeles Department of Transportation, I was eager to dive in and get my hands dirty building a data product utilizing a company’s mobility data API.

Unfortunately, the major bike and scooter providers (Bird, JUMP, Lime) don’t have publicly accessible APIs. However, some folks have seemingly been able to reverse-engineer the Bird API used to populate the maps in their Android and iOS applications.

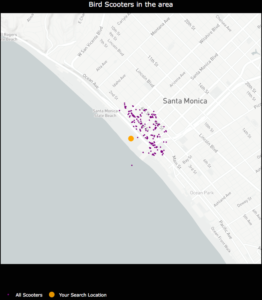
One interesting feature of this data is the nest_id, which indicates if the Bird scooter is in a “nest” — a centralized drop-off spot for charged Birds to be released back into circulation.

I set out to ask the following questions:

  1. Can real-time predictions be made to determine if a scooter is currently in a nest?
  2. For non-nest scooters, can new nest location recommendations be generated from geospatial clustering?

To answer these questions, I built a full-stack machine learning web application, NestGenerator, which provides an automated recommendation engine for new nest locations. This application can help power Bird’s internal nest location generation that runs within their Android and iOS applications. NestGenerator also provides real-time strategic insight for Bird chargers who are enticed to optimize their scooter collection and drop-off route based on proximity to scooters and nest locations in their area.

Bird

The electric scooter market has seen substantial growth with Bird’s recent billion dollar valuation  and their $300 million Series C round in the summer of 2018. Bird offers electric scooters that top out at 15 mph, cost $1 to unlock and 15 cents per minute of use. Bird scooters are in over 100 cities globally and they announced in late 2018 that they eclipsed 10 million scooter rides since their launch in 2017.

Bird scooters in Tel Aviv, Israel

Bird scooters in Tel Aviv, Israel

With all of these scooters populating cities, there’s much-needed demand for people to charge them. Since they are electric, someone needs to charge them! A charger can earn additional income for charging the scooters at their home and releasing them back into circulation at nest locations. The base price for charging each Bird is $5.00. It goes up from there when the Birds are harder to capture.

Data Collection and Machine Learning Pipeline

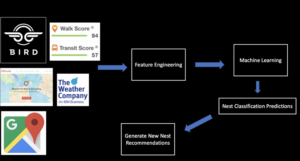
The full data pipeline for building “NestGenerator”

Data

From the details here, I was able to write a Python script that returned a list of Bird scooters within a specified area, their geolocation, unique ID, battery level and a nest ID.

I collected scooter data from four cities (Atlanta, Austin, Santa Monica, and Washington D.C.) across varying times of day over the course of four weeks. Collecting data from different cities was critical to the goal of training a machine learning model that would generalize well across cities.

Once equipped with the scooter’s latitude and longitude coordinates, I was able to leverage additional APIs and municipal data sources to get granular geolocation data to create an original scooter attribute and city feature dataset.

Data Sources:

  • Walk Score API: returns a walk score, transit score and bike score for any location.
  • Google Elevation API: returns elevation data for all locations on the surface of the earth.
  • Google Places API: returns information about places. Places are defined within this API as establishments, geographic locations, or prominent points of interest.
  • Google Reverse Geocoding API: reverse geocoding is the process of converting geographic coordinates into a human-readable address.
  • Weather Company Data: returns the current weather conditions for a geolocation.
  • LocationIQ: Nearby Points of Interest (PoI) API returns specified PoIs or places around a given coordinate.
  • OSMnx: Python package that lets you download spatial geometries and model, project, visualize, and analyze street networks from OpenStreetMap’s APIs.

Feature Engineering

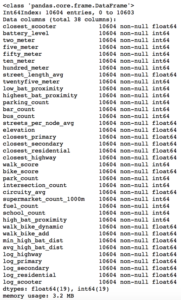
After extensive API wrangling, which included a four-week prolonged data collection phase, I was finally able to put together a diverse feature set to train machine learning models. I engineered 38 features to classify if a scooter is currently in a nest.

Full Feature Set

Full Feature Set

The features boiled down into four categories:

  • Amenity-based: parks within a given radius, gas stations within a given radius, walk score, bike score
  • City Network Structure: intersection count, average circuity, street length average, average streets per node, elevation level
  • Distance-based: proximity to closest highway, primary road, secondary road, residential road
  • Scooter-specific attributes: battery level, proximity to closest scooter, high battery level (> 90%) scooters within a given radius, total scooters within a given radius


Log-Scale Transformation

For each feature, I plotted the distribution to explore the data for feature engineering opportunities. For features with a right-skewed distribution, where the mean is typically greater than the median, I applied these log transformations to normalize the distribution and reduce the variability of outlier observations. This approach was used to generate a log feature for proximity to closest scooter, closest highway, primary road, secondary road, and residential road.

An example of a log transformation

Statistical Analysis: A Systematic Approach

Next, I wanted to ensure that the features I included in my model displayed significant differences when broken up by nest classification. My thinking was that any features that did not significantly differ when stratified by nest classification would not have a meaningful predictive impact on whether a scooter was in a nest or not.

Distributions of a feature stratified by their nest classification can be tested for statistically significant differences. I used an unpaired samples t-test with a 0.01% significance level to compute a p-value and confidence interval to determine if there was a statistically significant difference in means for a feature stratified by nest classification. I rejected the null hypothesis if a p-value was smaller than the 0.01% threshold and if the 99.9% confidence interval did not straddle zero. By rejecting the null-hypothesis in favor of the alternative hypothesis, it’s deemed there is a significant difference in means of a feature by nest classification.

Battery Level Distribution Stratified by Nest Classification to run a t-test

Battery Level Distribution Stratified by Nest Classification to run a t-test

Log of Closest Scooter Distribution Stratified by Nest Classification to run a t-test

Throwing Away Features

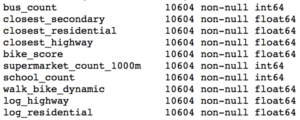
Using the approach above, I removed ten features that did not display statistically significant results.

Statistically Insignificant Features Removed Before Model Development

Model Development

I trained two models, a random forest classifier and an extreme gradient boosting classifier since tree-based models can handle skewed data, capture important feature interactions, and provide a feature importance calculation. I trained the models on 70% of the data collected for all four cities and reserved the remaining 30% for testing.

After hyper-parameter tuning the models for performance on cross-validation data it was time to run the models on the 30% of test data set aside from the initial data collection.

I also collected additional test data from other cities (Columbus, Fort Lauderdale, San Diego) not involved in training the models. I took this step to ensure the selection of a machine learning model that would generalize well across cities. The performance of each model on the additional test data determined which model would be integrated into the application development.

Performance on Additional Cities Test Data

The Random Forest Classifier displayed superior performance across the board

The Random Forest Classifier displayed superior performance across the board

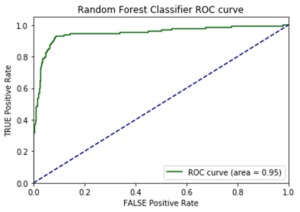
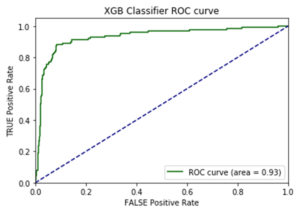
I opted to move forward with the random forest model because of its superior performance on AUC score and accuracy metrics on the additional cities test data. AUC is the Area under the ROC Curve, and it provides an aggregate measure of model performance across all possible classification thresholds.

AUC Score on Test Data for each Model

AUC Score on Test Data for each Model

Feature Importance

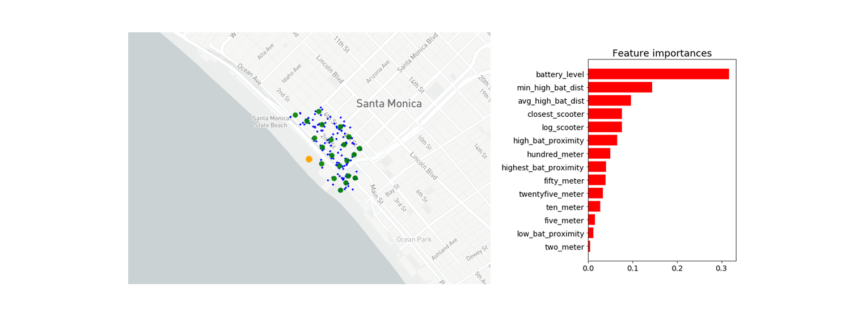
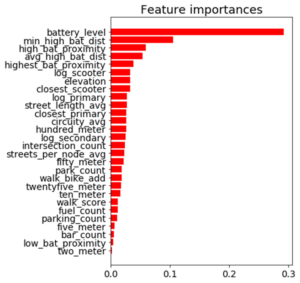
Battery level dominated as the most important feature. Additional important model features were proximity to high level battery scooters, proximity to closest scooter, and average distance to high level battery scooters.

Feature Importance for the Random Forest Classifier

Feature Importance for the Random Forest Classifier

The Trade-off Space

Once I had a working machine learning model for nest classification, I started to build out the application using the Flask web framework written in Python. After spending a few days of writing code for the application and incorporating the trained random forest model, I had enough to test out the basic functionality. I could finally run the application locally to call the Bird API and classify scooter’s into nests in real-time! There was one huge problem, though. It took more than seven minutes to generate the predictions and populate in the application. That just wasn’t going to cut it.

The question remained: will this model deliver in a production grade environment with the goal of making real-time classifications? This is a key trade-off in production grade machine learning applications where on one end of the spectrum we’re optimizing for model performance and on the other end we’re optimizing for low latency application performance.

As I continued to test out the application’s performance, I still faced the challenge of relying on so many APIs for real-time feature generation. Due to rate-limiting constraints and daily request limits across so many external APIs, the current machine learning classifier was not feasible to incorporate into the final application.

Run-Time Compliant Application Model

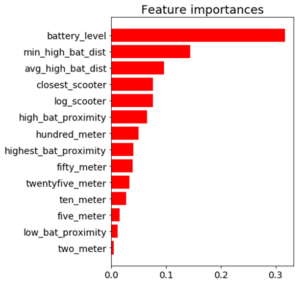
After going back to the drawing board, I trained a random forest model that relied primarily on scooter-specific features which were generated directly from the Bird API.

Through a process called vectorization, I was able to transform the geolocation distance calculations utilizing NumPy arrays which enabled batch operations on the data without writing any “for” loops. The distance calculations were applied simultaneously on the entire array of geolocations instead of looping through each individual element. The vectorization implementation optimized real-time feature engineering for distance related calculations which improved the application response time by a factor of ten.

Feature Importance for the Run-time Compliant Random Forest Classifier

Feature Importance for the Run-time Compliant Random Forest Classifier

This random forest model generalized well on test-data with an AUC score of 0.95 and an accuracy rate of 91%. The model retained its prediction accuracy compared to the former feature-rich model, but it gained 60x in application performance. This was a necessary trade-off for building a functional application with real-time prediction capabilities.

Geospatial Clustering

Now that I finally had a working machine learning model for classifying nests in a production grade environment, I could generate new nest locations for the non-nest scooters. The goal was to generate geospatial clusters based on the number of non-nest scooters in a given location.

The k-means algorithm is likely the most common clustering algorithm. However, k-means is not an optimal solution for widespread geolocation data because it minimizes variance, not geodetic distance. This can create suboptimal clustering from distortion in distance calculations at latitudes far from the equator. With this in mind, I initially set out to use the DBSCAN algorithm which clusters spatial data based on two parameters: a minimum cluster size and a physical distance from each point. There were a few issues that prevented me from moving forward with the DBSCAN algorithm.

  1. The DBSCAN algorithm does not allow for specifying the number of clusters, which was problematic as the goal was to generate a number of clusters as a function of non-nest scooters.
  2. I was unable to hone in on an optimal physical distance parameter that would dynamically change based on the Bird API data. This led to suboptimal nest locations due to a distortion in how the physical distance point was used in clustering. For example, Santa Monica, where there are ~15,000 scooters, has a higher concentration of scooters in a given area whereas Brookline, MA has a sparser set of scooter locations.

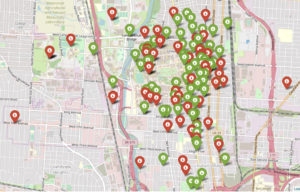
An example of how sparse scooter locations vs. highly concentrated scooter locations for a given Bird API call can create cluster distortion based on a static physical distance parameter in the DBSCAN algorithm. Left:Bird scooters in Brookline, MA. Right:Bird scooters in Santa Monica, CA.

An example of how sparse scooter locations vs. highly concentrated scooter locations for a given Bird API call can create cluster distortion based on a static physical distance parameter in the DBSCAN algorithm. Left:Bird scooters in Brookline, MA. Right:Bird scooters in Santa Monica, CA.

Given the granularity of geolocation scooter data I was working with, geospatial distortion was not an issue and the k-means algorithm would work well for generating clusters. Additionally, the k-means algorithm parameters allowed for dynamically customizing the number of clusters based on the number of non-nest scooters in a given location.

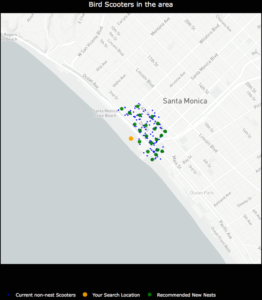
Once clusters were formed with the k-means algorithm, I derived a centroid from all of the observations within a given cluster. In this case, the centroids are the mean latitude and mean longitude for the scooters within a given cluster. The centroids coordinates are then projected as the new nest recommendations.

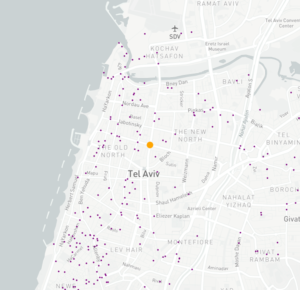
NestGenerator showcasing non-nest scooters and new nest recommendations utilizing the K-Means algorithm

NestGenerator showcasing non-nest scooters and new nest recommendations utilizing the K-Means algorithm.

NestGenerator Application

After wrapping up the machine learning components, I shifted to building out the remaining functionality of the application. The final iteration of the application is deployed to Heroku’s cloud platform.

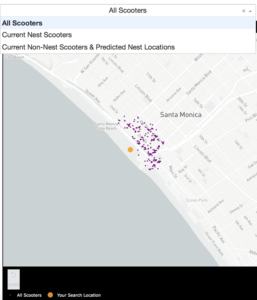
In the NestGenerator app, a user specifies a location of their choosing. This will then call the Bird API for scooters within that given location and generate all of the model features for predicting nest classification using the trained random forest model. This forms the foundation for map filtering based on nest classification. In the app, a user has the ability to filter the map based on nest classification.

Drop-Down Map View filtering based on Nest Classification

Drop-Down Map View filtering based on Nest Classification

Nearest Generated Nest

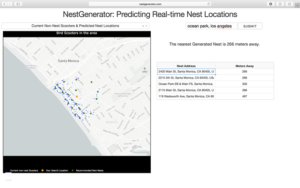
To see the generated nest recommendations, a user selects the “Current Non-Nest Scooters & Predicted Nest Locations” filter which will then populate the application with these nest locations. Based on the user’s specified search location, a table is provided with the proximity of the five closest nests and an address of the Nest location to help inform a Bird charger in their decision-making.

NestGenerator web-layout with nest addresses and proximity to nearest generated nests

NestGenerator web-layout with nest addresses and proximity to nearest generated nests

Conclusion

By accurately predicting nest classification and clustering non-nest scooters, NestGenerator provides an automated recommendation engine for new nest locations. For Bird, this application can help power their nest location generation that runs within their Android and iOS applications. NestGenerator also provides real-time strategic insight for Bird chargers who are enticed to optimize their scooter collection and drop-off route based on scooters and nest locations in their area.

Code

The code for this project can be found on my GitHub

Comments or Questions? Please email me an E-Mail!


Interview: Does Business Intelligence benefit from Cloud Data Warehousing?

Interview with Ross Perez, Senior Director, Marketing EMEA at Snowflake

Read this article in German:
“Profitiert Business Intelligence vom Data Warehouse in der Cloud?”

Does Business Intelligence benefit from Cloud Data Warehousing?

Ross Perez is the Senior Director, Marketing EMEA at Snowflake. He leads the Snowflake marketing team in EMEA and is charged with starting the discussion about analytics, data, and cloud data warehousing across EMEA. Before Snowflake, Ross was a product marketer at Tableau Software where he founded the Iron Viz Championship, the world’s largest and longest running data visualization competition.

Data Science Blog: Ross, Business Intelligence (BI) is not really a new trend. In 2019/2020, making data available for the whole company should not be a big thing anymore. Would you agree?

BI is definitely an old trend, reporting has been around for 50 years. People are accustomed to seeing statistics and data for the company at large, and even their business units. However, using BI to deliver analytics to everyone in the organization and encouraging them to make decisions based on data for their specific area is relatively new. In a lot of the companies Snowflake works with, there is a huge new group of people who have recently received access to self-service BI and visualization tools like Tableau, Looker and Sigma, and they are just starting to find answers to their questions.

Data Science Blog: Up until today, BI was just about delivering dashboards for reporting to the business. The data warehouse (DWH) was something like the backend. Today we have increased demand for data transparency. How should companies deal with this demand?

Because more people in more departments are wanting access to data more frequently, the demand on backend systems like the data warehouse is skyrocketing. In many cases, companies have data warehouses that weren’t built to cope with this concurrent demand and that means that the experience is slow. End users have to wait a long time for their reports. That is where Snowflake comes in: since we can use the power of the cloud to spin up resources on demand, we can serve any number of concurrent users. Snowflake can also house unlimited amounts of data, of both structured and semi-structured formats.

Data Science Blog: Would you say the DWH is the key driver for becoming a data-driven organization? What else should be considered here?

Absolutely. Without having all of your data in a single, highly elastic, and flexible data warehouse, it can be a huge challenge to actually deliver insight to people in the organization.

Data Science Blog: So much for the theory, now let’s talk about specific use cases. In general, it matters a lot whether you are storing and analyzing e.g. financial data or machine data. What do we have to consider for both purposes?

Financial data and machine data do look very different, and often come in different formats. For instance, financial data is often in a standard relational format. Data like this needs to be able to be easily queried with standard SQL, something that many Hadoop and noSQL tools were unable to provide. Luckily, Snowflake is an ansi-standard SQL data warehouse so it can be used with this type of data quite seamlessly.

On the other hand, machine data is often semi-structured or even completely unstructured. This type of data is becoming significantly more common with the rise of IoT, but traditional data warehouses were very bad at dealing with it since they were optimized for relational data. Semi-structured data like JSON, Avro, XML, Orc and Parquet can be loaded into Snowflake for analysis quite seamlessly in its native format. This is important, because you don’t want to have to flatten the data to get any use from it.

Both types of data are important, and Snowflake is really the first data warehouse that can work with them both seamlessly.

Data Science Blog: Back to the common business use case: Creating sales or purchase reports for the business managers, based on data from ERP-systems such as Microsoft or SAP. Which architecture for the DWH could be the right one? How many and which database layers do you see as necessary?

The type of report largely does not matter, because in all cases you want a data warehouse that can support all of your data and serve all of your users. Ideally, you also want to be able to turn it off and on depending on demand. That means that you need a cloud-based architecture… and specifically Snowflake’s innovative architecture that separates storage and compute, making it possible to pay for exactly what you use.

Data Science Blog: Where would you implement the main part of the business logic for the report? In the DWH or in the reporting tool? Does it matter which reporting tool we choose?

The great thing is that you can choose either. Snowflake, as an ansi-Standard SQL data warehouse, can support a high degree of data modeling and business logic. But you can also utilize partners like Looker and Sigma who specialize in data modeling for BI. We think it’s best that the customer chooses what is right for them.

Data Science Blog: Snowflake enables organizations to store and manage their data in the cloud. Does it mean companies lose control over their storage and data management?

Customers have complete control over their data, and in fact Snowflake cannot see, alter or change any aspect of their data. The benefit of a cloud solution is that customers don’t have to manage the infrastructure or the tuning – they decide how they want to store and analyze their data and Snowflake takes care of the rest.

Data Science Blog: How big is the effort for smaller and medium sized companies to set up a DWH in the cloud? Does this have to be an expensive long-term project in every case?

The nice thing about Snowflake is that you can get started with a free trial in a few minutes. Now, moving from a traditional data warehouse to Snowflake can take some time, depending on the legacy technology that you are using. But Snowflake itself is quite easy to set up and very much compatible with historical tools making it relatively easy to move over.

Attribution Models in Marketing

Attribution Models

A Business and Statistical Case

INTRODUCTION

A desire to understand the causal effect of campaigns on KPIs

Advertising and marketing costs represent a huge and ever more growing part of the budget of companies. Studies have found out this share is as high as 10% and increases with the size of companies (CMO study by American Marketing Association and Duke University, 2017). Measuring precisely the impact of a specific marketing campaign on the sales of a company is a critical step towards an efficient allocation of this budget. Would the return be higher for an euro spent on a Facebook ad, or should we better spend it on a TV spot? How much should I spend on Twitter ads given the volume of sales this channel is responsible for?

Attribution Models have lately received great attention in Marketing departments to answer these issues. The transition from offline to online marketing methods has indeed permitted the collection of multiple individual data throughout the whole customer journey, and  allowed for the development of user-centric attribution models. In short, Attribution Models use the information provided by Tracking technologies such as Google Analytics or Webtrekk to understand customer journeys from the first click on a Facebook ad to the final purchase and adequately ponderate the different marketing campaigns encountered depending on their responsibility in the final conversion.

Issues on Causal Effects

A key question then becomes: how to declare a channel is responsible for a purchase? In other words, how can we isolate the causal effect or incremental value of a campaign ?

          1. A/B-Tests

One method to estimate the pure impact of a campaign is the design of randomized experiments, wherein a control and treated groups are compared.  A/B tests belong to this broad category of randomized methods. Provided the groups are a priori similar in every aspect except for the treatment received, all subsequent differences may be attributed solely to the treatment. This method is typically used in medical studies to assess the effect of a drug to cure a disease.

Main practical issues regarding Randomized Methods are:

  • Assuring that control and treated groups are really similar before treatment. Uually a random assignment (i.e assuring that on a relevant set of observable variables groups are similar) is realized;
  • Potential spillover-effects, i.e the possibility that the treatment has an impact on the non-treated group as well (Stable unit treatment Value Assumption, or SUTVA in Rubin’s framework);
  • The costs of conducting such an experiment, and especially the costs linked to the deliberate assignment of individuals to a group with potentially lower results;
  • The number of such experiments to design if multiple treatments have to be measured;
  • Difficulties taking into account the interaction effects between campaigns or the effect of spending levels. Indeed, usually A/B tests are led by cutting off temporarily one campaign entirely and measuring the subsequent impact on KPI’s compared to the situation where this campaign is maintained;
  • The dynamical reproduction of experiments if we assume that treatment effects may change over time.

In the marketing context, multiple campaigns must be tested in a dynamical way, and treatment effect is likely to be heterogeneous among customers, leading to practical issues in the lauching of A/B tests to approximate the incremental value of all campaigns. However, sites with a lot of traffic and conversions can highly benefit from A/B testing as it provides a scientific and straightforward way to approximate a causal impact. Leading companies such as Uber, Netflix or Airbnb rely on internal tools for A/B testing automation, which allow them to basically test any decision they are about to make.

References:

Books:

Experiment!: Website conversion rate optimization with A/B and multivariate testing, Colin McFarland, ©2013 | New Riders  

A/B testing: the most powerful way to turn clicks into customers. Dan Siroker, Pete Koomen; Wiley, 2013.

Blogs:

https://eng.uber.com/xp

https://medium.com/airbnb-engineering/growing-our-host-community-with-online-marketing-9b2302299324

Study:

https://cmosurvey.org/wp-content/uploads/sites/15/2018/08/The_CMO_Survey-Results_by_Firm_and_Industry_Characteristics-Aug-2018.pdf

        2. Attribution models

Attribution Models do not demand to create an experimental setting. They take into account existing data and derive insights from the variability of customer journeys. One key difficulty is then to differentiate correlation and causality in the links observed between the exposition to campaigns and purchases. Indeed, selection effects may bias results as exposure to campaigns is usually dependant on user-characteristics and thus may not be necessarily independant from the customer’s baseline conversion probabilities. For example, customers purchasing from a discount price comparison website may be intrinsically different from customers buying from FB ad and this a priori difference may alone explain post-exposure differences in purchasing bahaviours. This intrinsic weakness must be remembered when interpreting Attribution Models results.

                          2.1 General Issues

The main issues regarding the implementation of Attribution Models are linked to

  • Causality and fallacious reasonning, as most models do not take into account the aforementionned selection biases.
  • Their difficult evaluation. Indeed, in almost all attribution models (except for those based on classification, where the accuracy of the model can be computed), the additionnal value brought by the use of a given attribution models cannot be evaluated using existing historical data. This additionnal value can only be approximated by analysing how the implementation of the conclusions of the attribution model have impacted a given KPI.
  • Tracking issues, leading to an uncorrect reconstruction of customer journeys
    • Cross-device journeys: cross-device issue arises from the use of different devices throughout the customer journeys, making it difficult to link datapoints. For example, if a customer searches for a product on his computer but later orders it on his mobile, the AM would then mistakenly consider it an order without prior campaign exposure. Though difficult to measure perfectly, the proportion of cross-device orders can approximate 20-30%.
    • Cookies destruction makes it difficult to track the customer his the whole journey. Both regulations and consumers’ rising concerns about data privacy issues mitigate the reliability and use of cookies.1 – From 2002 on, the EU has enacted directives concerning privacy regulation and the extended use of cookies for commercial targeting purposes, which have highly impacted marketing strategies, such as the ‘Privacy and Electronic Communications Directive’ (2002/58/EC). A research was conducted and found out that the adoption of this ‘Privacy Directive’ had led to 64% decrease in advertising methods compared to the rest of the world (Goldfarb et Tucker (2011)). The effect was stronger for generalized sites (Yahoo) than for specialized sites.2 – Users have grown more and more conscious of data privacy issues and have adopted protective measures concerning data privacy, such as automatic destruction of cookies after a session is ended, or simply giving away less personnal information (Goldfarb et Tucker (2012) ) .Valuable user information may be lost, though tracking technologies evolution have permitted to maintain tracking by other means. This issue may be particularly important in countries highly concerned with data privacy issues such as Germany.
    • Offline/Online bridge: an Attribution Model should take into account all campaigns to draw valuable insights. However, the exposure to offline campaigns (TV, newspapers) are difficult to track at the user level. One idea to tackle this issue would be to estimate the proportion of conversions led by offline campaigns through AB testing and deduce this proportion from the credit assigned to the online campaigns accounted for in the Attribution Model.
    • Touch point information available: clicks are easy to follow but irrelevant to take into account the influence of purely visual campaigns such as display ads or video.

                          2.2 Today’s main practices

Two main families of Attribution Models exist:

  • Rule-Based Attribution Models, which have been used for in the last decade but from which companies are gradualy switching.

Attribution depends on the individual journeys that have led to a purchase and is solely based on the rank of the campaign in the journey. Some models focus on a single touch points (First Click, Last Click) while others account for multi-touch journeys (Bathtube, Linear). It can be calculated at the customer level and thus doesn’t require large amounts of data points. We can distinguish two sub-groups of rule-based Attribution Models:

  • One Touch Attribution Models attribute all credit to a single touch point. The First-Click model attributes all credit for a converion to the first touch point of the customer journey; last touch attributes all credit to the last campaign.
  • Multi-touch Rule-Based Attribution Models incorporate information on the whole customer journey are thus an improvement compared to one touch models. To this family belong Linear model where credit is split equally between all channels, Bathtube model where 40% of credit is given to first and last clicks and the remaining 20% is distributed equally between the middle channels, or time-decay models where credit assigned to a click diminishes as the time between the click and the order increases..

The main advantages of rule-based models is their simplicity and cost effectiveness. The main problems are:

– They are a priori known and can thus lead to optimization strategies from competitors
– They do not take into account aggregate intelligence on customer journeys and actual incremental values.
– They tend to bias (depending on the model chosen) channels that are over-represented at the beggining or end of the funnel, according to theoretical assumptions that have no observationnal back-ups.

  • Data-Driven Attribution Models

These models take into account the weaknesses of rule-based models and make a relevant use of available data. Being data-driven, following attribution models cannot be computed using single user level data. On the contrary values are calculated through data aggregation and thus require a certain volume of customer journey information.

References:

https://dspace.mit.edu/handle/1721.1/64920


        3. Data-Driven Attribution Models in practice

                          3.1 Issues

Several issues arise in the computation of campaigns individual impact on a given KPI within a data-driven model.

  • Selection biases: Exposure to certain types of advertisement is usually highly correlated to non-observable variables which are in turn correlated to consumption practices. Differences in the behaviour of users exposed to different campaigns may thus only be driven by core differences in conversion probabilities between groups whether than by the campaign effect.
  • Complementarity: it may be that campaigns A and B only have an effect when combined, so that measuring their individual impact would lead to misleading conclusions. The model could then try to assess the effect of combinations of campaigns on top of the effect of individual campaigns. As the number of possible non-ordered combinations of k campaigns is 2k, it becomes clear that inclusing all possible combinations would however be time-consuming.
  • Order-sensitivity: The effect of a campaign A may depend on the place where it appears in the customer journey, meaning the rank of a campaign and not merely its presence could be accounted for in the model.
  • Relative Order-sensitivity: it may be that campaigns A and B only have an effect when one is exposed to campaign A before campaign B. If so, it could be useful to assess the effect of given combinations of campaigns as well. And this for all campaigns, leading to tremendous numbers of possible combinations.
  • All previous phenomenon may be present, increasing even more the potential complexity of a comprehensive Attribution Model. The number of all possible ordered combination of k campaigns is indeed :


                          3.2 Main models

                                  A) Logistic Regression and Classification models

If non converting journeys are available, Attribition Model can be shaped as a simple classification issue. Campaign types or campaigns combination and volume of campaign types can be included in the model along with customer or time variables. As we are interested in inference (on campaigns effect) whether than prediction, a parametric model should be used, such as Logistic Regression. Non paramatric models such as Random Forests or Neural Networks can also be used though the interpretation of campaigns value would be more difficult to derive from the model results.

A common pitfall is the usual issue of spurious correlations on one hand and the correct interpretation of coefficients in business terms.

An advantage if the possibility to evaluate the relevance of the model using common model validation methods to evaluate its predictive power (validation set \ AUC \pseudo R squared).

                                  B) Shapley Value

Theory

The Shapley Value is based on a Game Theory framework and is named after its creator, the Nobel Price Laureate Lloyd Shapley. Initially meant to calculate the marginal contribution of players in cooperative games, the model has received much attention in research and industry and has lately been applied to marketing issues. This model is typically used by Google Adords and other ad bidding vendors. Campaigns or marketing channels are in this model seen as compementary players looking forward to increasing a given KPI.
Contrarily to Logistic Regressions, it is a non-parametric model. Contrarily to Markov Chains, all results are built using existing journeys, and not simulated ones.

Channels are considered to enter the game sequentially under a certain joining order. Shapley value try to The Shapley value of channel i is the weighted sum of the marginal values that channel i adds to all possible coalitions that don’t contain channel i.
In other words, the main logic is to analyse the difference of gains when a channel i is added after a coalition Ck of k channels, k<=n. We then sum all the marginal contributions over all possible ordered combination Ck of all campaigns excluding i, with k<=n-1.

Subsets framework

A first an most usual way to compute the Shapley Vaue is to consider that when a channel enters coalition, its additionnal value is the same irrelevant of the order in which previous channels have appeared. In other words, journeys (A>B>C) and (B>A>C) trigger the same gains.
Shapley value is computed as the gains associated to adding a channel i to a subset of channels, weighted by the number of (ordered) sequences that the (unordered) subset represents, summed up on all possible subsets of the total set of campaigns where the channel i is not present.
The Shapley value of the channel ???????? is then:

where |S| is the number of campaigns of a coalition S and the sum extends over all subsets S that do not not contain channel j. ????(????)  is the value of the coalition S and ????(???? ∪ {????????})  the value of the coalition formed by adding ???????? to coalition S. ????(???? ∪ {????????}) − ????(????) is thus the marginal contribution of channel ???????? to the coalition S.

The formula can be rewritten and understood as:

This method is convenient when data on the gains of on all possible permutations of all unordered k subsets of the n campaigns are available. It is also more convenient if the order of campaigns prior to the introduction of a campaign is thought to have no impact.

Ordered sequences

Let us define ????((A>B)) as the value of the sequence A then B. What is we let ????((A>B)) be different from ????((B>A)) ?
This time we would need to sum over all possible permutation of the S campaigns present before  ???????? and the N-(S+1) campaigns after ????????. Doing so we will sum over all possible orderings (i.e all permutations of the n campaigns of the grand coalition containing all campaigns) and we can remove the permutation coefficient s!(p-s+1)!.

This method is convenient when the order of channels prior to and after the introduction of another channel is assumed to have an impact. It is also necessary to possess data for all possible permutations of all k subsets of the n campaigns, and not only on all (unordered) k-subsets of the n campaigns, k<=n. In other words, one must know the gains of A, B, C, A>B, B>A, etc. to compute the Shapley Value.

Differences between the two approaches

We simulate an ordered case where the value for each ordered sequence k for k<=3 is known. We compare it to the usual Shapley value calculated based on known gains of unordered subsets of campaigns. So as to compare relevant values, we have built the gains matrix so that the gains of a subset A, B i.e  ????({B,A}) is the average of the gains of ordered sequences made up with A and B (assuming the number of journeys where A>B equals the number of journeys where B>A, we have ????({B,A})=0.5( ????((A>B)) + ????((B>A)) ). We let the value of the grand coalition be different depending on the order of campaigns-keeping the constraints that it averages to the value used for the unordered case.

Note: mvA refers to the marginal value of A in a given sequence.
With traditionnal unordered coalitions:

With ordered sequences used to compute the marginal values:
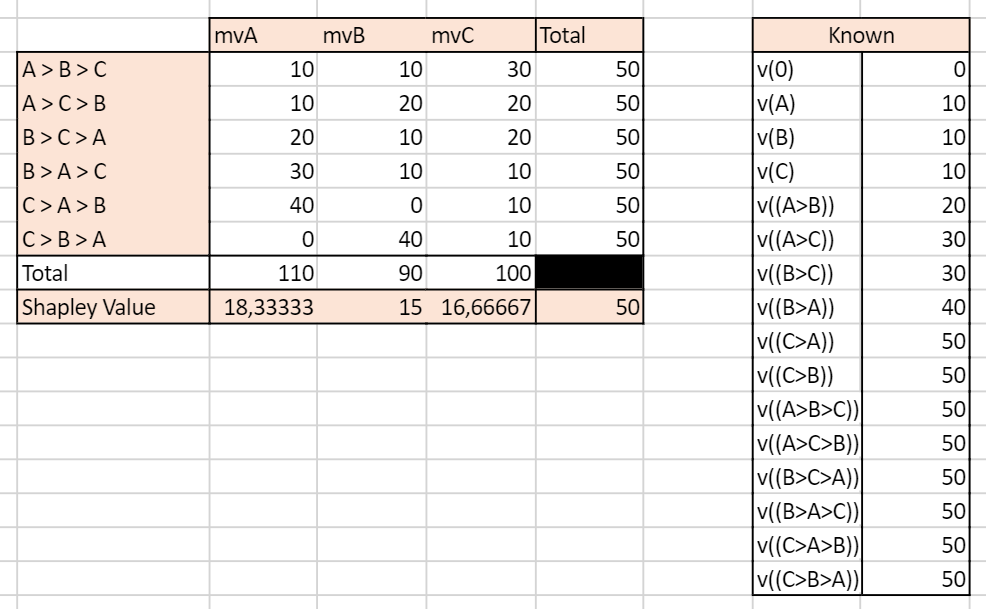
 

We can see that the two approaches yield very different results. In the unordered case, the Shapley Value campaign C is the highest, culminating at 20, while A and B have the same Shapley Value mvA=mvB=15. In the ordered case, campaign A has the highest Shapley Value and all campaigns have different Shapley Values.

This example illustrates the inherent differences between the set and sequences approach to Shapley values. Real life data is more likely to resemble the ordered case as conversion probabilities may for any given set of campaigns be influenced by the order through which the campaigns appear.

Advantages

Shapley value has become popular in allocation problems in cooperative games because it is the unique allocation which satisfies different axioms:

  • Efficiency: Shaple Values of all channels add up to the total gains (here, orders) observed.
  • Symmetry: if channels A and B bring the same contribution to any coalition of campaigns, then their Shapley Value i sthe same
  • Null player: if a channel brings no additionnal gains to all coalitions, then its Shapley Value is zero
  • Strong monotony: the Shapley Value of a player increases weakly if all its marginal contributions increase weakly

These properties make the Shapley Value close to what we intuitively define as a fair attribution.

Issues

  • The Shapley Value is based on combinatory mathematics, and the number of possible coalitions and ordered sequences becomes huge when the number of campaigns increases.
  • If unordered, the Shapley Value assumes the contribution of campaign A is the same if followed by campaign B or by C.
  • If ordered, the number of combinations for which data must be available and sufficient is huge.
  • Channels rarely present or present in long journeys will be played down.
  • Generally, gains are supposed to grow with the number of players in the game. However, it is plausible that in the marketing context a journey with a high number of channels will not necessarily bring more orders than a journey with less channels involved.

References:

R package: GameTheoryAllocation

Article:
Zhao & al, 2018 “Shapley Value Methods for Attribution Modeling in Online Advertising “
https://link.springer.com/content/pdf/10.1007/s13278-017-0480-z.pdf
Courses: https://www.lamsade.dauphine.fr/~airiau/Teaching/CoopGames/2011/coopgames-7%5b8up%5d.pdf
Blogs: https://towardsdatascience.com/one-feature-attribution-method-to-supposedly-rule-them-all-shapley-values-f3e04534983d

                                  B) Markov Chains

Markov Chains are used to model random processes, i.e events that occur in a sequential manner and in such a way that the probability to move to a certain state only depends on the past steps. The number of previous steps that are taken into account to model the transition probability is called the memory parameter of the sequence, and for the model to have a solution must be comprised between 0 and 4. A Markov Chain process is thus defined entirely by its Transition Matrix and its initial vector (i.e the starting point of the process).

Markov Chains are applied in many scientific fields. Typically, they are used in weather forecasting, with the sequence of Sunny and Rainy days following a Markov Process of memory parameter 0, so that for each given day the probability that the next day will be rainy or sunny only depends on the weather of the current day. Other applications can be found in sociology to understand the dynamics of social classes intergenerational reproduction. To get more both mathematical and applied illustration, I recommend the reading of this course.

In the marketing context, Markov Chains are an interesting way to model the conversion funnel. To go from the from the Markov Model to the Attribution logic, we calculate the Removal Effect of each channel, i.e the difference in conversions that happen if the channel is removed. Please read below for an introduction to the methodology.

The first step in a Markov Chains Attribution Model is to build the transition matrix that captures the transition probabilities between the campaigns accross existing customer journeys. This Matrix is to be read as a “From state A to state B” table, from the left to the right. A first difficulty is finding the right memory parameter to use. A large memory parameter would allow to take more into account interraction effects within the conversion funnel but would lead to increased computationnal time, a non-readable transition matrix, and be more sensitive to noisy data. Please note that this transition matrix provides useful information on the conversion funnel and on the relationships between campaigns and can be used as such as an analytical tool. I suggest the clear and easily R code which can be found here or here.

Here is an illustration of a Markov Chain with memory Parameter of 0: the probability to go to a certain campaign B in the next step only depend on the campaign we are currently at:
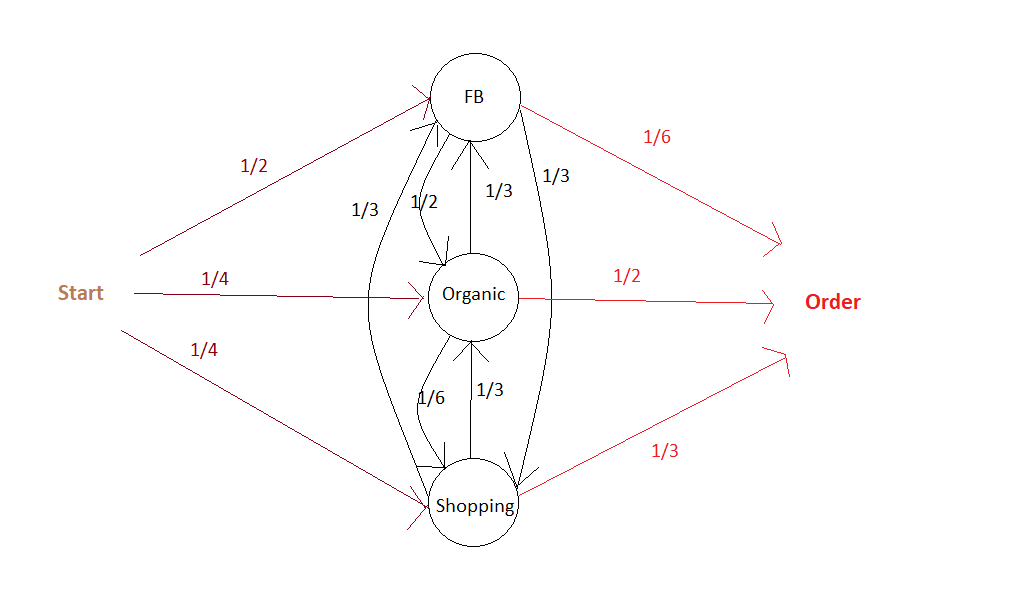
The associated Transition Matrix is then (with null probabilities left as Blank):
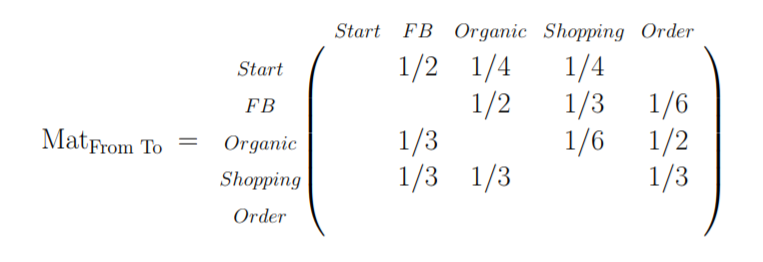
The second step is  to compute the actual responsibility of a channel in total conversions. As mentionned above, the main philosophy to do so is to calculate the Removal Effect of each channel, i.e the changes in the number of conversions when a channel is entirely removed. All customer journeys which went through this channel are settled out to be unsuccessful. This calculation is done by applying the transition matrix with and without the removed channels to an initial vector that contains the number of desired simulations.

Building on our current example, we can then settle an initial vector with the desired number of simulations, e.g 10 000:


It is possible at this stage to add a constraint on the maximum number of times the matrix is applied to the data, i.e on the maximal number of campaigns a simulated journey is allowed to have.

Advantages

  • The dynamic journey is taken into account, as well as the transition between two states. The funnel is not assumed to be linear.
  • It is possile to build a conversion graph that maps the customer journey provides valuable insights.
  • It is possible to evaluate partly the accuracy of the Attribution Model based on Markov Chains. It is for example possible to see how well the transition matrix help predict the future by analysing the number of correct predictions at any given step over all sequences.

Disadvantages

  • It can be somewhat difficult to set the memory parameter. Complementarity effects between channels are not well taken into account if the memory is low, but a parameter too high will lead to over-sensitivity to noise in the data and be difficult to implement if customer journeys tend to have a number of campaigns below this memory parameter.
  • Long journeys with different channels involved will be overweighted, as they will count many times in the Removal Effect.  For example, if there are n-1 channels in the customer journey, this journey will be considered as failure for the n-1 channel-RE. If the volume effects (i.e the impact of the overall number of channels in a journey, irrelevant from their type° are important then results may be biased.

References:

R package: ChannelAttribution

Git:

https://github.com/MatCyt/Markov-Chain/blob/master/README.md

Course:

https://www.ssc.wisc.edu/~jmontgom/markovchains.pdf

Article:

“Mapping the Customer Journey: A Graph-Based Framework for Online Attribution Modeling”; Anderl, Eva and Becker, Ingo and Wangenheim, Florian V. and Schumann, Jan Hendrik, 2014. Available at SSRN: https://ssrn.com/abstract=2343077 or http://dx.doi.org/10.2139/ssrn.2343077

“Media Exposure through the Funnel: A Model of Multi-Stage Attribution”, Abhishek & al, 2012

“Multichannel Marketing Attribution Using Markov Chains”, Kakalejčík, L., Bucko, J., Resende, P.A.A. and Ferencova, M. Journal of Applied Management and Investments, Vol. 7 No. 1, pp. 49-60.  2018

Blogs:

https://analyzecore.com/2016/08/03/attribution-model-r-part-1

https://analyzecore.com/2016/08/03/attribution-model-r-part-2

                          3.3 To go further: Tackling selection biases with Quasi-Experiments

Exposure to certain types of advertisement is usually highly correlated to non-observable variables. Differences in the behaviour of users exposed to different campaigns may thus only be driven by core differences in converison probabilities between groups whether than by the campaign effect. These potential selection effects may bias the results obtained using historical data.

Quasi-Experiments can help correct this selection effect while still using available observationnal data.  These methods recreate the settings on a randomized setting. The goal is to come as close as possible to the ideal of comparing two populations that are identical in all respects except for the advertising exposure. However, populations might still differ with respect to some unobserved characteristics.

Common quasi-experimental methods used for instance in Public Policy Evaluation are:

  • Discontinuity Regressions
  • Matching Methods, such as Exact Matching,  Propensity-score matching or k-nearest neighbourghs.

References:

Article:

“Towards a digital Attribution Model: Measuring the impact of display advertising on online consumer behaviour”, Anindya Ghose & al, MIS Quarterly Vol. 40 No. 4, pp. 1-XX, 2016

https://pdfs.semanticscholar.org/4fa6/1c53f281fa63a9f0617fbd794d54911a2f84.pdf

        4. First Steps towards a Practical Implementation

Identify key points of interests

  • Identify the nature of touchpoints available: is the data based on clicks? If so, is there a way to complement the data with A/B tests to measure the influence of ads without clicks (display, video) ? For example, what happens to sales when display campaign is removed? Analysing this multiplier effect would give the overall responsibility of display on sales, to be deduced from current attribution values given to click-based channels. More interestingly, what is the impact of the removal of display campaign on the occurences of click-based campaigns ? This would give us an idea of the impact of display ads on the exposure to each other campaigns, which would help correct the attribution values more precisely at the campaign level.
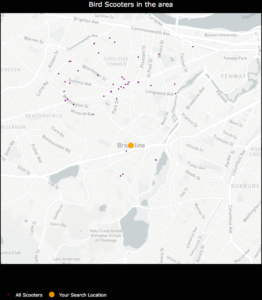
  • Define the KPI to track. From a pure Marketing perspective, looking at purchases may be sufficient, but from a financial perspective looking at profits, though a bit more difficult to compute, may drive more interesting results.
  • Define a customer journey. It may seem obvious, but the notion needs to be clarified at first. Would it be defined by a time limit? If so, which one? Does it end when a conversion is observed? For example, if a customer makes 2 purchases, would the campaigns he’s been exposed to before the first order still be accounted for in the second order? If so, with a time decay?
  • Define the research framework: are we interested only in customer journeys which have led to conversions or in all journeys? Keep in mind that successful customer journeys are a non-representative sample of customer journeys. Models built on the analysis of biased samples may be conservative. Take an extreme example: 80% of customers who see campaign A buy the product, VS 1% for campaign B. However, campaign B exposure is great and 100 Million people see it VS only 1M for campaign A. An Attribution Model based on successful journeys will give higher credit to campaign B which is an auguable conclusion. Taking into account costs per campaign (in the case where costs are calculated by clicks) may of course tackle this issue partly, as campaign A could then exhibit higher returns, but a serious fallacious reasonning is at stake here.

Analyse the typical customer journey    

  • Performing a duration analysis on the data may help you improve the definition of the customer journey to be used by your organization. After which days are converison probabilities null? Should we consider the effect of campaigns disappears after x days without orders? For example, if 99% of orders are placed in the 30 days following a first click, it might be interesting to define the customer journey as a 30 days time frame following the first oder.
  • Look at the distribution of the number of campaigns in a typical journey. If you choose to calculate the effect of campaigns interraction in your Attribution Model, it may indeed help you determine the maximum number of campaigns to be included in a combination. Indeed, you may not need to assess the impact of channel combinations with above than 4 different channels if 95% of orders are placed after less then 4 campaigns.
  • Transition matrixes: what if a campaign A systematically leads to a campaign B? What happens if we remove A or B? These insights would give clues to ask precise questions for a latter AB test, for example to find out if there is complementarity between channels A and B – (implying none should be removed) or mere substitution (implying one can be given up).
  • If conversion rates are available: it can be interesting to perform a survival analysis i.e to analyse the likelihood of conversion based on duration since first click. This could help us excluse potential outliers or individuals who have very low conversion probabilities.

Summary

Attribution is a complex topic which will probably never be definitively solved. Indeed, a main issue is the difficulty, or even impossibility, to evaluate precisely the accuracy of the attribution model that we’ve built. Attribution Models should be seen as a good yet always improvable approximation of the incremental values of campaigns, and be presented with their intrinsinc limits and biases.