Interview – Knowledge Graphs and Semantic Technologies

“It’s incredibly empowering when data that is clear and understood – what we call ‘beautiful data’ – is available to the data workforce.”

Juan F. Sequeda is co-founder of Capsenta, a spin-off from his research, and Senior Director of Capsenta Labs. He is an expert on knowledge graphs, semantic web, semantic & graph data management and (ontology-based) data integration. In this interview Juan lets us know how SMEs can create value from data, what makes the Knowledge Graph so important and why CDOs and CIOs should use semantic technologies.

Data Science Blog: If you had to name five things that apply to SMEs as well as enterprises as they are on their journey through digital transformation: What are the most important steps to take in order to create value from data?

I would state four things:

  1. Focus on the business problem that needs to be solved instead of the technology.
  2. Getting value out of your data is a social-technical problem. Not everything can be solved by technology and automation. It is crucial to understand the social/human aspect of the problems.
  3. Avoid boiling the ocean. Be agile and iterate.
  4. Recall that it’s a marathon, not a sprint. Hence why you shouldn’t focus on boiling the ocean.

Data Science Blog: You help companies to make their company data meaningfully and thus increase their value. The magic word is the knowledge graph. What exactly is a Knowledge Graph?

Let’s recall that the term “knowledge graph”, that is being actively used today, was coined by Google in a 2012 blogpost. From an industry point of view, it’s a term that represents data integration, where not just entities but also relationships are first class citizens. In other words, it’s data integration based on graphs. That is why you see graph database companies use the term knowledge graph instead of data integration.

In the academic circle, there is a “debate” on what the term “knowledge graph” means. As academics, it’s clear that we should always strive to have well defined terms. Nevertheless, I find it ironic that academics are spending time debating on the definition of a term that appeared in a (marketing) blog post 7 years ago! I agree with Simeon Warner on this: “I care about putting more knowledge in my graph, instead of defining what is a knowledge graph”.

Whatever definition prevails, it should be open and inclusive.

On a final note, it is paramount that we remember our history in order to avoid reinventing the wheel. There is over half a century of research results that has led us to what we are calling Knowledge Graphs today. If you are interested, please check out our upcoming ISWC 2019 tutorial “Knowledge Graphs: How did we get here? A Half Day Tutorial on the History of Knowledge Graph’s Main Ideas“.

Data Science Blog: Speaking of Knowledge Graphs: According to SEMANTiCS 2019 Research and Innovation Chair Philippe Cudre-Mauroux the next generation of knowledge graphs will capture more detailed information. Towards which directions are you steering with gra.fo?

Gra.fo is a knowledge graph schema (i.e ontology) collaborative modeling tool combined with google doc style features such as real-time collaboration, comments, history and search.

Designing a knowledge graph schema is just the first step. You have to do something with it! The next step is to map the knowledge graph schema to underlying data sources in order to integrate data.

We are driving Gra.fo to also be a mapping management system. We recently released our first mapping features. You now have the ability to import existing R2RML mapping. The next step will be to create the mappings between relational databases and the schema all within Gra.fo. Furthermore, we will extend to support mappings from different types of sources.

Finally, there are so many features that our users are requesting. We are working on those and will also offer an API in order to empower users to develop their own apps and features.

Data Science Blog: At Capsenta, you are changing the way enterprises model, govern and integrate data. Put in brief, how can you explain the benefits of using semantic technologies and knowledge technologies to a CDO or CIO? Which clients could you serve and how did you help them?

Business users need to answer critical business questions quickly and accurately. However, the frequent bottleneck is the lack of understanding of the large and complex enterprise databases. Additionally, the IT experts who do understand are not always available. The ultimate goal is to empower business users to access the data in the way they think of their domain.

This is where Knowledge Graphs come into play.

At Capsenta, we use our Knowledge Graph technology to bridge this conceptualization gap between the complex and inscrutable data sources and the business intelligence and data analytic tools that domain experts use to answer critical business questions. Our goal is to deliver beautiful data so the business users and data scientist can run with the data.

We are helping large scale enterprises in e-commerce, oil & gas and life science industries to generate beautiful data.

Data Science Blog: What are reasons for which Knowledge Graphs should be part of any corporate strategy?

Graphs are very easy for people to understand and express the complex relationships between concepts. Bubbles and lines between them (i.e. a graph!) is what domain experts draw on the whiteboard all the time. We have even had C-level executives look at a Knowledge Graph and immediately see how it expresses a portion of their business and even offer suggestions for additional richness. Imagine that, C-level executives participating in an ontology engineering session because they understand the graph.

This is in sharp contrast to the data itself, which is almost always very difficult to understand and overwhelming in scope. Critical business value is available in a subset of this data. A Knowledge Graph bridges the conceptual gap between a critical portion of the inscrutable data itself and the business user’s view of their world.

It’s incredibly empowering when data that is clear and understood – what we call “beautiful data” – is available to the data workforce.

Data Science Blog: Data-driven process analyzes require interdisciplinary knowledge. What advice would you give to a process manager who wants to familiarize her-/himself with the topic?

Domain experts/business users frequently use multiple words/phrases to mean the same thing and also a specific phrase can mean different things to different people. Also, the domain experts/business users speak a very different language than the IT database owners.

How can the business have clear, accurate answers when there’s inconsistency in what people mean and are thinking?

This is the social problem of getting everyone on the same page. We’ve seen Knowledge Graphs dramatically help with this problem. The exercise of getting people to agree upon what they mean and encoding it in an intuitive Knowledge Graph is very powerful.

The Knowledge Graph also brings the IT stakeholders into the process by clarifying exactly what data or, typically, complex calculations of data is the actual, accurate value for each and every business concept and relationship expressed in the Knowledge Graph.

It is crucial to avoid boiling the ocean. That is why we have designed a pay-as-you-go methodology to start small and provide value as quickly and accurately as possible. Ideally, the team has available what we call a “Knowledge Engineer”. This is someone who can effectively speak with the business users/domain experts and also nerd out with the database folks.

About SEMANTiCS Conference

SEMANTiCS is an established knowledge hub where technology professionals, industry experts, researchers and decision makers can learn about new technologies, innovations and enterprise implementations in the fields of Linked Data and Semantic AI. Founded in 2005 the SEMANTiCS is the only European conference at the intersection of research and industry.

This year’s event is hosted by the Semantic Web Company, FIZ Karlsruhe – Leibniz Institute for Information Infrastructure GmbH, Fachhochschule St. Pölten Forschungs GmbH, KILT Competence Center am Institut für Angewandte Informatik e.V. and Vrije Universiteit Amsterdam.

Interview: Does Business Intelligence benefit from Cloud Data Warehousing?

Interview with Ross Perez, Senior Director, Marketing EMEA at Snowflake

Read this article in German:
“Profitiert Business Intelligence vom Data Warehouse in der Cloud?”

Does Business Intelligence benefit from Cloud Data Warehousing?

Ross Perez is the Senior Director, Marketing EMEA at Snowflake. He leads the Snowflake marketing team in EMEA and is charged with starting the discussion about analytics, data, and cloud data warehousing across EMEA. Before Snowflake, Ross was a product marketer at Tableau Software where he founded the Iron Viz Championship, the world’s largest and longest running data visualization competition.

Data Science Blog: Ross, Business Intelligence (BI) is not really a new trend. In 2019/2020, making data available for the whole company should not be a big thing anymore. Would you agree?

BI is definitely an old trend, reporting has been around for 50 years. People are accustomed to seeing statistics and data for the company at large, and even their business units. However, using BI to deliver analytics to everyone in the organization and encouraging them to make decisions based on data for their specific area is relatively new. In a lot of the companies Snowflake works with, there is a huge new group of people who have recently received access to self-service BI and visualization tools like Tableau, Looker and Sigma, and they are just starting to find answers to their questions.

Data Science Blog: Up until today, BI was just about delivering dashboards for reporting to the business. The data warehouse (DWH) was something like the backend. Today we have increased demand for data transparency. How should companies deal with this demand?

Because more people in more departments are wanting access to data more frequently, the demand on backend systems like the data warehouse is skyrocketing. In many cases, companies have data warehouses that weren’t built to cope with this concurrent demand and that means that the experience is slow. End users have to wait a long time for their reports. That is where Snowflake comes in: since we can use the power of the cloud to spin up resources on demand, we can serve any number of concurrent users. Snowflake can also house unlimited amounts of data, of both structured and semi-structured formats.

Data Science Blog: Would you say the DWH is the key driver for becoming a data-driven organization? What else should be considered here?

Absolutely. Without having all of your data in a single, highly elastic, and flexible data warehouse, it can be a huge challenge to actually deliver insight to people in the organization.

Data Science Blog: So much for the theory, now let’s talk about specific use cases. In general, it matters a lot whether you are storing and analyzing e.g. financial data or machine data. What do we have to consider for both purposes?

Financial data and machine data do look very different, and often come in different formats. For instance, financial data is often in a standard relational format. Data like this needs to be able to be easily queried with standard SQL, something that many Hadoop and noSQL tools were unable to provide. Luckily, Snowflake is an ansi-standard SQL data warehouse so it can be used with this type of data quite seamlessly.

On the other hand, machine data is often semi-structured or even completely unstructured. This type of data is becoming significantly more common with the rise of IoT, but traditional data warehouses were very bad at dealing with it since they were optimized for relational data. Semi-structured data like JSON, Avro, XML, Orc and Parquet can be loaded into Snowflake for analysis quite seamlessly in its native format. This is important, because you don’t want to have to flatten the data to get any use from it.

Both types of data are important, and Snowflake is really the first data warehouse that can work with them both seamlessly.

Data Science Blog: Back to the common business use case: Creating sales or purchase reports for the business managers, based on data from ERP-systems such as Microsoft or SAP. Which architecture for the DWH could be the right one? How many and which database layers do you see as necessary?

The type of report largely does not matter, because in all cases you want a data warehouse that can support all of your data and serve all of your users. Ideally, you also want to be able to turn it off and on depending on demand. That means that you need a cloud-based architecture… and specifically Snowflake’s innovative architecture that separates storage and compute, making it possible to pay for exactly what you use.

Data Science Blog: Where would you implement the main part of the business logic for the report? In the DWH or in the reporting tool? Does it matter which reporting tool we choose?

The great thing is that you can choose either. Snowflake, as an ansi-Standard SQL data warehouse, can support a high degree of data modeling and business logic. But you can also utilize partners like Looker and Sigma who specialize in data modeling for BI. We think it’s best that the customer chooses what is right for them.

Data Science Blog: Snowflake enables organizations to store and manage their data in the cloud. Does it mean companies lose control over their storage and data management?

Customers have complete control over their data, and in fact Snowflake cannot see, alter or change any aspect of their data. The benefit of a cloud solution is that customers don’t have to manage the infrastructure or the tuning – they decide how they want to store and analyze their data and Snowflake takes care of the rest.

Data Science Blog: How big is the effort for smaller and medium sized companies to set up a DWH in the cloud? Does this have to be an expensive long-term project in every case?

The nice thing about Snowflake is that you can get started with a free trial in a few minutes. Now, moving from a traditional data warehouse to Snowflake can take some time, depending on the legacy technology that you are using. But Snowflake itself is quite easy to set up and very much compatible with historical tools making it relatively easy to move over.

Attribution Models in Marketing

Attribution Models

A Business and Statistical Case

INTRODUCTION

A desire to understand the causal effect of campaigns on KPIs

Advertising and marketing costs represent a huge and ever more growing part of the budget of companies. Studies have found out this share is as high as 10% and increases with the size of companies (CMO study by American Marketing Association and Duke University, 2017). Measuring precisely the impact of a specific marketing campaign on the sales of a company is a critical step towards an efficient allocation of this budget. Would the return be higher for an euro spent on a Facebook ad, or should we better spend it on a TV spot? How much should I spend on Twitter ads given the volume of sales this channel is responsible for?

Attribution Models have lately received great attention in Marketing departments to answer these issues. The transition from offline to online marketing methods has indeed permitted the collection of multiple individual data throughout the whole customer journey, and  allowed for the development of user-centric attribution models. In short, Attribution Models use the information provided by Tracking technologies such as Google Analytics or Webtrekk to understand customer journeys from the first click on a Facebook ad to the final purchase and adequately ponderate the different marketing campaigns encountered depending on their responsibility in the final conversion.

Issues on Causal Effects

A key question then becomes: how to declare a channel is responsible for a purchase? In other words, how can we isolate the causal effect or incremental value of a campaign ?

          1. A/B-Tests

One method to estimate the pure impact of a campaign is the design of randomized experiments, wherein a control and treated groups are compared.  A/B tests belong to this broad category of randomized methods. Provided the groups are a priori similar in every aspect except for the treatment received, all subsequent differences may be attributed solely to the treatment. This method is typically used in medical studies to assess the effect of a drug to cure a disease.

Main practical issues regarding Randomized Methods are:

  • Assuring that control and treated groups are really similar before treatment. Uually a random assignment (i.e assuring that on a relevant set of observable variables groups are similar) is realized;
  • Potential spillover-effects, i.e the possibility that the treatment has an impact on the non-treated group as well (Stable unit treatment Value Assumption, or SUTVA in Rubin’s framework);
  • The costs of conducting such an experiment, and especially the costs linked to the deliberate assignment of individuals to a group with potentially lower results;
  • The number of such experiments to design if multiple treatments have to be measured;
  • Difficulties taking into account the interaction effects between campaigns or the effect of spending levels. Indeed, usually A/B tests are led by cutting off temporarily one campaign entirely and measuring the subsequent impact on KPI’s compared to the situation where this campaign is maintained;
  • The dynamical reproduction of experiments if we assume that treatment effects may change over time.

In the marketing context, multiple campaigns must be tested in a dynamical way, and treatment effect is likely to be heterogeneous among customers, leading to practical issues in the lauching of A/B tests to approximate the incremental value of all campaigns. However, sites with a lot of traffic and conversions can highly benefit from A/B testing as it provides a scientific and straightforward way to approximate a causal impact. Leading companies such as Uber, Netflix or Airbnb rely on internal tools for A/B testing automation, which allow them to basically test any decision they are about to make.

References:

Books:

Experiment!: Website conversion rate optimization with A/B and multivariate testing, Colin McFarland, ©2013 | New Riders  

A/B testing: the most powerful way to turn clicks into customers. Dan Siroker, Pete Koomen; Wiley, 2013.

Blogs:

https://eng.uber.com/xp

https://medium.com/airbnb-engineering/growing-our-host-community-with-online-marketing-9b2302299324

Study:

https://cmosurvey.org/wp-content/uploads/sites/15/2018/08/The_CMO_Survey-Results_by_Firm_and_Industry_Characteristics-Aug-2018.pdf

        2. Attribution models

Attribution Models do not demand to create an experimental setting. They take into account existing data and derive insights from the variability of customer journeys. One key difficulty is then to differentiate correlation and causality in the links observed between the exposition to campaigns and purchases. Indeed, selection effects may bias results as exposure to campaigns is usually dependant on user-characteristics and thus may not be necessarily independant from the customer’s baseline conversion probabilities. For example, customers purchasing from a discount price comparison website may be intrinsically different from customers buying from FB ad and this a priori difference may alone explain post-exposure differences in purchasing bahaviours. This intrinsic weakness must be remembered when interpreting Attribution Models results.

                          2.1 General Issues

The main issues regarding the implementation of Attribution Models are linked to

  • Causality and fallacious reasonning, as most models do not take into account the aforementionned selection biases.
  • Their difficult evaluation. Indeed, in almost all attribution models (except for those based on classification, where the accuracy of the model can be computed), the additionnal value brought by the use of a given attribution models cannot be evaluated using existing historical data. This additionnal value can only be approximated by analysing how the implementation of the conclusions of the attribution model have impacted a given KPI.
  • Tracking issues, leading to an uncorrect reconstruction of customer journeys
    • Cross-device journeys: cross-device issue arises from the use of different devices throughout the customer journeys, making it difficult to link datapoints. For example, if a customer searches for a product on his computer but later orders it on his mobile, the AM would then mistakenly consider it an order without prior campaign exposure. Though difficult to measure perfectly, the proportion of cross-device orders can approximate 20-30%.
    • Cookies destruction makes it difficult to track the customer his the whole journey. Both regulations and consumers’ rising concerns about data privacy issues mitigate the reliability and use of cookies.1 – From 2002 on, the EU has enacted directives concerning privacy regulation and the extended use of cookies for commercial targeting purposes, which have highly impacted marketing strategies, such as the ‘Privacy and Electronic Communications Directive’ (2002/58/EC). A research was conducted and found out that the adoption of this ‘Privacy Directive’ had led to 64% decrease in advertising methods compared to the rest of the world (Goldfarb et Tucker (2011)). The effect was stronger for generalized sites (Yahoo) than for specialized sites.2 – Users have grown more and more conscious of data privacy issues and have adopted protective measures concerning data privacy, such as automatic destruction of cookies after a session is ended, or simply giving away less personnal information (Goldfarb et Tucker (2012) ) .Valuable user information may be lost, though tracking technologies evolution have permitted to maintain tracking by other means. This issue may be particularly important in countries highly concerned with data privacy issues such as Germany.
    • Offline/Online bridge: an Attribution Model should take into account all campaigns to draw valuable insights. However, the exposure to offline campaigns (TV, newspapers) are difficult to track at the user level. One idea to tackle this issue would be to estimate the proportion of conversions led by offline campaigns through AB testing and deduce this proportion from the credit assigned to the online campaigns accounted for in the Attribution Model.
    • Touch point information available: clicks are easy to follow but irrelevant to take into account the influence of purely visual campaigns such as display ads or video.

                          2.2 Today’s main practices

Two main families of Attribution Models exist:

  • Rule-Based Attribution Models, which have been used for in the last decade but from which companies are gradualy switching.

Attribution depends on the individual journeys that have led to a purchase and is solely based on the rank of the campaign in the journey. Some models focus on a single touch points (First Click, Last Click) while others account for multi-touch journeys (Bathtube, Linear). It can be calculated at the customer level and thus doesn’t require large amounts of data points. We can distinguish two sub-groups of rule-based Attribution Models:

  • One Touch Attribution Models attribute all credit to a single touch point. The First-Click model attributes all credit for a converion to the first touch point of the customer journey; last touch attributes all credit to the last campaign.
  • Multi-touch Rule-Based Attribution Models incorporate information on the whole customer journey are thus an improvement compared to one touch models. To this family belong Linear model where credit is split equally between all channels, Bathtube model where 40% of credit is given to first and last clicks and the remaining 20% is distributed equally between the middle channels, or time-decay models where credit assigned to a click diminishes as the time between the click and the order increases..

The main advantages of rule-based models is their simplicity and cost effectiveness. The main problems are:

– They are a priori known and can thus lead to optimization strategies from competitors
– They do not take into account aggregate intelligence on customer journeys and actual incremental values.
– They tend to bias (depending on the model chosen) channels that are over-represented at the beggining or end of the funnel, according to theoretical assumptions that have no observationnal back-ups.

  • Data-Driven Attribution Models

These models take into account the weaknesses of rule-based models and make a relevant use of available data. Being data-driven, following attribution models cannot be computed using single user level data. On the contrary values are calculated through data aggregation and thus require a certain volume of customer journey information.

References:

https://dspace.mit.edu/handle/1721.1/64920


        3. Data-Driven Attribution Models in practice

                          3.1 Issues

Several issues arise in the computation of campaigns individual impact on a given KPI within a data-driven model.

  • Selection biases: Exposure to certain types of advertisement is usually highly correlated to non-observable variables which are in turn correlated to consumption practices. Differences in the behaviour of users exposed to different campaigns may thus only be driven by core differences in conversion probabilities between groups whether than by the campaign effect.
  • Complementarity: it may be that campaigns A and B only have an effect when combined, so that measuring their individual impact would lead to misleading conclusions. The model could then try to assess the effect of combinations of campaigns on top of the effect of individual campaigns. As the number of possible non-ordered combinations of k campaigns is 2k, it becomes clear that inclusing all possible combinations would however be time-consuming.
  • Order-sensitivity: The effect of a campaign A may depend on the place where it appears in the customer journey, meaning the rank of a campaign and not merely its presence could be accounted for in the model.
  • Relative Order-sensitivity: it may be that campaigns A and B only have an effect when one is exposed to campaign A before campaign B. If so, it could be useful to assess the effect of given combinations of campaigns as well. And this for all campaigns, leading to tremendous numbers of possible combinations.
  • All previous phenomenon may be present, increasing even more the potential complexity of a comprehensive Attribution Model. The number of all possible ordered combination of k campaigns is indeed :


                          3.2 Main models

                                  A) Logistic Regression and Classification models

If non converting journeys are available, Attribition Model can be shaped as a simple classification issue. Campaign types or campaigns combination and volume of campaign types can be included in the model along with customer or time variables. As we are interested in inference (on campaigns effect) whether than prediction, a parametric model should be used, such as Logistic Regression. Non paramatric models such as Random Forests or Neural Networks can also be used though the interpretation of campaigns value would be more difficult to derive from the model results.

A common pitfall is the usual issue of spurious correlations on one hand and the correct interpretation of coefficients in business terms.

An advantage if the possibility to evaluate the relevance of the model using common model validation methods to evaluate its predictive power (validation set \ AUC \pseudo R squared).

                                  B) Shapley Value

Theory

The Shapley Value is based on a Game Theory framework and is named after its creator, the Nobel Price Laureate Lloyd Shapley. Initially meant to calculate the marginal contribution of players in cooperative games, the model has received much attention in research and industry and has lately been applied to marketing issues. This model is typically used by Google Adords and other ad bidding vendors. Campaigns or marketing channels are in this model seen as compementary players looking forward to increasing a given KPI.
Contrarily to Logistic Regressions, it is a non-parametric model. Contrarily to Markov Chains, all results are built using existing journeys, and not simulated ones.

Channels are considered to enter the game sequentially under a certain joining order. Shapley value try to The Shapley value of channel i is the weighted sum of the marginal values that channel i adds to all possible coalitions that don’t contain channel i.
In other words, the main logic is to analyse the difference of gains when a channel i is added after a coalition Ck of k channels, k<=n. We then sum all the marginal contributions over all possible ordered combination Ck of all campaigns excluding i, with k<=n-1.

Subsets framework

A first an most usual way to compute the Shapley Vaue is to consider that when a channel enters coalition, its additionnal value is the same irrelevant of the order in which previous channels have appeared. In other words, journeys (A>B>C) and (B>A>C) trigger the same gains.
Shapley value is computed as the gains associated to adding a channel i to a subset of channels, weighted by the number of (ordered) sequences that the (unordered) subset represents, summed up on all possible subsets of the total set of campaigns where the channel i is not present.
The Shapley value of the channel ???????? is then:

where |S| is the number of campaigns of a coalition S and the sum extends over all subsets S that do not not contain channel j. ????(????)  is the value of the coalition S and ????(???? ∪ {????????})  the value of the coalition formed by adding ???????? to coalition S. ????(???? ∪ {????????}) − ????(????) is thus the marginal contribution of channel ???????? to the coalition S.

The formula can be rewritten and understood as:

This method is convenient when data on the gains of on all possible permutations of all unordered k subsets of the n campaigns are available. It is also more convenient if the order of campaigns prior to the introduction of a campaign is thought to have no impact.

Ordered sequences

Let us define ????((A>B)) as the value of the sequence A then B. What is we let ????((A>B)) be different from ????((B>A)) ?
This time we would need to sum over all possible permutation of the S campaigns present before  ???????? and the N-(S+1) campaigns after ????????. Doing so we will sum over all possible orderings (i.e all permutations of the n campaigns of the grand coalition containing all campaigns) and we can remove the permutation coefficient s!(p-s+1)!.

This method is convenient when the order of channels prior to and after the introduction of another channel is assumed to have an impact. It is also necessary to possess data for all possible permutations of all k subsets of the n campaigns, and not only on all (unordered) k-subsets of the n campaigns, k<=n. In other words, one must know the gains of A, B, C, A>B, B>A, etc. to compute the Shapley Value.

Differences between the two approaches

We simulate an ordered case where the value for each ordered sequence k for k<=3 is known. We compare it to the usual Shapley value calculated based on known gains of unordered subsets of campaigns. So as to compare relevant values, we have built the gains matrix so that the gains of a subset A, B i.e  ????({B,A}) is the average of the gains of ordered sequences made up with A and B (assuming the number of journeys where A>B equals the number of journeys where B>A, we have ????({B,A})=0.5( ????((A>B)) + ????((B>A)) ). We let the value of the grand coalition be different depending on the order of campaigns-keeping the constraints that it averages to the value used for the unordered case.

Note: mvA refers to the marginal value of A in a given sequence.
With traditionnal unordered coalitions:

With ordered sequences used to compute the marginal values:
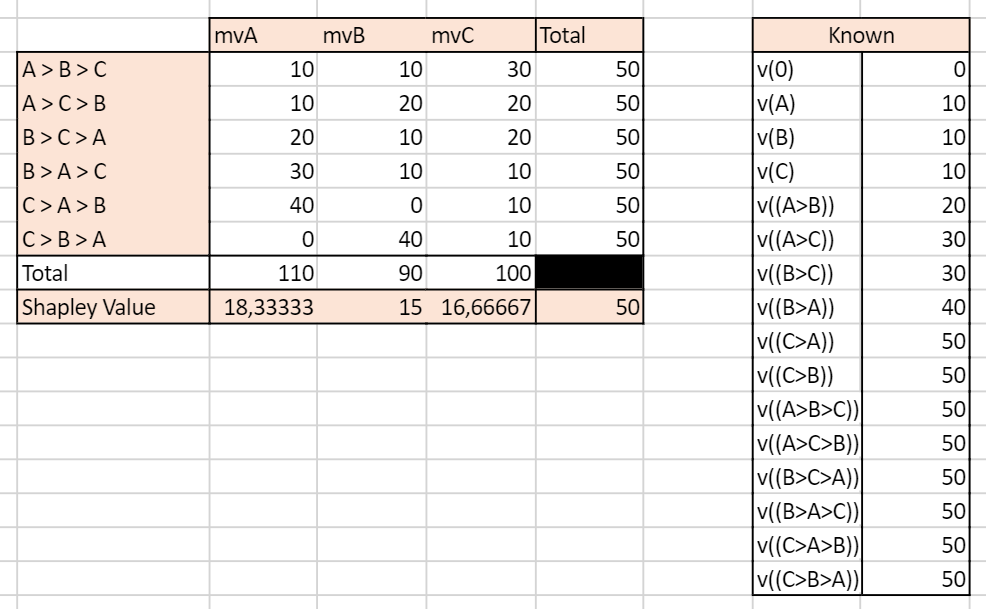
 

We can see that the two approaches yield very different results. In the unordered case, the Shapley Value campaign C is the highest, culminating at 20, while A and B have the same Shapley Value mvA=mvB=15. In the ordered case, campaign A has the highest Shapley Value and all campaigns have different Shapley Values.

This example illustrates the inherent differences between the set and sequences approach to Shapley values. Real life data is more likely to resemble the ordered case as conversion probabilities may for any given set of campaigns be influenced by the order through which the campaigns appear.

Advantages

Shapley value has become popular in allocation problems in cooperative games because it is the unique allocation which satisfies different axioms:

  • Efficiency: Shaple Values of all channels add up to the total gains (here, orders) observed.
  • Symmetry: if channels A and B bring the same contribution to any coalition of campaigns, then their Shapley Value i sthe same
  • Null player: if a channel brings no additionnal gains to all coalitions, then its Shapley Value is zero
  • Strong monotony: the Shapley Value of a player increases weakly if all its marginal contributions increase weakly

These properties make the Shapley Value close to what we intuitively define as a fair attribution.

Issues

  • The Shapley Value is based on combinatory mathematics, and the number of possible coalitions and ordered sequences becomes huge when the number of campaigns increases.
  • If unordered, the Shapley Value assumes the contribution of campaign A is the same if followed by campaign B or by C.
  • If ordered, the number of combinations for which data must be available and sufficient is huge.
  • Channels rarely present or present in long journeys will be played down.
  • Generally, gains are supposed to grow with the number of players in the game. However, it is plausible that in the marketing context a journey with a high number of channels will not necessarily bring more orders than a journey with less channels involved.

References:

R package: GameTheoryAllocation

Article:
Zhao & al, 2018 “Shapley Value Methods for Attribution Modeling in Online Advertising “
https://link.springer.com/content/pdf/10.1007/s13278-017-0480-z.pdf
Courses: https://www.lamsade.dauphine.fr/~airiau/Teaching/CoopGames/2011/coopgames-7%5b8up%5d.pdf
Blogs: https://towardsdatascience.com/one-feature-attribution-method-to-supposedly-rule-them-all-shapley-values-f3e04534983d

                                  B) Markov Chains

Markov Chains are used to model random processes, i.e events that occur in a sequential manner and in such a way that the probability to move to a certain state only depends on the past steps. The number of previous steps that are taken into account to model the transition probability is called the memory parameter of the sequence, and for the model to have a solution must be comprised between 0 and 4. A Markov Chain process is thus defined entirely by its Transition Matrix and its initial vector (i.e the starting point of the process).

Markov Chains are applied in many scientific fields. Typically, they are used in weather forecasting, with the sequence of Sunny and Rainy days following a Markov Process of memory parameter 0, so that for each given day the probability that the next day will be rainy or sunny only depends on the weather of the current day. Other applications can be found in sociology to understand the dynamics of social classes intergenerational reproduction. To get more both mathematical and applied illustration, I recommend the reading of this course.

In the marketing context, Markov Chains are an interesting way to model the conversion funnel. To go from the from the Markov Model to the Attribution logic, we calculate the Removal Effect of each channel, i.e the difference in conversions that happen if the channel is removed. Please read below for an introduction to the methodology.

The first step in a Markov Chains Attribution Model is to build the transition matrix that captures the transition probabilities between the campaigns accross existing customer journeys. This Matrix is to be read as a “From state A to state B” table, from the left to the right. A first difficulty is finding the right memory parameter to use. A large memory parameter would allow to take more into account interraction effects within the conversion funnel but would lead to increased computationnal time, a non-readable transition matrix, and be more sensitive to noisy data. Please note that this transition matrix provides useful information on the conversion funnel and on the relationships between campaigns and can be used as such as an analytical tool. I suggest the clear and easily R code which can be found here or here.

Here is an illustration of a Markov Chain with memory Parameter of 0: the probability to go to a certain campaign B in the next step only depend on the campaign we are currently at:
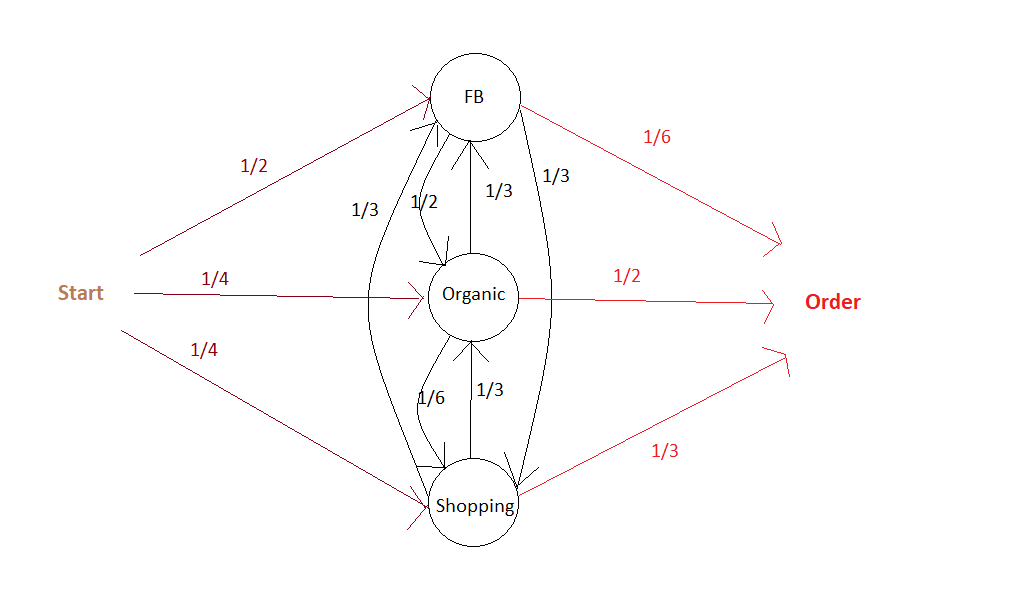
The associated Transition Matrix is then (with null probabilities left as Blank):
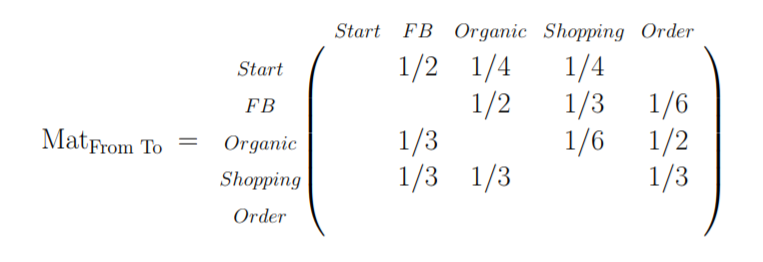
The second step is  to compute the actual responsibility of a channel in total conversions. As mentionned above, the main philosophy to do so is to calculate the Removal Effect of each channel, i.e the changes in the number of conversions when a channel is entirely removed. All customer journeys which went through this channel are settled out to be unsuccessful. This calculation is done by applying the transition matrix with and without the removed channels to an initial vector that contains the number of desired simulations.

Building on our current example, we can then settle an initial vector with the desired number of simulations, e.g 10 000:


It is possible at this stage to add a constraint on the maximum number of times the matrix is applied to the data, i.e on the maximal number of campaigns a simulated journey is allowed to have.

Advantages

  • The dynamic journey is taken into account, as well as the transition between two states. The funnel is not assumed to be linear.
  • It is possile to build a conversion graph that maps the customer journey provides valuable insights.
  • It is possible to evaluate partly the accuracy of the Attribution Model based on Markov Chains. It is for example possible to see how well the transition matrix help predict the future by analysing the number of correct predictions at any given step over all sequences.

Disadvantages

  • It can be somewhat difficult to set the memory parameter. Complementarity effects between channels are not well taken into account if the memory is low, but a parameter too high will lead to over-sensitivity to noise in the data and be difficult to implement if customer journeys tend to have a number of campaigns below this memory parameter.
  • Long journeys with different channels involved will be overweighted, as they will count many times in the Removal Effect.  For example, if there are n-1 channels in the customer journey, this journey will be considered as failure for the n-1 channel-RE. If the volume effects (i.e the impact of the overall number of channels in a journey, irrelevant from their type° are important then results may be biased.

References:

R package: ChannelAttribution

Git:

https://github.com/MatCyt/Markov-Chain/blob/master/README.md

Course:

https://www.ssc.wisc.edu/~jmontgom/markovchains.pdf

Article:

“Mapping the Customer Journey: A Graph-Based Framework for Online Attribution Modeling”; Anderl, Eva and Becker, Ingo and Wangenheim, Florian V. and Schumann, Jan Hendrik, 2014. Available at SSRN: https://ssrn.com/abstract=2343077 or http://dx.doi.org/10.2139/ssrn.2343077

“Media Exposure through the Funnel: A Model of Multi-Stage Attribution”, Abhishek & al, 2012

“Multichannel Marketing Attribution Using Markov Chains”, Kakalejčík, L., Bucko, J., Resende, P.A.A. and Ferencova, M. Journal of Applied Management and Investments, Vol. 7 No. 1, pp. 49-60.  2018

Blogs:

https://analyzecore.com/2016/08/03/attribution-model-r-part-1

https://analyzecore.com/2016/08/03/attribution-model-r-part-2

                          3.3 To go further: Tackling selection biases with Quasi-Experiments

Exposure to certain types of advertisement is usually highly correlated to non-observable variables. Differences in the behaviour of users exposed to different campaigns may thus only be driven by core differences in converison probabilities between groups whether than by the campaign effect. These potential selection effects may bias the results obtained using historical data.

Quasi-Experiments can help correct this selection effect while still using available observationnal data.  These methods recreate the settings on a randomized setting. The goal is to come as close as possible to the ideal of comparing two populations that are identical in all respects except for the advertising exposure. However, populations might still differ with respect to some unobserved characteristics.

Common quasi-experimental methods used for instance in Public Policy Evaluation are:

  • Discontinuity Regressions
  • Matching Methods, such as Exact Matching,  Propensity-score matching or k-nearest neighbourghs.

References:

Article:

“Towards a digital Attribution Model: Measuring the impact of display advertising on online consumer behaviour”, Anindya Ghose & al, MIS Quarterly Vol. 40 No. 4, pp. 1-XX, 2016

https://pdfs.semanticscholar.org/4fa6/1c53f281fa63a9f0617fbd794d54911a2f84.pdf

        4. First Steps towards a Practical Implementation

Identify key points of interests

  • Identify the nature of touchpoints available: is the data based on clicks? If so, is there a way to complement the data with A/B tests to measure the influence of ads without clicks (display, video) ? For example, what happens to sales when display campaign is removed? Analysing this multiplier effect would give the overall responsibility of display on sales, to be deduced from current attribution values given to click-based channels. More interestingly, what is the impact of the removal of display campaign on the occurences of click-based campaigns ? This would give us an idea of the impact of display ads on the exposure to each other campaigns, which would help correct the attribution values more precisely at the campaign level.
  • Define the KPI to track. From a pure Marketing perspective, looking at purchases may be sufficient, but from a financial perspective looking at profits, though a bit more difficult to compute, may drive more interesting results.
  • Define a customer journey. It may seem obvious, but the notion needs to be clarified at first. Would it be defined by a time limit? If so, which one? Does it end when a conversion is observed? For example, if a customer makes 2 purchases, would the campaigns he’s been exposed to before the first order still be accounted for in the second order? If so, with a time decay?
  • Define the research framework: are we interested only in customer journeys which have led to conversions or in all journeys? Keep in mind that successful customer journeys are a non-representative sample of customer journeys. Models built on the analysis of biased samples may be conservative. Take an extreme example: 80% of customers who see campaign A buy the product, VS 1% for campaign B. However, campaign B exposure is great and 100 Million people see it VS only 1M for campaign A. An Attribution Model based on successful journeys will give higher credit to campaign B which is an auguable conclusion. Taking into account costs per campaign (in the case where costs are calculated by clicks) may of course tackle this issue partly, as campaign A could then exhibit higher returns, but a serious fallacious reasonning is at stake here.

Analyse the typical customer journey    

  • Performing a duration analysis on the data may help you improve the definition of the customer journey to be used by your organization. After which days are converison probabilities null? Should we consider the effect of campaigns disappears after x days without orders? For example, if 99% of orders are placed in the 30 days following a first click, it might be interesting to define the customer journey as a 30 days time frame following the first oder.
  • Look at the distribution of the number of campaigns in a typical journey. If you choose to calculate the effect of campaigns interraction in your Attribution Model, it may indeed help you determine the maximum number of campaigns to be included in a combination. Indeed, you may not need to assess the impact of channel combinations with above than 4 different channels if 95% of orders are placed after less then 4 campaigns.
  • Transition matrixes: what if a campaign A systematically leads to a campaign B? What happens if we remove A or B? These insights would give clues to ask precise questions for a latter AB test, for example to find out if there is complementarity between channels A and B – (implying none should be removed) or mere substitution (implying one can be given up).
  • If conversion rates are available: it can be interesting to perform a survival analysis i.e to analyse the likelihood of conversion based on duration since first click. This could help us excluse potential outliers or individuals who have very low conversion probabilities.

Summary

Attribution is a complex topic which will probably never be definitively solved. Indeed, a main issue is the difficulty, or even impossibility, to evaluate precisely the accuracy of the attribution model that we’ve built. Attribution Models should be seen as a good yet always improvable approximation of the incremental values of campaigns, and be presented with their intrinsinc limits and biases.

Business Intelligence Organizations

I am often asked how the Business Intelligence department should be set up and how it should interact and collaborate with other departments. First and foremost: There is no magic recipe here, but every company must find the right organization for itself.

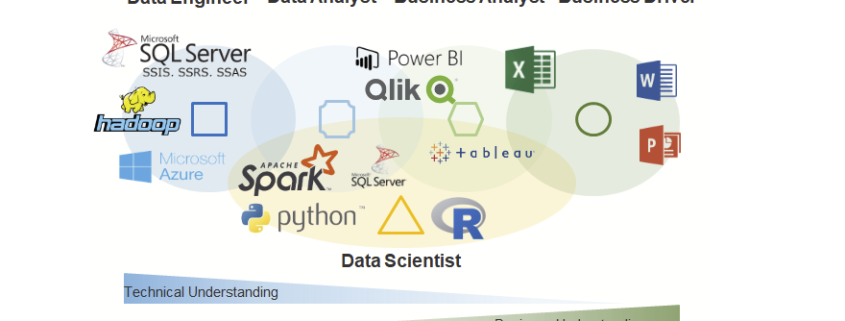
Before we can talk about organization of BI, we need to have a clear definition of roles for team members within a BI department.

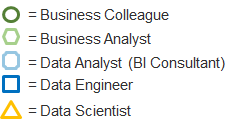
A Data Engineer (also Database Developer) uses databases to save structured, semi-structured and unstructured data. He or she is responsible for data cleaning, data availability, data models and also for the database performance. Furthermore, a good Data Engineer has at least basic knowledge about data security and data privacy. A Data Engineer uses SQL and NoSQL-Technologies.

A Data Analyst (also BI Analyst or BI Consultant) uses the data delivered by the Data Engineer to create or adjust data models and implementing business logic in those data models and BI dashboards. He or she needs to understand the needs of the business. This job requires good communication and consulting skills as well as good developing skills in SQL and BI Tools such like MS Power BI, Tableau or Qlik.

A Business Analyst (also Business Data Analyst) is a person form any business department who has basic knowledge in data analysis. He or she has good knowledge in MS Excel and at least basic knowledge in data analysis and BI Tools. A Business Analyst will not create data models in databases but uses existing data models to create dashboards or to adjust existing data analysis applications. Good Business Analyst have SQL Skills.

A Data Scientist is a Data Analyst with extended skills in statistics and machine learning. He or she can use very specific tools and analytical methods for finding pattern in unknow or big data (Data Mining) or to predict events based on pattern calculated by using historized data (Predictive Analytics). Data Scientists work mostly with Python or R programming.

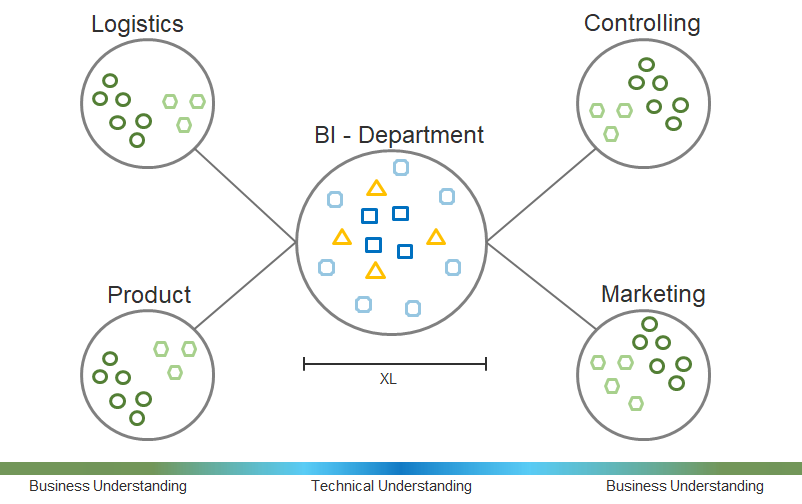
Organization Type 1 – Central Approach (Data Lab)

The first type of organization is the data lab approach. This organization form is easy to manage because it’s focused and therefore clear in terms of budgeting. The data delivery is done centrally by experts and their method and technology knowledge. Consequently, the quality expectation of data delivery and data analysis as well as the whole development process is highest here. Also the data governance is simple and the responsibilities clearly adjustable. Not to be underestimated is the aspect of recruiting, because new employees and qualified applicants like to join a central team of experts.

However, this form of organization requires that the company has the right working attitude, especially in the business intelligence department. A centralized business intelligence department acts as a shared service. Accordingly, customer-oriented thinking becomes a prerequisite for the company’s success – and customers here are the other departments that need access to the capacities of those centralized data experts. Communication boundaries must be overcome and ways of simple and effective communication must be found.

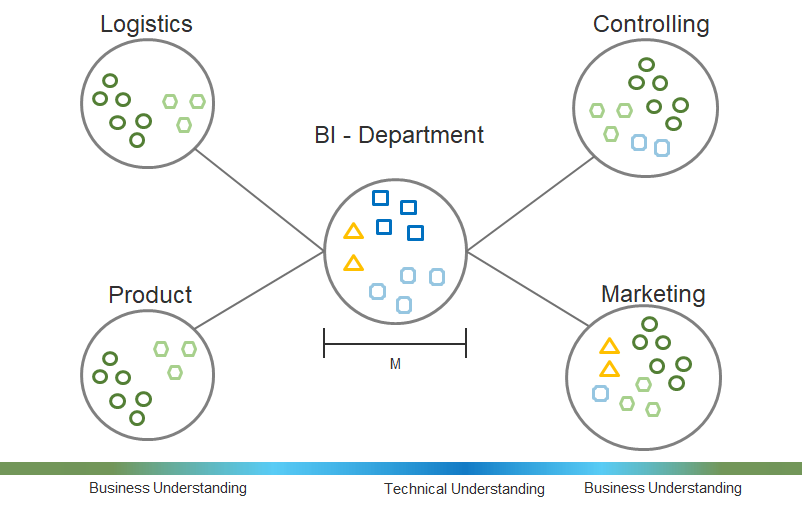
Organization Type 2 – Stakeholder Focus Approach

Other companies want to shift more responsibility for data governance, and especially data use and analytics, to those departments where data plays a key role right now. A central business intelligence department manages its own projects, which have a meaning for the entire company. The specialist departments, which have a special need for data analysis, have their own data experts who carry out critical projects for the specialist department. The central Business Intelligence department does not only provide the technical delivery of data, but also through methodical consulting. Although most of the responsibility lies with the Business Intelligence department, some other data-focused departments are at least co-responsible.

The advantage is obvious: There are special data experts who work deeper in the actual departments and feel more connected and responsible to them. The technical-business focus lies on pain points of the company.

However, this form of Ogranization also has decisive disadvantages: The danger of developing isolated solutions that are so special in some specific areas that they will not really work company-wide increases. Typically the company has to deal with asymmetrical growth of data analytics
know-how. Managing data governance is more complex and recruitment is becoming more difficult as the business intelligence department is weakened and smaller, and data professionals for other departments need to have more business focus, which means they are looking for more specialized profiles.

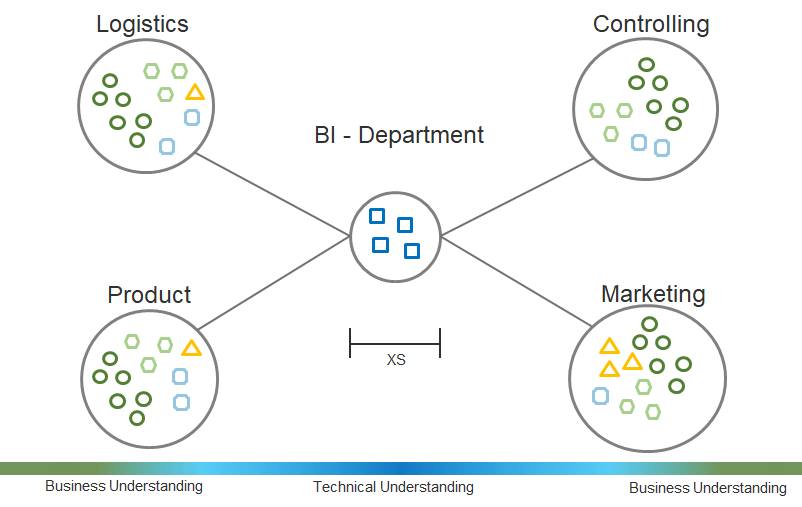
Organization Type 3 – Decentral Approach

Some companies are also taking a more extreme approach in the other direction. The Business Intelligence department now has only Data Engineers building and maintaining the data warehouse or data lake. As a result, the central department only provides data; it is used and analyzed in all other departments, specifically for the respective applications.

The advantage lies in the personal responsibility of the respective departments as „pain points“ of the company are in focus in belief that business departments know their problems and solutions better than any other department does. Highly specialized data experts can understand colleagues of their own department well and there is no no shared service mindset neccessary, except for the data delivery.

Of course, this organizational form has clear disadvantages since many isolated solutions are unavoidable and the development process of each data-driven solution will be inefficient. These insular solutions may work with luck for your own department, but not for the whole company. There is no one single source of truth. The recruiting process is more difficult as it requires more specialized data experts with more business background. We have to expect an asymmetrical growth of data analytics know-how and a difficult data governance.


Deep Learning and Human Intelligence – Part 2 of 2

Data dependency is one of the biggest problem of Deep Learning Architectures. This difficulty lies not so much in the algorithm of Deep Learning as in the invisible structure of the data itself.

This is part 2 of 2 of the Article Series: Deep Learning and Human Intelligence.

We saw that the process of discovering numbers was accompanied with many aspects of what are today basic ideas of Machine Learning. But let us go back, a little before that time, when humankind did not fully discovered the concept of numbers. How would a person, at such a time, perceive quantity and the count of things? Some structures are easily recognizable as patterns of objects, that is numbers, like one sun, 2 trees, 3 children, 4 clouds and so on. Sets of objects are much simpler to count if all the objects of the set are present. In such a case it is sufficient to keep a one-to-one relationship between two different set, without the need for numbers, to make a judgement of crucial importance. One could consider the case of two enemies that go to war and wish to know which has a larger army. It is enough to associate a small stone to every enemy soldier and do the same with his one soldier to be able to decide, depending if stones are left or not, if his army is larger or not, without ever needing to know the exact number soldier of any of the armies.

But also does things can be counted which are not directly visible, and do not allow a direct association with direct observable objects that can be seen, like stones. Would a person, at that time, be able to observe easily the 4-th day since today, 5 weeks from now, when even the concept of week is already composite? Counting in this case is only possible if numbers are already developed through direct observation, and we use something similar with stones in our mind, i.e. a cognitive association, a number. Only then, one can think of the concept of measuring at equidistant moments in time at all. This is the reason why such measurements where still cutting edge in the time of Galileo Galilei as we seen before. It is easily to assume that even in the time when humans started to count, such indirect concepts of numbers were not considered to be in relation with numbers. This implies that many concepts with which we are today accustomed to regard as a number, were considered as belonging to different groups, cluster which are not related. Such an hypothesis is not even that much farfetched. Evidence for such a time are still present in some languages, like Japanese.

When we think of numbers, we associate them with the Indo-Arabic numbers, but in Japanese numbers have no decimal structure and counting depends not only on the length of the set (which is usually considered as the number), but also on the objects that make up the set. In Japanese one can speak of meeting roku people, visiting muttsu cities and seeing ropa birds, but referring each time to the same number: six. Additional, many regular or irregular suffixes make the whole system quite complicated. The division of counting into so many clusters seems unnecessarily complicated today, but can easily be understood from a point of view where language and numbers still form and, the numbers, were not yet a uniform concept. What one can learn from this is that the lack of a unifying concept implies an overly complex dependence on data, which is the present case for Deep Learning and AI in general.

Although Deep Learning was a breakthrough in the development of Artificial Intelligence, the task such algorithms can perform were and remained very narrow. It may identify birds or cancer cells, but it will miss the song of the birds or the cry of the patient with cancer. When Watson, a Deep Learning Architecture played the famous Jeopardy game against two former Champions and won, it still made several simple mistakes, like going for the same wrong answer like the player before. If it could listen to the answer of the candidate, it could delete the top answer it had, and gibe the second which was the right one. With other words, Deep Learning Architecture are not multi-tasking and it is for this reason that some experts in AI are calling them intelligent idiots.

Imagine spending time learning to play a game for years and years, and then, when mastering it and wish to play a different game, to be unable to use any of the past experience (of gaming) for the new one and needing to learn everything from scratch. That could be quite depressing and would make life needlessly difficult. This is the reason why people involved in developing Deep Learning worked from early on in the development of multi-tasking Deep Learning Architectures. On the way a different method of using Deep Learning was discovered: transfer learning. Because the time it takes for a Deep Learning Architecture to learn is very long, transfer learning uses already learned Deep Learning Architectures but for slightly different task. It is similar to the use of past experiences in solving new problems, but, the advantage of transfer learning is, it allow the using of past experiences (what it already learned) which reduces dramatically the amount of new data needed in performing a new task. Still, transfer learning is far away from permitting Deep Learning Architectures to perform any kind of task learning only from one master data set.

The management of a unique master data set which includes all the needed data to enable human accuracy for any human activity, is not enough. One needs another ingredient, the so called cost function which translates, in this case, to the human brain. There are all our experiences and knowledge. How long does it takes to collect sufficient of both to handle a normal human life? How much to achieve our highest potential? If not a lifetime, at least decades. And this also applies to our job: as a IT-developer, a Data Scientist or a professor at the university. We will always have to learn new things, how to use them, and how to expand the limits of our perceptions. The vast amount of information that science has gathered over the last four centuries makes it impossible for any human being to become an expert in all of it. Thus, one has to specialized. After the university, anyone has to choose o subject which is appealing enough to study it for decades. Here is the first sign of what can be understood as data segmentation and dependency. Such improvements can come in various forms: an algorithm in the IT, a theorem in mathematics, a new way to look at particles in physics or a new method to scan for diseases in biology, and so on. But there is a price to pay for specialization: the inability to be an expert in another field or subfield. (Subfields induces limitation!)

Lets take the Deep Learning algorithm itself as an example. For IT and much of everyday life, this is a real breakthrough, but it lacks any scientific, that is mathematical, foundation. There are no theorems which proofs that it will find (converge, to use a mathematical term) the global optimum. This does not appear to be of any great consequences if it can be so efficient, except that, when adding new data and let the algorithm learn the same architecture again, there is no guaranty what so ever that it will be as good as the old model, or even better. On the contrary, it is as real as the efficiency of the first model, that chances are that the new model with the new data will perform worse than the old model, and one has to invest again time in finding a better model, or even a different architecture. On the other hand, with a mathematical proof of convergence, it would be always possible to know in what condition such a convergence can be achieved. In other words, without deep knowledge in mathematics, any proof of a consistent Deep Learning Algorithm is impossible.

Such a situation is true for any other corssover between fields. A mathematical genius will make a lousy biologist, a great chemist will make a average economist, and a top economist will be a poor physicist. Knowledge is difficult to transfer and this is true also for everyday experiences. We learn from very small to play a game like football, but are unable to use the reflexes to play basketball, or tennis better than a normal beginner. We learn a new language after years and years of practice, but are unable to use the way we learned to learn faster other languages. We are trapped within the knowledge we developed from the data we used. It is for this reason why we cannot transfer the knowledge a mathematician has developed over decades to use it in biology or psychology, even if the knowledge is very advanced. Instead of thinking in knowledge, we thing in data. This is similar to the people which were unaware of numbers, and used sets (data) to work with them. Numbers could be very difficult to transmit from one person to another in former times.

Only think on all the great achievements that our society managed, like relativity, quantum mechanics, DNA, machines, etc. Such discoveries are the essences of human knowledge and took millennia to form and centuries to crystalize. Still, all this knowledge is captive in the data, in the special frame in which it was discovered and never had the chance to escape. Imagine the possibility to use thoughts/causalities like the one in relativity or quantum mechanics in biology, or history, or of the concept of DNA in mathematics or art. Imagine a music composition where the law of the notes allows a “tunnel effect” like in quantum mechanics, lower notes to warp the music scales like in relativity and/or to twist two music scale in a helix-like play. How many way to experience life awaits us. Or think of the knowledge hidden in mathematics which could help develop new medicine, but can not be transmitted.

Another example of the connection we experience between knowledge and the data through which we obtain it, are children. They are classical example when it come determine if one is up to explain to them something. Take as an explain something simple they can observe often, like lightning and thunder. Normal concepts like particles, charge, waves, propagation, medium of propagation, etc. become so complicated to expose by other means then the one through which they were discovered, that it becomes nearly impossible to explain to children how it works and that they do not need to fear it. Still, one can use analogy (i.e., transfer) to enable an explanation. Instead of particles, one can use balls, for charge one can use hardness, waves can be shown with strings by keeping one end fix and waving the other, propagation is the movement of the waves from one end of the string to the other end, medium of propagation is the difference between walking in air and water, etc. Although difficult, analogies can be found which enables us to explain even to children how complex phenomena works.

The same is true also for Deep Learning. The model, the knowledge it can extract from the data can be expressed only by such data alone. There is no transformation of the knowledge from one type of data to another. If such a transformation would exists, then Deep Learning would be able to learn any human task by only a set of data, a master data set. Without such a master data set and a corresponding cost function it will be nearly impossible to develop AI that mimics human behavior. With other words, without the realization how our mind works, and how to crystalize by this the data needed, AI will still need to look at all the activities separately. It also implies that AI are restricted to the human understanding of reality and themselves. Only with such a characteristic of a living being, thus also AI, can development of its on occur.

Interview – The Importance of Machine Learning for the Data Driven Business

To become more data-driven, organizations must mature their analytics and automate more of their decision making processes for innovation and differentiation. Data science seems like the right approach, yet is a new and fast moving field that seems to have as many dead ends as it has high ways to value. Cloudera Fast Forward Labs, led by Hilary Mason, shows companies the way.

Alice Albrecht is a research engineer at Cloudera Fast Forward Labs.  She spends her days researching the latest and greatest in machine learning and artificial intelligence and bringing that knowledge to working prototypes and delivering concrete advice for clients.  Prior to joining Fast Forward Labs, Alice worked in both finance and technology companies as a practicing data scientist, data science leader, and – most recently – a data product manager.  In addition to teaching machines to do cool things, Alice is passionate about mentoring and helping others grow in their careers.  Alice holds a PhD from Yale in cognitive neuroscience where she studied how humans summarize sensory information from the world around them and the neural substrates that underlie those summaries.
Read this article in German:
“Interview – Die Bedeutung von Machine Learning für das Data Driven Business“

Data Science Blog: Ms. Albrecht, you are a well-known keynote speaker for data science and artificial intelligence. While data science has arrived business already, deep learning seems to be the new trend. Is artificial intelligence for business already normal business or is it an overrated hype?

I’d say it isn’t either of those two options.  Data science is now widely adopted but companies still struggle to integrate this new discipline into their existing businesses.  As for deep learning, it really depends on the company that’s looking into using this technique.  I wouldn’t say that deep learning is by any means part of business as usual- nor should it be.  It’s a tool like any other and building a capacity for using a tool without clearly defined business needs is a recipe for disaster.

Data Science Blog: Just to make sure what we are talking about: What are the differences and overlaps between data analytics, data science, machine learning, deep learning and artificial intelligence?

Here at Cloudera Fast Forward Labs, we like to think of data analytics as collecting data and counting things (mostly for quick charts and reports).  Data science solves business problems by counting cleverly and predicting things with the data that’s collected.  Machine learning is about solving problems with new kinds of feedback loops that improve with more data.  Deep learning is a particular type of machine learning and is not itself a separate concept or type of tool.  Artificial intelligence taps into something more complicated than what we’re seeing today – it’s much broader than training machines to repetitively do very specialized tasks or solve very narrow problems.

Data Science Blog: And how can we add the context to big data?

From a theoretical perspective, data science has been around for decades. The building blocks for modern day machine learning, deep learning and artificial intelligence are based on mathematical theorems  that go back to the 1940’s and 1950’s. The challenge was that at the time, compute power and data storage capacity were simply too expensive for the approaches to be implemented. Today that’s all changed.. Not only has the cost of data storage dropped considerably, open source technology like Apache Hadoop has made it possible to store any volume of data at costs approaching zero. Compute power, even highly specialised chip architectures, are now also available on demand and only for the time organisations need them through public and private cloud solutions. The decreased cost of both data storage and compute power, together with a growing list of tools and resources readily available via the open source community allows companies of any size to benefit from data (no matter that size of that data).

Data Science Blog: What are the challenges for organizations in getting started with data science?

I see two big challenges when getting started with data science.  One is ensuring that you have organizational alignment around exactly what type of work data scientists will deliver (and timing for those projects).  The second hurdle is around ensuring that you have the right data in place before you start hiring data scientists. This can be tricky if you don’t have in-house expertise in this area, so sometimes it’s better to hire a data engineer or a data strategist (or director of data science) before you ever get started building out a data science team.

Data Science Blog: There are many discussions about how to build a data-driven business. Is it just about using data science to get a better understanding of customer behavior?

No, being data driven doesn’t just mean better understanding your customers (though that is one way that data science can help in an organization).  Aside from building an organization that relies on data and analytics to help them make decisions (about customer behavior or otherwise), being a data-driven business means that data is powering your core products.

Data Science Blog: The number of technologies, tools and frameworks is increasing. For organizations this also means increasing complexity. Do companies need to stay always up-to-date or could it be an advice to wait and imitate pioneers later?

While it’s not critical (or advisable) for organizations to adopt every new advancement that comes along, it is critical for them to stay abreast of emerging frameworks.  If a business waits to see what others are doing, and therefore don’t invest in understanding how new advancements can affect their particular business, they’ve likely already missed the boat.

Data Science Blog: Global players have big budgets just for doing research and setting up data labs. Middle-sized companies need to see the break even point soon. How can we accelerate the value generation of data science?

Having a team that is highly focused on a specific set of projects that are well-scoped and aligned to the business makes all the difference.  Data science and machine learning don’t have to sacrifice doing research and being innovative in order to produce value.  The biggest difference is that smaller teams will have to be more aware of how their choice of project fits into emerging frameworks and their particular acute and near term business needs.

Data Science Blog: How does Cloudera Fast Forward Labs help other organizations to accelerate their start with machine learning?

We advise organizations, based on their particular needs, on what the latest advancements are in machine learning and data science, how to build and structure their data teams to develop the capabilities they need to meet their goals, and how to quickly implement custom forward-looking solutions using their own data and in-house expertise.

Data Science Blog: Finally, a question for our younger readers who are looking for a career as a data expert: What makes a good data scientist? Do you like to work with introverted coding nerds or the data loving business experts?

A good data scientists should be deeply curious and have a love for the ways in which data can lead to new discoveries and power the next generation of products.  We expect the people who thrive in this field to come from a variety of backgrounds and experiences.

Interview – Python as productive data science environment

Miroslav Šedivý is a Senior Software Architect at UBIMET GmbH, using Python to make the sun shine and the wind blow. He is an enthusiast of both human and programming languages and found Python as his language of choice to setup very productive environments. Mr. Šedivý was born in Czechoslovakia, studied in France and is now living in Germany. Furthermore, he helps in the organization of the events PyCon.DE and Polyglot Gathering.
On 26th June 2018 he will explain at the Python@DWX conference why “Lifelong Text Hackers Use Vim and Python”. Insert the promotion code PY18science to unlock your 10% discount on all tickets. More info and tickets on python-con.com.


Data Science Blog: Mr. Šedivý, how did you find the way to Python as your favorite programming language?

Apart from traditional languages taught at school (Basic, Pascal, C, Java), some twenty years ago I learned Perl to hack a dynamic web site and used it to automate my daily tasks. Later I used it professionally for scientific calculations in the production. This was later replaced by Python, its newer versions and more advanced libraries. Nowadays Python has almost completely replaced Perl as my principal language and I use Perl just to hack some command line filters and to impress colleagues.

Data Science Blog: Python is one of the most popular programming language for data scientists. This is remarkable as it is originally not designed for doing data science with it. What made it a competitor to languages like R or Julia?

Python is the most powerful programming language that is still legible. This appeals to data scientists who can enter each line interactively, and immediately see what happens, because each line actually does something. They can inspect their data easily and build automating systems to process their data transparently.

Data Science Blog: Is there anything you could do better with another programming language?

Sometimes I’m playing with some functional languages that would allow me to write code that is easier to test and parallelize.

Data Science Blog: Which libraries are the most important ones for your daily business?

The whole Pandas ecosystem with Numpy and Scipy. Matplotlib for plots, PyTables and Psycopg2 for storage. I’m also importing a few async libs for webservices and similar network-based software.

I also enjoy discovering the world of Unicode and Timezones – both of them are the spots where the programmers absolutely have to obey the chaotic reality of the outside world.

Data Science Blog: Which editor do you use? And how to set it up as a productive environment?

I tried several editors and IDEs, but always came back to Vi or Vim. This is an extremely powerful editor that is around since over forty years, which was probably before most of today’s active developers learned to type. I’m using it for all text editing tasks, which I’m actually going to show in my talk at DWX [Lifelong Text Hackers Use Vim and Python]. Steep learning curve is not an argument against a tool you can grok during your entire career.

Data Science Blog: In your opinion: For all developers and data scientists, who are used to Java, Scala, R oder Perl, is Python easy to learn? Could it be too late to switch for somebody?

Python is a great general language that can be learned rapidly to a usable level. It’s different from the aforementioned languages. I remember my switching process from Perl to Python over ten years ago with a book “Perl to Python Migration”, which forced me to switch my way of thinking. From the question “Why do I have to import ‘re’ for regular expressions if Perl uses them natively?” to “Actually, I can solve this problem without regular expressions.”.

Applying Data Science Techniques in Python to Evaluate Ionospheric Perturbations from Earthquakes

Multi-GNSS (Galileo, GPS, and GLONASS) Vertical Total Electron Content Estimates: Applying Data Science techniques in Python to Evaluate Ionospheric Perturbations from Earthquakes

1 Introduction

Today, Global Navigation Satellite System (GNSS) observations are routinely used to study the physical processes that occur within the Earth’s upper atmosphere. Due to the experienced satellite signal propagation effects the total electron content (TEC) in the ionosphere can be estimated and the derived Global Ionosphere Maps (GIMs) provide an important contribution to monitoring space weather. While large TEC variations are mainly associated with solar activity, small ionospheric perturbations can also be induced by physical processes such as acoustic, gravity and Rayleigh waves, often generated by large earthquakes.

In this study Ionospheric perturbations caused by four earthquake events have been observed and are subsequently used as case studies in order to validate an in-house software developed using the Python programming language. The Python libraries primarily utlised are Pandas, Scikit-Learn, Matplotlib, SciPy, NumPy, Basemap, and ObsPy. A combination of Machine Learning and Data Analysis techniques have been applied. This in-house software can parse both receiver independent exchange format (RINEX) versions 2 and 3 raw data, with particular emphasis on multi-GNSS observables from GPS, GLONASS and Galileo. BDS (BeiDou) compatibility is to be added in the near future.

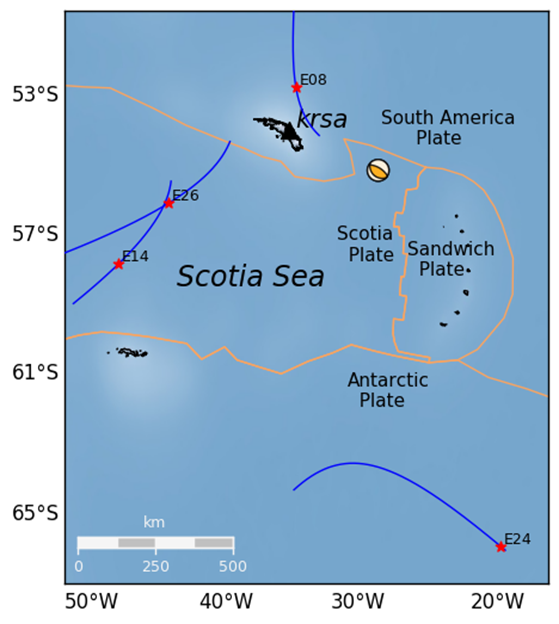
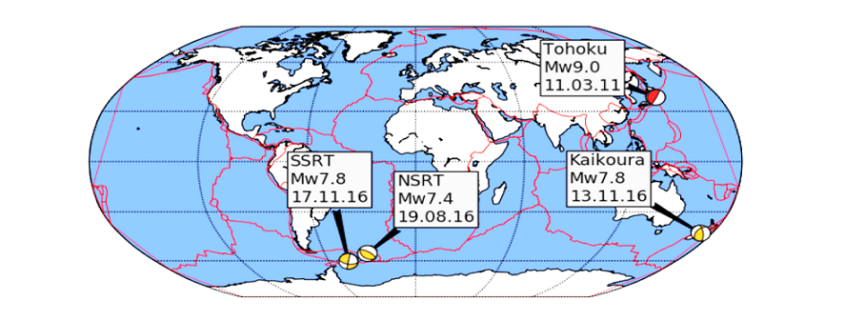
Several case studies focus on four recent earthquakes measuring above a moment magnitude (MW) of 7.0 and include: the 11 March 2011 MW 9.1 Tohoku, Japan, earthquake that also generated a tsunami; the 17 November 2013 MW 7.8 South Scotia Ridge Transform (SSRT), Scotia Sea earthquake; the 19 August 2016 MW 7.4 North Scotia Ridge Transform (NSRT) earthquake; and the 13 November 2016 MW 7.8 Kaikoura, New Zealand, earthquake.

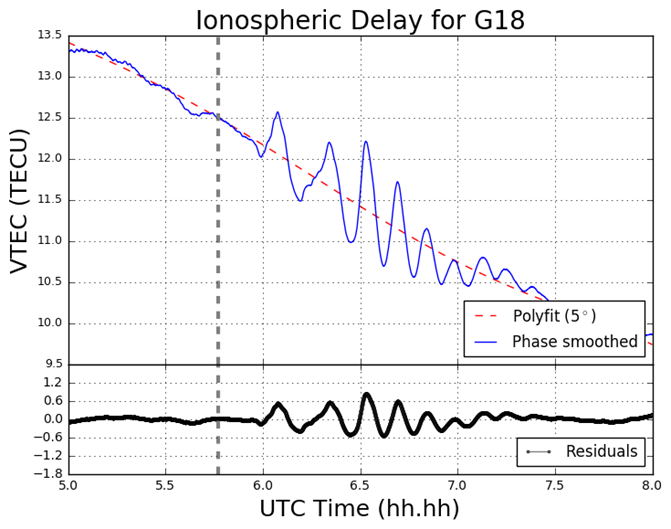
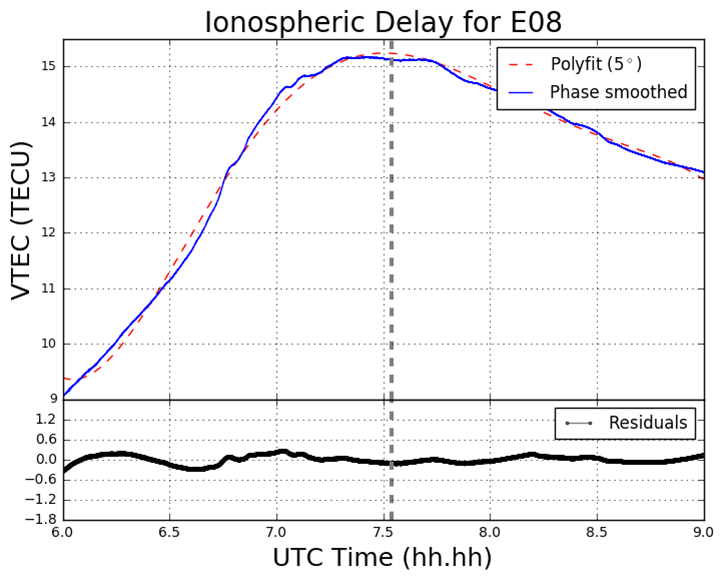
Ionospheric disturbances generated by all four earthquakes have been observed by looking at the estimated vertical TEC (VTEC) and residual VTEC values. The results generated from these case studies are similar to those of published studies and validate the integrity of the in-house software.

2 Data Cleaning and Data Processing Methodology

Determining the absolute VTEC values are useful in order to understand the background ionospheric conditions when looking at the TEC perturbations, however small-scale variations in electron density are of primary interest. Quality checking processed GNSS data, applying carrier phase leveling to the measurements, and comparing the TEC perturbations with a polynomial fit creating residual plots are discussed in this section.

Time delay and phase advance observables can be measured from dual-frequency GNSS receivers to produce TEC data. Using data retrieved from the Center of Orbit Determination in Europe (CODE) site (ftp://ftp.unibe.ch/aiub/CODE), the differential code biases are subtracted from the ionospheric observables.

2.1 Determining VTEC: Thin Shell Mapping Function

The ionospheric shell height, H, used in ionosphere modeling has been open to debate for many years and typically ranges from 300 – 400 km, which corresponds to the maximum electron density within the ionosphere. The mapping function compensates for the increased path length traversed by the signal within the ionosphere. Figure 1 demonstrates the impact of varying the IPP height on the TEC values.

Figure 1 Impact on TEC values from varying IPP heights. The height of the thin shell, H, is increased in 50km increments from 300 to 500 km.

2.2 Phase Smoothing

For dual-frequency GNSS users TEC values can be retrieved with the use of dual-frequency measurements by applying calculations. Calculation of TEC for pseudorange measurements in practice produces a noisy outcome and so the relative phase delay between two carrier frequencies – which produces a more precise representation of TEC fluctuations – is preferred. To circumvent the effect of pseudorange noise on TEC data, GNSS pseudorange measurements can be smoothed by carrier phase measurements, with the use of the carrier phase smoothing technique, which is often referred to as carrier phase leveling.

Figure 2 Phase smoothed code differential delay

2.3 Residual Determination

For the purpose of this study the monitoring of small-scale variations in ionospheric electron density from the ionospheric observables are of particular interest. Longer period variations can be associated with diurnal alterations, and changes in the receiver- satellite elevation angles. In order to remove these longer period variations in the TEC time series as well as to monitor more closely the small-scale variations in ionospheric electron density, a higher-order polynomial is fitted to the TEC time series. This higher-order polynomial fit is then subtracted from the observed TEC values resulting in the residuals. The variation of TEC due to the TID perturbation are thus represented by the residuals. For this report the polynomial order applied was typically greater than 4, and was chosen to emulate the nature of the arc for that particular time series. The order number selected is dependent on the nature of arcs displayed upon calculating the VTEC values after an initial inspection of the VTEC plots.

3 Results

3.1 Tohoku Earthquake

For this particular report, the sampled data focused on what was retrieved from the IGS station, MIZU, located at Mizusawa, Japan. The MIZU site is 39N 08′ 06.61″ and 141E 07′ 58.18″. The location of the data collection site, MIZU, and the earthquake epicenter can be seen in Figure 3.

Figure 3 MIZU IGS station and Tohoku earthquake epicenter [generated using the Python library, Basemap]

Figure 4 displays the ionospheric delay in terms of vertical TEC (VTEC), in units of TECU (1 TECU = 1016 el m-2). The plot is split into two smaller subplots, the upper section displaying the ionospheric delay (VTEC) in units of TECU, the lower displaying the residuals. The vertical grey-dashed lined corresponds to the epoch of the earthquake at 05:46:23 UT (2:46:23 PM local time) on March 11 2011. In the upper section of the plot, the blue line corresponds to the absolute VTEC value calculated from the observations, in this case L1 and L2 on GPS, whereby the carrier phase leveling technique was applied to the data set. The VTEC values are mapped from the STEC values which are calculated from the LOS between MIZU and the GPS satellite PRN18 (on Figure 4 denoted G18). For this particular data set as seen in Figure 4, a polynomial fit of  five degrees was applied, which corresponds to the red-dashed line. As an alternative to polynomial fitting, band-pass filtering can be employed when TEC perturbations are desired. However for the scope of this report polynomial fitting to the time series of TEC data was the only method used. In the lower section of Figure 4 the residuals are plotted. The residuals are simply the phase smoothed delay values (the blue line) minus the polynomial fit line (the red-dashed line). All ionosphere delay plots follow the same layout pattern and all time data is represented in UT (UT = GPS – 15 leap seconds, whereby 15 leap seconds correspond to the amount of leap seconds at the time of the seismic event). The time series shown for the ionosphere delay plots are given in terms of decimal of the hour, so that the format follows hh.hh.

Figure 4 VTEC and residual plot for G18 at MIZU on March 11 2011

3.2 South Georgia Earthquake

In the South Georgia Island region located in the North Scotia Ridge Transform (NSRT) plate boundary between the South American and Scotia plates on 19 August 2016, a magnitude of 7.4 MW earthquake struck at 7:32:22 UT. This subsection analyses the data retrieved from KEPA and KRSA. As well as computing the GPS and GLONASS TEC values, four Galileo satellites (E08, E14, E26, E28) are also analysed. Figure 5 demonstrates the TEC perturbations as computed for the Galileo L1 and L5 carrier frequencies.

Figure 5 VTEC and residual plots at KRSA on 19 August 2016. The plots are from the perspective of the GNSS receiver at KRSA, for four Galileo satellites (a) E08; (b) E14; (c) E24; (d) E26. The y-axes and x-axes in all plots do not conform with one another but are adjusted to fit the data. The y-axes for the residual section of each plot is consistent with one another.

Figure 6 Geometry of the Galileo (E08, E14, E24 and E26) satellites’ projected ground track whereby the IPP is set to 300km altitude. The orange lines correspond to tectonic plate boundaries.

4 Conclusion

The proximity of the MIZU site and magnitude of the Tohoku event has provided a remarkable – albeit a poignant – opportunity to analyse the ocean-ionospheric coupling aftermath of a deep submarine seismic event. The Tohoku event has also enabled the observation of the origin and nature of the TIDs generated by both a major earthquake and tsunami in close proximity to the epicenter. Further, the Python software developed is more than capable of providing this functionality, by drawing on its mathematical packages, such as NumPy, Pandas, SciPy, and Matplotlib, as well as employing the cartographic toolkit provided from the Basemap package, and finally by utilizing the focal mechanism generation library, Obspy.

Pre-seismic cursors have been investigated in the past and strongly advocated in particular by Kosuke Heki. The topic of pre-seismic ionospheric disturbances remains somewhat controversial. A potential future study area could be the utilization of the Python program – along with algorithmic amendments – to verify the existence of this phenomenon. Such work would heavily involve the use of Scikit-Learn in order to ascertain the existence of any pre-cursors.

Finally, the code developed is still retained privately and as of yet not launched to any particular platform, such as GitHub. More detailed information on this report can be obtained here:

Download as PDF

Process Analytics – Data Analysis for Process Audit & Improvement

Process Mining: Innovative data analysis for process optimization and audit

Step-by-Step: New ways to detect compliance violations with Process Analytics

In the course of the advancing digitization, an enormous upheaval of everyday work is currently taking place to ensure the complete recording of all steps in IT systems. In addition, companies are increasingly confronted with increasingly demanding regulatory requirements on their IT systems.


Read this article in German:
“Process Mining: Innovative Analyse von Datenspuren für Audit und Forensik “


The unstoppable trend towards a connected world will further increase the possibilities of process transparency, but many processes in the company area are already covered by one or more IT systems. Each employee, as well as any automated process, leaves many data traces in IT backend systems, from which processes can be replicated retroactively or in real time. These include both obvious processes, such as the entry of a recorded purchase order or invoice, as well as partially hidden processes, such as the modification of certain entries or deletion of these business objects.

1 Understanding Process Analytics

Process Analytics is a data-driven methodology of the actual process analysis, which originates in forensics. In the wake of the increasing importance of computer crime, it became necessary to identify and analyze the data traces that potential criminals left behind in IT systems in order to reconstruct the event as much as possible.

With the trend towards Big Data Analytics, Process Analytics has not only received new data bases, but has also been further developed as an analytical method. In addition, the visualization enables the analyst or the report recipient to have a deeper understanding of even more complex business processes.

While conventional process analysis primarily involves employee interviews and monitoring of the employees at the desk in order to determine actual processes, Process Analytics is a leading method, which is purely fact-based and thus objectively approaching the processes. It is not the employees who are asked, but the IT systems, which not only store all the business objects recorded in a table-oriented manner, but also all process activities. Every IT system for enterprise purposes log all relevant activities of the whole business process, in the background and invisible to the users, such as orders, invoices or customer orders, with a time stamp.

2 The right choice of the processes to analyze

Today almost every company works with at least one ERP system. As other systems are often used, it is clear which processes can not be analyzed: Those processes, which are still carried out exclusively on paper and in the minds of the employees, which are typical decision-making processes at the strategic level and not logged in IT systems.

Operational processes, however, are generally recorded almost seamlessly in IT systems. Furthermore, almost all operational decisions are recorded by status flags in datasets.

The operational processes, which can be reconstructed and analyzed with Process Mining very well and which are of equal interest from the point of view of compliance, include for example:

– Procurement

– Logistics / Transport

– Sales / Ordering

– Warranty / Claim Management

– Human Resource Management

Process Analytics enables the greatest possible transparency across all business processes, regardless of the sector and the department. Typical case IDs are, for example, sales order number, procurement order number, customer or material numbers.

3 Selection of relevant IT systems

In principle, every IT system used in the company should be examined with regard to the relevance for the process to be analyzed. As a rule, only the ERP system (SAP ERP or others) is relevant for the analysis of the purchasing processes. However, for other process areas there might be other IT systems interesting too, for example separate accounting systems, a CRM or a MES system, which must then also be included.

Occasionally, external data should also be integrated if they provide important process information from externally stored data sources – for example, data from logistics partners.

4 Data Preparation

Before the start of the data-driven process analysis, the data directly or indirectly indicating process activities must be identified, extracted and processed in the data sources. The data are stored in database tables and server logs and are collected via a data warehousing procedure and converted into a process protocol or – also called – event log.

The event log is usually a very large and wide table which, in addition to the actual process activities, also contains parameters which can be used to filter cases and activities. The benefit of this filter option is, for example, to show only process flows where special product groups, prices, quantities, volumes, departments or employee groups are involved.

5 Analysis Execution

The actual inspection is done visually and thus intuitively with an interactive process flow diagram, which represents the actual processes as they could be extracted from the IT systems. The event log generated by the data preparation is loaded into a data visualization software (e.g. Celonis PM Software), which displays this log by using the case IDs and time stamps and transforms this information in a graphical process network. The process flows are therefore not modeled by human “process thinkers”, as is the case with the target processes, but show the real process flows given by the IT systems. Process Mining means, that our enterprise databases “talk” about their view of the process.

The process flows are visualized and statistically evaluated so that concrete statements can be made about the process performance and risk estimations relevant to compliance.

6 Deviation from target processes

The possibility of intuitive filtering of the process presentation also enables an analysis of all deviation of our real process from the desired target process sequences.

The deviation of the actual processes from the target processes is usually underestimated even by IT-affine managers – with Process Analytics all deviations and the general process complexity can now be investigated.

6 Detection of process control violations

The implementation of process controls is an integral part of a professional internal control system (ICS), but the actual observance of these controls is often not proven. Process Analytics allows circumventing the dual control principle or the detection of functional separation conflicts. In addition, the deliberate removal of internal control mechanisms by executives or the incorrect configuration of the IT systems are clearly visible.

7 Detection of previously unknown behavioral patterns

After checking compliance with existing controls, Process Analytics continues to be used to recognize previously unknown patterns in process networks, which point to risks or even concrete fraud cases and are not detected by any control due to their previously unknown nature. In particular, the complexity of everyday process interlacing, which is often underestimated as already mentioned, only reveals fraud scenarios that would previously not have been conceivable.

8 Reporting – also possible in real time

As a highly effective audit analysis, Process Analytics is already an iterative test at intervals of three to twelve months. After the initial implementation, compliance violations, weak or even ineffective controls, and even cases of fraud, are detected reliably. The findings can be used in the aftermath to stop the weaknesses. A further implementation of the analysis after a waiting period makes it possible to assess the effectiveness of the measures taken.

In some application scenarios, the seamless integration of the process analysis with the visual dashboard to the IT system landscape is recommended so that processes can be monitored in near real-time. This connection can also be supplemented by notification systems, so that decision makers and auditors are automatically informed about the latest process bottlenecks or violations via SMS or e-mail.

Fazit

Process Analytics is, in the course of the digitalization, the highly effective methodology from the area of ​​Big Data Analysis for detecting compliance-relevant events throughout the company and also providing visual support for forensic data analysis. Since this is a method, and not a software, an expansion of the IT system landscape, especially for entry, is not absolutely necessary, but can be carried out by internal or external employees at regular intervals.

My Desk for Data Science

In my last post I anounced a blog parade about what a data scientist’s workplace might look like.

Here are some photos of my desk and my answers to the questions:

How many monitors do you use (or wish to have)?

I am mostly working at my desk in my office with a tower PC and three monitors.
I definitely need at least three monitors to work productively as a data scientist. Who does not know this: On the left monitor the data model is displayed, on the right monitor the data mapping and in the middle I do my work: programming the analysis scripts.

What hardware do you use? Apple? Dell? Lenovo? Others?

I am note an Apple guy. When I need to work mobile, I like to use ThinkPad notebooks. The ThinkPads are (in my experience) very robust and are therefore particularly good for mobile work. Besides, those notebooks look conservative and so I’m not sad if there comes a scratch on the notebook. However, I do not solve particularly challenging analysis tasks on a notebook, because I need my monitors for that.

Which OS do you use (or prefer)? MacOS, Linux, Windows? Virtual Machines?

As a data scientist, I have to be able to communicate well with my clients and they usually use Microsoft Windows as their operating system. I also use Windows as my main operating system. Of course, all our servers run on Linux Debian, but most of my tasks are done directly on Windows.
For some notebooks, I have set up a dual boot, because sometimes I need to start native Linux, for all other cases I work with virtual machines (Linux Ubuntu or Linux Mint).

What are your favorite databases, programming languages and tools?

I prefer the Microsoft SQL Server (T-SQL), C# and Python (pandas, numpy, scikit-learn). This is my world. But my customers are kings, therefore I am working with Postgre SQL, MongoDB, Neo4J, Tableau, Qlik Sense, Celonis and a lot more. I like to get used to new tools and technologies again and again. This is one of the benefits of being a data scientist.

Which data dou you analyze on your local hardware? Which in server clusters or clouds?

There have been few cases yet, where I analyzed really big data. In cases of analyzing big data we use horizontally scalable systems like Hadoop and Spark. But we also have customers analyzing middle-sized data (more than 10 TB but less than 100 TB) on one big server which is vertically scalable. Most of my customers just want to gather data to answer questions on not so big amounts of data. Everything less than 10TB we can do on a highend workstation.

If you use clouds, do you prefer Azure, AWS, Google oder others?

Microsoft Azure! I am used to tools provided by Microsoft and I think Azure is a well preconfigured cloud solution.

Where do you make your notes/memos/sketches. On paper or digital?

My calender is managed digital, because I just need to know everywhere what appointments I have. But my I prefer to wirte down my thoughts on paper and that´s why I have several paper-notebooks.

Now it is your turn: Join our Blog Parade!

So what does your workplace look like? Show your desk on your blog until 31/12/2017 and we will show a short introduction of your post here on the Data Science Blog!