Simplify Vendor Onboarding with Automated Data Integration

Vendor onboarding is a key business process that involves collecting and processing large data volumes from one or multiple vendors. Business users need vendor information in a standardized format to use it for subsequent data processes. However, consolidating and standardizing data for each new vendor requires IT teams to write code for custom integration flows, which can be a time-consuming and challenging task.

In this blog post, we will talk about automated vendor onboarding and how it is far more efficient and quicker than manually updating integration flows.

Problems with Manual Integration for Vendor Onboarding

During the onboarding process, vendor data needs to be extracted, validated, standardized, transformed, and loaded into the target system for further processing. An integration task like this involves coding, updating, and debugging manual ETL pipelines that can take days and even weeks on end.

Every time a vendor comes on board, this process is repeated and executed to load the information for that vendor into the unified business system. Not just this, but because vendor data is often received from disparate sources in a variety of formats (CSV, Text, Excel), these ETL pipelines frequently break and require manual fixes.

All this effort is not suitable, particularly for large-scale businesses that onboard hundreds of vendors each month. Luckily, there is a faster alternative available that involves no code-writing.

Automated Data Integration

The manual onboarding process can be automated using purpose-built data integration tools.

To help you better understand the advantages, here is a step-by-step guide on how automated data integration for vendor onboarding works:

  1. Vendor data is retrieved from heterogeneous sources such as databases, FTP servers, and web APIs through built-in connectors available in the solution.
  2. The data from each file is validated by passing it through a set of predefined quality rules – this step helps in eliminating records with missing, duplicate, or incorrect data.
  3. Transformations are applied to convert input data into the desired output format or screen vendors based on business criteria. For example, if the vendor data is stored in Excel sheets and the business uses SQL Server for data storage, then the data has to be mapped to the relevant fields in the SQL Server database, which is the destination.
  4. The standardized, validated data is then loaded into a unified enterprise database that you can use as the source of information for business processes. In some cases, this can be a staging database where you can perform further filtering and aggregation to build a consolidated vendor database.
  5. This entire ETL pipeline (Step 1 through Step 4) can then be automated through event-based or time-based triggers in a workflow. For instance, you may want to run the pipeline once every day, or once a new file/data point is available in your FTP server.

Why Build a Consolidated Database for Vendors?

Once the ETL pipeline runs, you will end up with a consolidated database with complete vendor information. The main benefit of having a unified database is that it would have filtered information regarding vendors.

Most businesses have a strict process for screening vendors that follows a set of predefined rules. For example, you may want to reject vendors that have a poor credit history automatically. With manual data integration, you would need to perform this filtering by writing code. Automated data integration allows you to apply pre-built filters directly within your ETL pipeline to flag or remove vendors with a credit score lower than the specified threshold.

This is just one example; you can perform a wide range of tasks at this level in your ETL pipeline including vendor scoring (calculated based on multiple fields in your data), filtering (based on rules applied to your data), and data aggregation (to add measures to your data) to build a robust vendor database for decision-making and subsequent processes.

Conclusion

Automated vendor onboarding offers cost-and-time benefits to your organization. Making use of enterprise-grade data integration tools ensures a seamless business-to-vendor data exchange without the need for reworking and upgrading your ETL pipelines.

Interview – Predictive Maintenance and how it can unleash cost savings

Interview with Dr. Kai Goebel, Principal Scientist at PARC, a Xerox Company, about Predictive Maintenance and how it can unleash cost savings.

Dr. Kai Goebel is principal scientist as PARC with more than two decades experience in corporate and government research organizations. He is responsible for leading applied research on state awareness, prognostics and decision-making using data analytics, AI, hybrid methods and physics-base methods. He has also fielded numerous applications for Predictive Maintenance at General Electric, NASA, and PARC for uses as diverse as rocket launchpads, jet engines, and chemical plants.

Data Science Blog: Mr. Goebel, predictive maintenance is not just a hype since industrial companies are already trying to establish this use case of predictive analytics. What benefits do they really expect from it?

Predictive Maintenance is a good example for how value can be realized from analytics. The result of the analytics drives decisions about when to schedule maintenance in advance of an event that might cause unexpected shutdown of the process line. This is in contrast to an uninformed process where the decision is mostly reactive, that is, maintenance is scheduled because equipment has already failed. It is also in contrast to a time-based maintenance schedule. The benefits of Predictive Maintenance are immediately clear: one can avoid unexpected downtime, which can lead to substantial production loss. One can manage inventory better since lead times for equipment replacement can be managed well. One can also manage safety better since equipment health is understood and safety averse situations can potentially be avoided. Finally, maintenance operations will be inherently more efficient as they shift significant time from inspection to mitigation of.

Data Science Blog: What are the most critical success factors for implementing predictive maintenance?

Critical for success is to get the trust of the operator. To that end, it is imperative to understand the limitations of the analytics approach and to not make false performance promises. Often, success factors for implementation hinge on understanding the underlying process and the fault modes reasonably well. It is important to be able to recognize the difference between operational changes and abnormal conditions. It is equally important to recognize rare events reliably while keeping false positives in check.

Data Science Blog: What kind of algorithm does predictive maintenance work with? Do you differentiate between approaches based on classical machine learning and those based on deep learning?

Well, there is no one kind of algorithm that works for Predictive Mantenance everywhere. Instead, one should look at the plurality of all algorithms as tools in a toolbox. Then analyze the problem – how many examples for run-to-failure trajectories are there; what is the desired lead time to report on a problem; what is the acceptable false positive/false negative rate; what are the different fault modes; etc – and use the right kind of tool to do the job. Just because a particular approach (like the one you mentioned in your question) is all the hype right now does not mean it is the right tool for the problem. Sometimes, approaches from what you call “classical machine learning” actually work better. In fact, one should consider approaches even outside the machine learning domain, either as stand-alone approach as in a hybrid configuration. One may also have to invent new methods, for example to perform online learning of the dynamic changes that a system undergoes through its (long) life. In the end, a customer does not care about what approach one is using, only if it solves the problem.

Data Science Blog: There are several providers for predictive analytics software. Is it all about software tools? What makes the difference for having success?

Frequently, industrial partners lament that they have to spend a lot of effort in teaching a new software provider about the underlying industrial processes as well as the equipment and their fault modes. Others are tired of false promises that any kind of data (as long as you have massive amounts of it) can produce any kind of performance. If one does not physically sense a certain modality, no algorithmic magic can take place. In other words, it is not just all about the software. The difference for having success is understanding that there is no cookie cutter approach. And that realization means that one may have to role up the sleeves and to install new instrumentation.

Data Science Blog: What are coming trends? What do you think will be the main topic 2020 and 2021?

Predictive Maintenance is slowly evolving towards Prescriptive Maintenance. Here, one does not only seek to inform about an impending problem, but also what to do about it. Such an approach needs to integrate with the logistics element of an organization to find an optimal decision that trades off several objectives with regards to equipment uptime, process quality, repair shop loading, procurement lead time, maintainer availability, safety constraints, contractual obligations, etc.

Conversion Rate Optimization: Understanding the Sales Funnel

Are you capturing the attention of consumers or prospects with your content? Do they trust you enough to give you their contact information? Will they come back and buy from you again? Knowing how the sales funnel works and what you can do to improve it will take you down the road of success.

Business 101

As a business owner, your goal is to turn a prospect (meaning a prospective buyer) into a loyal customer. Nobody wants to lose a possible customer after putting a lot of effort into the attempt of establishing a relationship. Once you understand the different stages of the sales funnel, it will be easier to find cracks and holes within. The following sections unpack how sales funnel management can help you optimize your conversion rate and build a successful long-term relationship with your customers and website users.

The Sales Funnel

The sales funnel describes the path a customer takes on the way to buying a product or service. It visualizes the typical journey they go through and in which stage of the buying decision prospects are at the moment. As one of the core concepts in digital marketing, sales funnel management can help you to understand your audience and prevent them from dropping out before a sale is made. It is about giving every potential customer the treatment they are looking for. If you don’t understand your sales funnel, you can’t optimize it. What matters most when it comes to a sales funnel is website optimization.

Prospects move from the top of the funnel to the bottom as they become more familiar with what you have to offer. The sales funnel narrows as visitors move through it, and the number of people in your funnel will continue to decrease the closer you get to sealing the deal. It starts at the top with all the prospects who landed on your website one way or another, while the narrow bottom represents loyal customers.

The 4 Stages of the Sales Funnel

Moving people through the funnel can be a challenge. A stratagem to keep in mind is that your goal should be to solve the “problems” of your customers, or potentially make them aware of a problem they didn’t even know existed. Start by creating content that attracts your prospect’s attention, followed by offering an irresistible solution to the problem. All you have to do then is watch the magic happen.

Truthfully, that is easier said than done, but if you follow the four stages of a prospective customer’s mindset, you will reach your goal sooner than later. The different stages can be easily explained using the AIDA (Awareness, Interest, Decision, Action) strategy. To understand what moves a buying decision, we have to take a closer look at each stage and the approach it requires.

Awareness

To end up with a strong bond with your prospect, you have to gain attention first. Depending on how they found you (organic search results, recommendations, advertisements, or just pure luck), people will put different amounts of trust in your business. If you are lucky and all circumstances fall perfectly into place, a prospect turns into a customer immediately. More often though, the awareness stage does exactly what it sounds like; it creates awareness of your business and your products or services. At this point, all you are trying to do is lead prospects into the next stage, which will make them return for more.

Interest

Once a potential customer is aware of you, you need to build their interest. In this stage potential customers are interested in what you have to offer and are doing research or comparison. It is the perfect time to show off authority in your field and support them with helpful content that does not yet try to sell to them. Make sure your message stays consistent throughout the whole process and do not try to push too hard from the beginning. The interest stage should only lead them to be able to make an informed decision.

Decision

For the most part, the majority of people do not like making decisions and, therefore, getting a prospect to make a buying decision is not an easy feat. At this stage, you have to bring on your A-game and make them an offer they can’t refuse. Whether this means offering free premium shipping, a discount code, or a free month of your services is totally up to you; you just have to make sure that your potential customer wants to take advantage of it. Showcasing positive reviews or social proof is another powerful way that you can get people to take action.

 Action

Now your prospect turns into a customer. When he or she purchases your product or takes advantage of your service, that customer becomes part of your business’s ecosystem. But just because they reached the final stage of the sales funnel and the AIDA principle doesn’t mean your work is all said and done. Starting to build a long-term relationship with someone who already trusts your company is easier than starting the sales funnel all over again with a new prospect.

Sales Funnel Management

At this point, you should understand why sales funnel management is so important. Even the best prospects can get lost along the way if expectations aren’t met. It takes time to build a sales funnel that represents what your audience is looking for. The best way to optimize a sales funnel is to start with the results and work your way up. Another point of interest is the timing when people move from one point to the next within the funnel. This can help you find out where, when, and why you’re losing potential customers.

Too slow: New leads are nine times more likely to convert if someone follows up within the first five minutes. On the other hand, a lead is 21 times less likely to turn into a sale after 30 minutes have passed. To react within tight response times like that, you need to implement sales funnel management automation.

Too impatient: It can be tempting to dump a lead that isn’t converting right away and move on to the next. You should ask yourself the question if you are patient enough and if you are following up as much as you should. A marketing automation funnel also helps to stay in touch with the prospect over time.

Too fast: Instead of asking people to buy from you right away, you should cultivate them over time. If you adjust your sales approach to the different stages, you don’t just avoid chasing them away; you also find out what is working and what is a waste of your time.

How can you optimize your conversion rate?

There are countless ways you can improve your conversion rate and turn a “no, thank you” into a “yes, please.” In sales, a no often simply means “not until later” or “try again, I’m just not totally convinced yet.” Any time you encounter problems like that, you can use one or multiple of the following, mostly automated sales techniques, to reach your goals.

Target your Audience

To lead people into your sales funnel, you have to put the right content in front of your prospects. How and where you do that depends on your target audience. Be creative with your content, but make sure it mimics your offer and the call-to-action you are using. Customer relationship management (CRM) can help you track interactions with current and future customers.

Build a Landing Page

A landing page offers content that addresses a specific problem, ideally with a single call-to-action, and should steer your visitor towards becoming a customer. A/B testing your landing pages will help you figure out what your audience responds to best and what language, imagery, or layouts can help you improve conversion rates. Experienced hosting companies like 101domain can help you along the way. Additionally, you can use pay-per-click campaigns to drive traffic to your landing page and contact forms to gain subscribers to a mailing list.

Targeting Soft Conversions

When considering which page to use as a landing page, you can increase your conversion rate by bringing leads to an on-site resource to gain a “soft conversion.”

 To illustrate the importance of a good landing page and soft conversions, consider the following data:
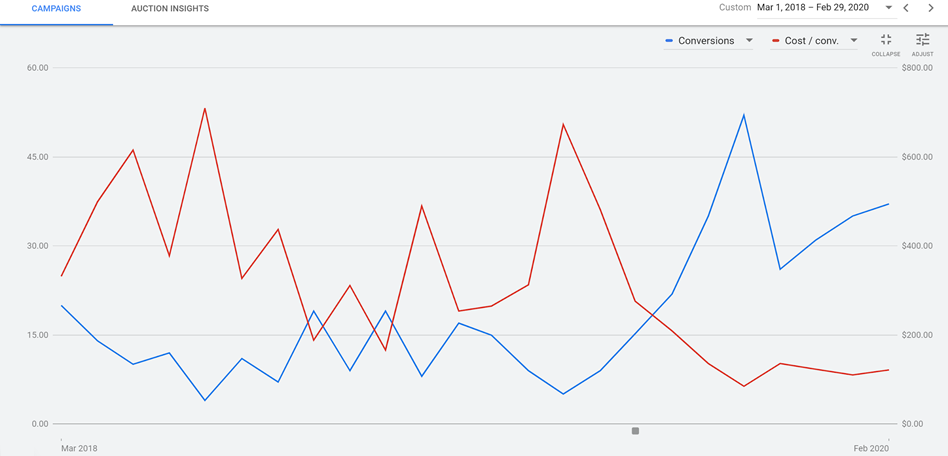
RED: Cost per conversion BLUE: Number of conversions X-AXIS: Time (Screenshot supplied by Howard Ahmanson)

The initial strategy represented in this graph was to take visitors directly to a sales page. This resulted in a very low number of conversions, about a rate of 1%,, which in turn drove the cost per conversion way up. Later, the landing page was switched to an on-site resource, such as  a form fill of “get the free retirement planning guide.” This prompted a few soft conversions, or in other words email addresses. Upon doing this, the average number of conversions per month increased from about 10 to between 30 and 45, which in turn dropped the total cost per conversion from a median of about $400 to about $100. This is an approximately 300% increase in conversions at 50% of the cost.

But how does increased conversions translate in terms of sales numbers? To see an example of this, consider the data from the Ken Tamplin Vocal Academy:
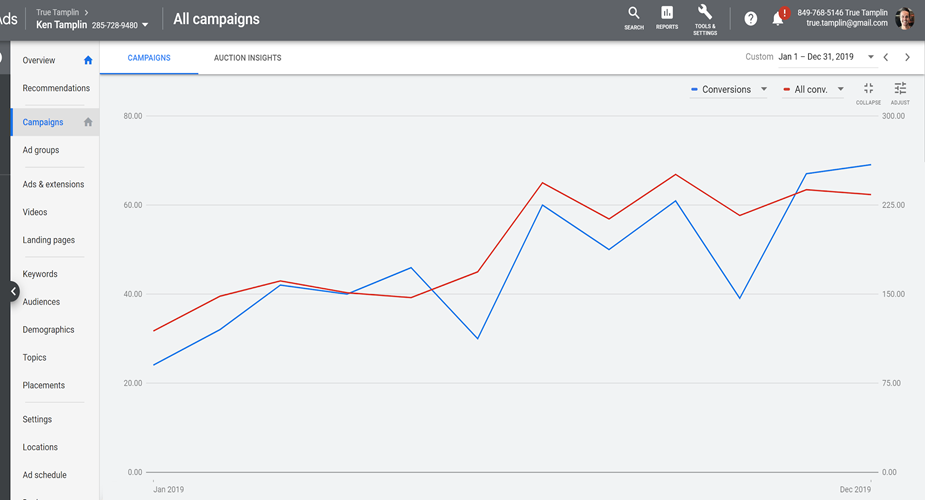
RED: Total conversion, including soft conversions
BLUE: Sales conversions
X-AXIS: Time

When running ads for Ken, the initial strategy was to bring prospects directly to a sales page. Later, this was switched out for a “Yes! I want Ken’s free lessons!” page.

This led to an increase in the number of soft conversions, which led to a tightly correlated increase in sales. There was an increase from around 30 conversions per month up to over 225, which is an increase of 750%.

Create an Email Drip Campaign

Email drip campaigns are used to send a pre-written set of emails to subscribers or customers over time. You can use those campaigns to educate the receiver as well as make them aware of sales or offers. Last but not least, don’t forget about existing customers. This technique is ideal for building up loyalty and making them feel like part of the family.

How Important is Customer Lifetime Value?

This is the third article of article series Getting started with the top eCommerce use cases. If you are interested in reading the first article you can find it here.

Customer Lifetime Value

Many researches have shown that cost for acquiring a new customer is higher than the cost of retention of an existing customer which makes Customer Lifetime Value (CLV or LTV) one of the most important KPI’s. Marketing is about building a relationship with your customer and quality service matters a lot when it comes to customer retention. CLV is a metric which determines the total amount of money a customer is expected to spend in your business.

CLV allows marketing department of the company to understand how much money a customer is going  to spend over their  life cycle which helps them to determine on how much the company should spend to acquire each customer. Using CLV a company can better understand their customer and come up with different strategies either to retain their existing customers by sending them personalized email, discount voucher, provide them with better customer service etc. This will help a company to narrow their focus on acquiring similar customers by applying customer segmentation or look alike modeling.

One of the main focus of every company is Growth in this competitive eCommerce market today and price is not the only factor when a customer makes a decision. CLV is a metric which revolves around a customer and helps to retain valuable customers, increase revenue from less valuable customers and improve overall customer experience. Don’t look at CLV as just one metric but the journey to calculate this metric involves answering some really important questions which can be crucial for the business. Metrics and questions like:

  1. Number of sales
  2. Average number of times a customer buys
  3. Full Customer journey
  4. How many marketing channels were involved in one purchase?
  5. When the purchase was made?
  6. Customer retention rate
  7. Marketing cost
  8. Cost of acquiring a new customer

and so on are somehow associated with the calculation of CLV and exploring these questions can be quite insightful. Lately, a lot of companies have started to use this metric and shift their focuses in order to make more profit. Amazon is the perfect example for this, in 2013, a study by Consumers Intelligence Research Partners found out that prime members spends more than a non-prime member. So Amazon started focusing on Prime members to increase their profit over the past few years. The whole article can be found here.

How to calculate CLV?

There are several methods to calculate CLV and few of them are listed below.

Method 1: By calculating average revenue per customer


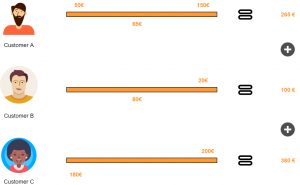
Figure 1: Using average revenue per customer


Let’s suppose three customers brought 745€ as profit to a company over a period of 2 months then:

CLV (2 months) = Total Profit over a period of time / Number of Customers over a period of time

CLV (2 months) = 745 / 3 = 248 €

Now the company can use this to calculate CLV for an year however, this is a naive approach and works only if the preferences of the customer are same for the same period of time. So let’s explore other approaches.

Method 2

This method requires to first calculate KPI’s like retention rate and discount rate.


CLV = Gross margin per lifespan ( Retention rate per month / 1 + Discount rate – Retention rate per month)

Where

Retention rate = Customer at the end of the month – Customer during the month / Customer at the beginning of the month ) * 100

Method 3

This method will allow us to look at other metrics also and can be calculated in following steps:

  1. Calculate average number of transactions per month (T)
  2. Calculate average order value (OV)
  3. Calculate average gross margin (GM)
  4. Calculate customer lifespan in months (ALS)

After calculating these metrics CLV can be calculated as:


CLV = T*OV*GM*ALS / No. of Clients for the period

where

Transactions (T) = Total transactions / Period

Average order value (OV) = Total revenue / Total orders

Gross margin (GM) = (Total revenue – Cost of sales/ Total revenue) * 100 [but how you calculate cost of sales is debatable]

Customer lifespan in months (ALS) = 1 / Churn Rate %


CLV can be calculated using any of the above mentioned methods depending upon how robust your company wants the analysis to be. Some companies are also using Machine learning models to predict CLV, maybe not directly but they use ML models to predict customer churn rate, retention rate and other marketing KPI’s. Some companies take advantage of all the methods by taking an average at the end.

Python vs R: Which Language to Choose for Deep Learning?

Data science is increasingly becoming essential for every business to operate efficiently in this modern world. This influences the processes composed together to obtain the required outputs for clients. While machine learning and deep learning sit at the core of data science, the concepts of deep learning become essential to understand as it can help increase the accuracy of final outputs. And when it comes to data science, R and Python are the most popular programming languages used to instruct the machines.

Python and R: Primary Languages Used for Deep Learning

Deep learning and machine learning differentiate based on the input data type they use. While machine learning depends upon the structured data, deep learning uses neural networks to store and process the data during the learning. Deep learning can be described as the subset of machine learning, where the data to be processed is defined in another structure than a normal one.

R is developed specifically to support the concepts and implementation of data science and hence, the support provided by this language is incredible as writing codes become much easier with its simple syntax.

Python is already much popular programming language that can serve more than one development niche without straining even for a bit. The implementation of Python for programming machine learning algorithms is very much popular and the results provided are accurate and faster than any other language. (C or Java). And because of its extended support for data science concept implementation, it becomes a tough competitor for R.

However, if we compare the charts of popularity, Python is obviously more popular among data scientists and developers because of its versatility and easier usage during algorithm implementation. However, R outruns Python when it comes to the packages offered to developers specifically expertise in R over Python. Therefore, to conclude which one of them is the best, let’s take an overview of the features and limits offered by both languages.

Python

Python was first introduced by Guido Van Rossum who developed it as the successor of ABC programming language. Python puts white space at the center while increasing the readability of the developed code. It is a general-purpose programming language that simply extends support for various development needs.

The packages of Python includes support for web development, software development, GUI (Graphical User Interface) development and machine learning also. Using these packages and putting the best development skills forward, excellent solutions can be developed. According to Stackoverflow, Python ranks at the fourth position as the most popular programming language among developers.

Benefits for performing enhanced deep learning using Python are:

  • Concise and Readable Code
  • Extended Support from Large Community of Developers
  • Open-source Programming Language
  • Encourages Collaborative Coding
  • Suitable for small and large-scale products

The latest and stable version of Python has been released as Python 3.8.0 on 14th October 2019. Developing a software solution using Python becomes much easier as the extended support offered through the packages drives better development and answers every need.

R

R is a language specifically used for the development of statistical software and for statistical data analysis. The primary user base of R contains statisticians and data scientists who are analyzing data. Supported by R Foundation for statistical computing, this language is not suitable for the development of websites or applications. R is also an open-source environment that can be used for mining excessive and large amounts of data.

R programming language focuses on the output generation but not the speed. The execution speed of programs written in R is comparatively lesser as producing required outputs is the aim not the speed of the process. To use R in any development or mining tasks, it is required to install its operating system specific binary version before coding to run the program directly into the command line.

R also has its own development environment designed and named RStudio. R also involves several libraries that help in crafting efficient programs to execute mining tasks on the provided data.

The benefits offered by R are pretty common and similar to what Python has to offer:

  • Open-source programming language
  • Supports all operating systems
  • Supports extensions
  • R can be integrated with many of the languages
  • Extended Support for Visual Data Mining

Although R ranks at the 17th position in Stackoverflow’s most popular programming language list, the support offered by this language has no match. After all, the R language is developed by statisticians for statisticians!

Python vs R: Should They be Really Compared?

Even when provided with the best technical support and efficient tools, a developer will not be able to provide quality outputs if he/she doesn’t possess the required skills. The point here is, technical skills rank higher than the resources provided. A comparison of these two programming languages is not advisable as they both hold their own set of advantages. However, the developers considering to use both together are less but they obtain maximum benefit from the process.

Both these languages have some features in common. For example, if a representative comes asking you if you lend technical support for developing an uber clone, you are directly going to decline as Python and R both do not support mobile app development. To benefit the most and develop excellent solutions using both these programming languages, it is advisable to stop comparing and start collaborating!

R and Python: How to Fit Both In a Single Program

Anticipating the future needs of the development industry, there has been a significant development to combine these both excellent programming languages into one. Now, there are two approaches to performing this: either we include R script into Python code or vice versa.

Using the available interfaces, packages and extended support from Python we can include R script into the code and enhance the productivity of Python code. Availability of PypeR, pyRserve and more resources helps run these two programming languages efficiently while efficiently performing the background work.

Either way, using the developed functions and packages made available for integrating Python in R are also effective at providing better results. Available R packages like rJython, rPython, reticulate, PythonInR and more, integrating Python into R language is very easy.

Therefore, using the development skills at their best and maximizing the use of such amazing resources, Python and R can be togetherly used to enhance end results and provide accurate deep learning support.

Conclusion

Python and R both are great in their own names and own places. However, because of the wide applications of Python in almost every operation, the annual packages offered to Python developers are less than the developers skilled in using R. However, this doesn’t justify the usability of R. The ultimate decision of choosing between these two languages depends upon the data scientists or developers and their mining requirements.

And if a developer or data scientist decides to develop skills for both- Python and R-based development, it turns out to be beneficial in the near future. Choosing any one or both to use in your project depends on the project requirements and expert support on hand.

Multi-touch attribution: A data-driven approach

Customers shopping behavior has changed drastically when it comes to online shopping, as nowadays, customer likes to do a thorough market research about a product before making a purchase.

What is Multi-touch attribution?

This makes it really hard for marketers to correctly determine the contribution for each marketing channel to which a customer was exposed to. The path a customer takes from his first search to the purchase is known as a Customer Journey and this path consists of multiple marketing channels or touchpoints. Therefore, it is highly important to distribute the budget between these channels to maximize return. This problem is known as multi-touch attribution problem and the right attribution model helps to steer the marketing budget efficiently. Multi-touch attribution problem is well known among marketers. You might be thinking that if this is a well known problem then there must be an algorithm out there to deal with this. Well, there are some traditional models  but every model has its own limitation which will be discussed in the next section.

Types of attribution models

Most of the eCommerce companies have a performance marketing department to make sure that the marketing budget is spent in an agile way. There are multiple heuristics attribution models pre-existing in google analytics however there are several issues with each one of them. These models are:

Traditional attribution models

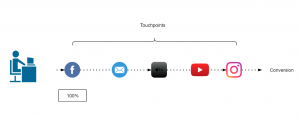
First touch attribution model

100% credit is given to the first channel as it is considered that the first marketing channel was responsible for the purchase.

Figure 1: First touch attribution model

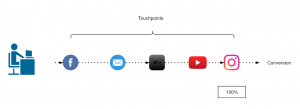
Last touch attribution model

100% credit is given to the last channel as it is considered that the first marketing channel was responsible for the purchase.

Figure 2: Last touch attribution model

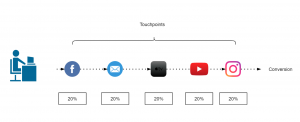
Linear-touch attribution model

In this attribution model, equal credit is given to all the marketing channels present in customer journey as it is considered that each channel is equally responsible for the purchase.

Figure 3: Linear attribution model

U-shaped or Bath tub attribution model

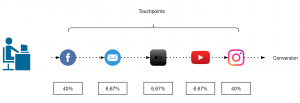
This is most common in eCommerce companies, this model assigns 40% to first and last touch and 20% is equally distributed among the rest.

Figure 4: Bathtub or U-shape attribution model

Data driven attribution models

Traditional attribution models follows somewhat a naive approach to assign credit to one or all the marketing channels involved. As it is not so easy for all the companies to take one of these models and implement it. There are a lot of challenges that comes with multi-touch attribution problem like customer journey duration, overestimation of branded channels, vouchers and cross-platform issue, etc.

Switching from traditional models to data-driven models gives us more flexibility and more insights as the major part here is defining some rules to prepare the data that fits your business. These rules can be defined by performing an ad hoc analysis of customer journeys. In the next section, I will discuss about Markov chain concept as an attribution model.

Markov chains

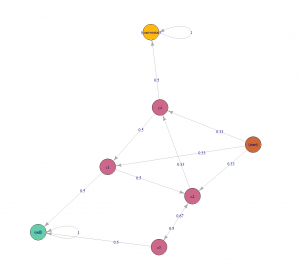
Markov chains concepts revolves around probability. For attribution problem, every customer journey can be seen as a chain(set of marketing channels) which will compute a markov graph as illustrated in figure 5. Every channel here is represented as a vertex and the edges represent the probability of hopping from one channel to another. There will be an another detailed article, explaining the concept behind different data-driven attribution models and how to apply them.

Figure 5: Markov chain example

Challenges during the Implementation

Transitioning from a traditional attribution models to a data-driven one, may sound exciting but the implementation is rather challenging as there are several issues which can not be resolved just by changing the type of model. Before its implementation, the marketers should perform a customer journey analysis to gain some insights about their customers and try to find out/perform:

  1. Length of customer journey.
  2. On an average how many branded and non branded channels (distinct and non-distinct) in a typical customer journey?
  3. Identify most upper funnel and lower funnel channels.
  4. Voucher analysis: within branded and non-branded channels.

When you are done with the analysis and able to answer all of the above questions, the next step would be to define some rules in order to handle the user data according to your business needs. Some of the issues during the implementation are discussed below along with their solution.

Customer journey duration

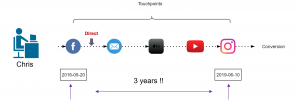
Assuming that you are a retailer, let’s try to understand this issue with an example. In May 2016, your company started a Fb advertising campaign for a particular product category which “attracted” a lot of customers including Chris. He saw your Fb ad while working in the office and clicked on it, which took him to your website. As soon as he registered on your website, his boss called him (probably because he was on Fb while working), he closed everything and went for the meeting. After coming back, he started working and completely forgot about your ad or products. After a few days, he received an email with some offers of your products which also he ignored until he saw an ad again on TV in Jan 2019 (after 3 years). At this moment, he started doing his research about your products and finally bought one of your products from some Instagram campaign. It took Chris almost 3 years to make his first purchase.

Figure 6: Chris journey

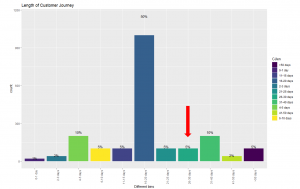
Now, take a minute and think, if you analyse the entire journey of customers like Chris, you would realize that you are still assigning some of the credit to the touchpoints that happened 3 years ago. This can be solved by using an attribution window. Figure 6 illustrates that 83% of the customers are making a purchase within 30 days which means the attribution window here could be 30 days. In simple words, it is safe to remove the touchpoints that happens after 30 days of purchase. This parameter can also be changed to 45 days or 60 days, depending on the use case.

Figure 7: Length of customer journey

Removal of direct marketing channel

A well known issue that every marketing analyst is aware of is, customers who are already aware of the brand usually comes to the website directly. This leads to overestimation of direct channel and branded channels start getting more credit. In this case, you can set a threshold (say 7 days) and remove these branded channels from customer journey.

Figure 8: Removal of branded channels

Cross platform problem

If some of your customers are using different devices to explore your products and you are not able to track them then it will make retargeting really difficult. In a perfect world these customers belong to same journey and if these can’t be combined then, except one, other paths would be considered as “non-converting path”. For attribution problem device could be thought of as a touchpoint to include in the path but to be able to track these customers across all devices would still be challenging. A brief introduction to deterministic and probabilistic ways of cross device tracking can be found here.

Figure 9: Cross platform clash

How to account for Vouchers?

To better account for vouchers, it can be added as a ‘dummy’ touchpoint of the type of voucher (CRM,Social media, Affiliate or Pricing etc.) used. In our case, we tried to add these vouchers as first touchpoint and also as a last touchpoint but no significant difference was found. Also, if the marketing channel of which the voucher was used was already in the path, the dummy touchpoint was not added.

Figure 10: Addition of Voucher as a touchpoint

Seeing the Big Picture: Combining Enterprise Architecture with Process Management

Ever tried watching a 3D movie without those cool glasses people like to take home? Two hours of blurred flashing images is no-one’s idea of fun. But with the right equipment, you get an immersive experience, with realistic, clear, and focused images popping out of the screen. In the same way, the right enterprise architecture brings the complex structure of an organization into focus.

We know that IT environments in today’s modern businesses consist of a growing number of highly complex, interconnected, and often difficult-to-manage IT systems. Balancing customer service and efficiency imperatives associated with social, mobile, cloud, and big data technologies, along with effective day-to-day IT functions and support, can often feel like an insurmountable challenge.

Enterprise architecture can help organizations achieve this balance, all while managing risk, optimizing costs, and implementing innovations. Its main aim is to support reform and transformation programs. To do this, enterprise architecture relies on the accuracy of an enterprise’s complex data systems, and takes into account changing standards, regulations, and strategic business demands.

Components of effective enterprise architecture

In general, most widely accepted enterprise architecture frameworks consist of four interdependent domains:

  • Business Architecture

A blueprint of the enterprise that provides a common understanding of the organization, and used to align strategic objectives and tactical demands. An example would be representing business processes using business process management notation.

  • Data Architecture

The domain that shows the dependencies and connections between an organization’s data, rules, models, and standards.

  • Applications Architecture

The layer that shows a company’s complete set of software solutions and their relationships with each other.

  • Infrastructure Architecture

Positioned at the lowest level, this component shows the relationships and connections of an organization’s existing hardware solutions.

Effective EA implementation means employees within a business can build a clear understanding of the way their company’s IT systems execute their specific work processes, as well as how they interact and relate to each other. It allows users to identify and analyze application and business performance, with the goal of enabling underperforming IT systems to be promptly and efficiently managed.

In short, EA helps businesses answer questions like:

  • Which IT systems are in use, and where, and by whom?
  • Which business processes relate to which IT systems?
  • Who is responsible for which IT systems?
  • How well are privacy protection requirements upheld?
  • Which server is each application run on?

The same questions, shifted slightly to refer to business processes rather than IT systems, are what drive enterprise-level business process management as well. Is it any wonder the two disciplines go together like popcorn and a good movie?

Combining enterprise architecture with process management

Successful business/IT alignment involves effectively leveraging an organization’s IT to achieve company goals and requirements. Standardized language and images (like flow charts and graphs) are often helpful in fostering mutual understanding between highly technical IT services and the business side of an organization.

In the same way, combining EA with collaborative business process management establishes a common language throughout a company. Once this common ground is established, misunderstandings can be avoided, and the business then has the freedom to pursue organizational or technical transformation goals effectively.

At this point, strengthened links between management, IT specialists, and a process-aware workforce mean more informed decisions become the norm. A successful pairing of process management, enterprise architecture, and IT gives insight into how changes in any one area impact the others, ultimately resulting in a clearer understanding of how the organization actually functions. This translates into an easier path to optimized business processes, and therefore a corresponding improvement in customer satisfaction.

Effective enterprise architecture provides greater transparency inside IT teams, and allows for efficient management of IT systems and their respective interfaces. Along with planning continual IT landscape development, EA supports strategic development of an organization’s structure, just as process management does.

Combining the two leads to a quantum leap in the efficiency and effectiveness of IT systems and business processes, and locks them into a mutually-reinforcing cycle of optimization, meaning improvements will continue over time. Both user communities can contribute to creating a better understanding using a common tool, and the synergy created from joining EA and business process management adds immediate value by driving positive changes company-wide.

Want to find out more? Put on your 3D glasses, and test your EA initiatives with Signavio! Sign up for your free 30-day trial of the Signavio Business Transformation Suite today.

AI For Advertisers: How Data Analytics Can Change The Maths Of Advertising?

All Images Credit: Freepik

The task of understanding a customer’s journey and designing your marketing strategy accordingly can be difficult in this data-driven world. Today, the customer expresses their needs in myriad forms of requests.

Consumers express their needs and want attitudes, and values in various forms through search, comments, blogs, Tweets, “likes,” videos, and conversations and access such data across many channels like web, mobile, and face to face. Volume, variety, velocity and veracity of the data accumulated through these customer interactions are huge.

BigData and data analytics can be leveraged to understand several phases of the customer journey. There are risks involved in using Artificial Intelligence for the marketing data analysis of data breach and even manipulation. But, AI do have brighter prospects when it comes to marketing and advertiser applications.

As the CEO of a technology firm Chop Dawg and marketer, Joshua Davidson puts it, “AI-powered apps are going to be the future for us, and there are several industries that are ripe for this.” The mobile-first strategy of many enterprises has powered the use of AI for digital marketing and developing technologies and innovations to power industries with intelligent systems.

How AI and Machine learning are affecting customer journeys?

Any consumer journey begins with the recognition of a problem and then stages like initial consideration, active evaluation, purchase, and postpurchase come through up till the consumer journey is over. The need for identifying the purchasing and need patterns of the consumers and finding the buyer personas to strategize the marketing for them.

Need and Want Recognition:

Identifying a need is quite difficult as it is the most initial level of a consumer’s journey and it is more on the category level than at a brand level. Marketers and advertisers are relying on techniques like market research, web analytics, and data mining to build consumer profiles and buyer’s persona for understanding the needs and influencing the purchase of products. AI can help identify these wants and needs in real-time as the consumers usually express their needs and wants online and help build profiles more quickly.

AI technologies offered by several firms help in consumer profiling. Firms like Microsoft offers Azure that crunches billions of data points in seconds to determine the needs of consumers. It then personalizes web content on specific platforms in real-time to align with those status-updates. Consumer digital footprints are evolving through social media status updates, purchasing behavior, online comments and posts. Ai tends to update these profiles continuously through machine learning techniques.

Initial Consideration:

A key objective of advertising is to insert a brand into the consideration set of the consumers when they are looking for deliberate offerings. Advertising includes increasing the visibility of brands and emphasize on the key reasons for consideration. Advertisers currently use search optimization, paid search advertisements, organic search, or advertisement retargeting for finding the consideration and increase the probability of consumer consideration.

AI can leverage machine learning and data analytics to help with search, identify and rank functions of consumer consideration that can match the real-time considerations at any specific time. Take an example of Google Adwords, it analyzes the consumer data and helps advertisers make clearer distinctions between qualified and unqualified leads for better targeting.

Google uses AI to analyze the search-query data by considering, not only the keywords but also context words and phrases, consumer activity data and other BigData. Then, Google identifies valuable subsets of consumers and more accurate targeting.

Active Evaluation: 

When consumers narrow it down to a few choices of brands, advertisers need to insert trust and value among the consumers for brands. A common technique is to identify the higher purchase consumers and persuade them through persuasive content and advertisement. AI can support these tasks using some techniques:

Predictive Lead Scoring: Predictive lead scoring by leveraging machine learning techniques of predictive analytics to allow marketers to make accurate predictions related to the intent of purchase for consumers. A machine learning algorithm runs through a database of existing consumer data, then recognize trends and patterns and after processing the external data on consumer activities and interests, creates robust consumer profiles for advertisers.

Natural Language Generation: By leveraging the image, speech recognition and natural language generation, machine learning enables marketers to curate content while learning from the consumer behavior in real-time scenarios and adjusts the content according to the profiles on the fly.

Emotion AI: Marketers use emotion AI to understand consumer sentiment and feel about the brand in general. By tapping into the reviews, blogs or videos they understand the mood of customers. Marketers also use emotion AI to pretest advertisements before its release. The famous example of Kelloggs, which used emotion AI to help devise an advertising campaign for their cereal, eliminating the advertisement executions whenever the consumer engagement dropped.

Purchase: 

As the consumers decide which brands to choose and what it’s worth, advertising aims to move them out of the decision process and push for the purchase by reinforcing the value of the brand compared with its competition.

Advertisers can insert such value by emphasizing convenience and information about where to buy the product, how to buy the product and reassuring the value through warranties and guarantees. Many marketers also emphasize on rapid return policies and purchase incentives.

AI can completely change the purchase process through dynamic pricing, which encompasses real-time price adjustments on the basis of information such as demand and other consumer-behavior variables, seasonality, and competitor activities.

Post-Purchase: 

Aftersales services can be improved through intelligent systems using AI technologies and machine learning techniques. Marketers and advertisers can hire dedicated developers to design intelligent virtual agents or chatbots that can reinforce the value and performance of a brand among consumers.

Marketers can leverage an intelligent technique known as Propensity modeling to identify the most valuable customers on the basis of lifetime value, likelihood of reengagement, propensity to churn, and other key performance measures of interest. Then advertisers can personalize their communication with these customers on the basis of these data.

Conclusion:

AI has shifted the focus of advertisers and marketers towards the customer-first strategies and enhanced the heuristics of customer engagement. Machine learning and IoT(Internet of Things) has already changed the way customer interact with the brands and this transition has come at a time when advertisers and marketers are looking for new ways to tap into the customer mindset and buyer’s persona.

All Images Credit: Freepik

The importance of being Data Scientist

Header-Image by Clint Adair on Unsplash.

The incredible results of Machine Learning and Artificial Intelligence, Deep Learning in particular, could give the impression that Data Scientist are like magician. Just think of it. Recognising faces of people, translating from one language to another, diagnosing diseases from images, computing which product should be shown for us next to buy and so on from numbers only. Numbers which existed for centuries. What a perfect illusion. But it is only an illusion, as Data Scientist existed as well for centuries. However, there is a difference between the one from today compared to the one from the past: evolution.

The main activity of Data Scientist is to work with information also called data. Records of data are as old as mankind, but only within the 16 century did it include also numeric forms — as numbers started to gain more and more ground developing their own symbols. Numerical data, from a given phenomenon — being an experiment or the counts of sheep sold by week over the year –, was from early on saved in tabular form. Such a way to record data is interlinked with the supposition that information can be extracted from it, that knowledge — in form of functions — is hidden and awaits to be discovered. Collecting data and determining the function best fitting them let scientist to new insight into the law of nature right away: Galileo’s velocity law, Kepler’s planetary law, Newton theory of gravity etc.

Such incredible results where not possible without the data. In the past, one was able to collect data only as a scientist, an academic. In many instances, one needed to perform the experiment by himself. Gathering data was tiresome and very time consuming. No sensor which automatically measures the temperature or humidity, no computer on which all the data are written with the corresponding time stamp and are immediately available to be analysed. No, everything was performed manually: from the collection of the data to the tiresome computation.

More then that. Just think of Michael Faraday and Hermann Hertz and there experiments. Such endeavour where what we will call today an one-man-show. Both of them developed parts of the needed physics and tools, detailed the needed experiment settings, conducting the experiment and collect the data and, finally, computing the results. The same is true for many other experiments of their time. In biology Charles Darwin makes its case regarding evolution from the data collected in his expeditions on board of the Beagle over a period of 5 years, or Gregor Mendel which carry out a study of pea regarding the inherence of traits. In physics Blaise Pascal used the barometer to determine the atmospheric pressure or in chemistry Antoine Lavoisier discovers from many reaction in closed container that the total mass does not change over time. In that age, one person was enough to perform everything and was the reason why the last part, of a data scientist, could not be thought of without the rest. It was inseparable from the rest of the phenomenon.

With the advance of technology, theory and experimental tools was a specialisation gradually inescapable. As the experiments grow more and more complex, the background and condition in which the experiments were performed grow more and more complex. Newton managed to make first observation on light with a simple prism, but observing the line and bands from the light of the sun more than a century and half later by Joseph von Fraunhofer was a different matter. The small improvements over the centuries culminated in experiments like CERN or the Human Genome Project which would be impossible to be carried out by one person alone. Not only was it necessary to assign a different person with special skills for a separate task or subtask, but entire teams. CERN employs today around 17 500 people. Only in such a line of specialisation can one concentrate only on one task alone. Thus, some will have just the knowledge about the theory, some just of the tools of the experiment, other just how to collect the data and, again, some other just how to analyse best the recorded data.

If there is a specialisation regarding every part of the experiment, what makes Data Scientist so special? It is impossible to validate a theory, deciding which market strategy is best without the work of the Data Scientist. It is the reason why one starts today recording data in the first place. Not only the size of the experiment has grown in the past centuries, but also the size of the data. Gauss manage to determine the orbit of Ceres with less than 20 measurements, whereas the new picture about the black hole took 5 petabytes of recorded data. To put this in perspective, 1.5 petabytes corresponds to 33 billion photos or 66.5 years of HD-TV videos. If one includes also the time to eat and sleep, than 5 petabytes would be enough for a life time.

For Faraday and Hertz, and all the other scientist of their time, the goal was to find some relationship in the scarce data they painstakingly recorded. Due to time limitations, no special skills could be developed regarding only the part of analysing data. Not only are Data Scientist better equipped as the scientist of the past in analysing data, but they managed to develop new methods like Deep Learning, which have no mathematical foundation yet in spate of their success. Data Scientist developed over the centuries to the seldom branch of science which bring together what the scientific specialisation was forced to split.

What was impossible to conceive in the 19 century, became more and more a reality at the end of the 20 century and developed to a stand alone discipline at the beginning of the 21 century. Such a development is not only natural, but also the ground for the development of A.I. in general. The mathematical tools needed for such an endeavour where already developed by the half of the 20 century in the period when computing power was scars. Although the mathematical methods were present for everyone, to understand them and learn how to apply them developed quite differently within every individual field in which Machine Learning/A.I. was applied. The way the same method would be applied by a physicist, a chemist, a biologist or an economist would differ so radical, that different words emerged which lead to different langues for similar algorithms. Even today, when Data Science has became a independent branch, two different Data Scientists from different application background could find it difficult to understand each other only from a language point of view. The moment they look at the methods and code the differences will slowly melt away.

Finding a universal language for Data Science is one of the next important steps in the development of A.I. Then it would be possible for a Data Scientist to successfully finish a project in industry, turn to a new one in physics, then biology and returning to industry without much need to learn special new languages in order to be able to perform each tasks. It would be possible to concentrate on that what a Data Scientist does best: find the best algorithm. In other words, a Data Scientist could resolve problems independent of the background the problem was stated.

This is the most important aspect that distinguish the Data Scientist. A mathematician is limited to solve problems in mathematics alone, a physicist is able to solve problems only in physics, a biologist problems only in biology. With a unique language regarding the methods and strategies to solve Machine Learning/A.I. problems, a Data Scientist can solve a problem independent of the field. Specialisation put different branches of science at drift from each other, but it is the evolution of the role of the Data Scientist to synthesize from all of them and find the quintessence in a language which transpire beyond all the field of science. The emerging language of Data Science is a new building block, a new mathematical language of nature.

Although such a perspective does not yet exists, the principal component of Machine Learning/A.I. already have such proprieties partially in form of data. Because predicting for example the numbers of eggs sold by a company or the numbers of patients which developed immune bacteria to a specific antibiotic in all hospital in a country can be performed by the same prediction method. The data do not carry any information about the entities which are being predicted. It does not matter anymore if the data are from Faraday’s experiment, CERN of Human Genome. The same data set and its corresponding prediction could stand literary for anything. Thus, the result of the prediction — what we would call for a human being intuition and/or estimation — would be independent of the domain, the area of knowledge it originated.

It also lies at the very heart of A.I., the dream of researcher to create self acting entities, that is machines with consciousness. This implies that the algorithms must be able to determine which task, model is relevant at a given moment. It would be to cumbersome to have a model for every task and and every field and then try to connect them all in one. The independence of scientific language, like of data, is thus a mandatory step. It also means that developing A.I. is not only connected to develop a new consciousness, but, and most important, to the development of our one.

Why Retailers Are Making the Push for Stronger Data Science and AI

Retail relies on what the customer wants and needs at that moment, no matter the size of the company. Making judgments without consumer input would probably work for a little while but will fall flat as soon as the business model becomes outdated. In today’s technology-run world, things can become obsolete in a matter of days or even hours.

Retailers are the businesses most in need of capitalizing on what the customer wants in real-time. They have started to use data science and information from the Internet of Things (IoT) to not only stay in business, but also get ahead of other brands.

Artificial intelligence (AI) adds a new layer by using modern technology. The details of why retailers want to use these new practices are a bit more specific, though.

Data Targets Audiences

By using current customer data compared to information from the IoT, retailers can learn more about their audience and find better means of targeting them. Demographics like age, location and many other factors could affect advertising and even shopping, not to mention holidays throughout the year an audience celebrates.

Websites also need to be customized to suit the target audience. Those that are mobile-friendly and focused on what shoppers want can increase revenue, but the wrong approach can drive away new and existing customers. AI can help companies understand that data and present it back to the customer seamlessly, providing different options for various audiences.

Customer Base Expansion

Customer success should mean business success, as well. Growing a client base is something data science can assist with. However, helping customers grow is another type of service few companies provide but all people appreciate. A business can expand by offering new products and services that are relevant to their audience through the use of data.

Once a company learns what current customers want and begin to fit their needs, it can expand to more audiences. With data science, a business can ensure it does so slowly to give more of what current customers want while also finding new ones. The data can tell what sort of interests they all share so companies can capitalize on the venture.

AI Helps Customer Service

AI helps out customer service on both ends. Employees don’t have to focus on common problems that could easily be resolved, and clients often walk away happier than if they were to speak to a real person. This doesn’t work for every problem, especially ones that are specific in nature, but they can assist with more common issues. This is where chatbots enter the stage.

An AI-supported chatbot can give immediate support, provide suggestions, answer direct questions and offer almost any other form of help needed. Customers get personalized attention, and businesses can work faster toward customer loyalty.

Again, speaking to a real person when they have problems is a big plus for customers, but not for issues they know could be resolved in the time it takes to wait on the line for a representative.

Supply and Demand

Price optimization has taken on a bigger role than it has in the past. Mostly, data science is looking at supply and demand in real-time rather than having price fluctuations occur months after the business loses money. Having the right price can also help create more promotions for products and services, rewarding loyal customers for their shopping.

The data has to be gained from multiple channels by using price optimization tools, which focus on using data correctly in a company’s favor. The information doesn’t just look at supply and demand, but also examines locations, times, customer attitudes, competitor pricing and many other factors. All these pieces of information can be delivered in real-time so prices can be changed accordingly.

Taking the Competition

The thing about data science is that businesses are already utilizing it to their full potential and getting more customers than ever. The only way to get ahead of the competition is to at least start using the tools they’ve had at their disposal for years.

Target was one such company that took up the data helm. During 2012 and 2013, it saw a pretty sizeable dip in sales, but its online sales went up by almost 30% during the same time.

Data and Retail

When running a retail business, especially one that’s branching off into a franchise, using data is imperative. Data science and AI have become extremely important to companies both big and small.

Applying it correctly can help enterprises of any size and in every industry take things to the next level.

Even if a company is just starting out, sticking the first landing with a target audience is a fantastic way to begin the adventure and find success.