Must-have Skills to Master Data Science

The need to process a massive amount of data sets is making Data Science the most-demanded job across diverse industry verticals. In today’s times, organizations are actively looking for Data Scientists.

But What does a Data Scientist do?

Data Scientist design data models, create various algorithms to extract the data the organization needs, and then they analyze the gathered data and communicate the data insights with the business stakeholders.

If you are looking forward to pursuing a career in Data Science, then this blog is for you 🙂

Data Scientists often come from many different educational and work experience backgrounds but few skills are common and essential.

Let’s have a look at all the essential skills required to become a Data Scientist:

  1. Multivariable Calculus & Linear Algebra
  2. Probability & Statistics
  3. Programming Skills (Python & R)
  4. Machine Learning Algorithms
  5. Data Visualization
  6. Data Wrangling
  7. Data Intuition

Let’s dive deeper into all these skills one by one.

Multivariable Calculus & Linear Algebra:

Having a solid understanding of math concepts is very helpful for a Data Scientist.

Key Concepts:

  • Matrices
  • Linear Algebra Functions
  • Derivatives and Gradient
  • Relational Algebra

Probability & Statistics:

Probability and Statistics play a major role in Data Science for estimation and prediction purposes.

Key concepts required:

  • Probability Distributions
  • Conditional Probability
  • Bayesian Thinking
  • Descriptive Statistics
  • Random Variables
  • Hypothesis Testing and Regression
  • Maximum Likelihood Estimation

Programming Skills (Python & R):

Python :

Start with Python Fundamentals using a jupyter notebook, which comes pre-packaged with Python libraries.

Important Python Libraries used:

  • NumPy (For Data Exploration)
  • Pandas (For Data Exploration)
  • Matplotlib (For Data Visualization)

R:

It is a programming language and software environment used for statistical computing and graphics. 

Key Concepts required:

  • R Languages fundamentals and basic syntax
  • Vectors, Matrices, Factors
  • Data frames
  • Basic Graphics

Machine Learning Algorithms

Machine Learning is an innovative and essential field in the industry. There are quite a few algorithms out there, major ones are as follows –

  • Linear Regression
  • Logistic Regression
  • Decision Trees
  • Random Forest
  • Naïve Bayes
  • Support Vector Machines
  • Dimensionality Reduction
  • K-means
  • Artificial Neural Networks

Data Visualization:

Data visualization is very essential when it comes to analyzing a massive amount of information and data. 

To make data-driven decisions, data visualization tools, and technologies are essential in the world of Data Science.

Data Visualization tools:

  • Tableau
  • Microsoft Power Bi
  • E Charts
  • Datawrapper
  • HighCharts

Data Wrangling:

Data wrangling, this term refers to the process of cleaning and refining the messy and complex data available into a more usable format. 

It is considered one of the most crucial parts of working with data.

Important Steps to Data Wrangling:

  1. Discovering
  2. Structuring
  3. Cleaning
  4. Enriching
  5. Validating
  6. Documenting

Tools used:

  • Tabula
  • Google DataPrep
  • Data Wrangler
  • CSVkit

Data Wrangling can be done using Python and R.

Data Intuition:

Data Intuition in Data Science is an intuitive understanding of concepts. It’s one of the most significant skills required to become a Data Scientist.

It’s about recognizing patterns where none are observable on the surface.

This is something that you need to develop. It is a skill that will only come with experience.

A Data Scientist should know which Data Science methods to apply to the problem at hand.

Conclusion:

 As you can see, all these skills – from programming to algorithmic methods, work with one another to build on top of each other for gathering deeper data insights.

There are a wide number of courses available online for developing these skills and to help you become a true talent in this data industry.

Sure, this journey isn’t an easy one to follow but it’s not impossible. With sheer determination and consistency, you will be able to cross all the hurdles in your Data Science career path.

Simple RNN

Prerequisites for understanding RNN at a more mathematical level

Writing the A gentle introduction to the tiresome part of understanding RNN Article Series on recurrent neural network (RNN) is nothing like a creative or ingenious idea. It is quite an ordinary topic. But still I am going to write my own new article on this ordinary topic because I have been frustrated by lack of sufficient explanations on RNN for slow learners like me.

I think many of readers of articles on this website at least know that RNN is a type of neural network used for AI tasks, such as time series prediction, machine translation, and voice recognition. But if you do not understand how RNNs work, especially during its back propagation, this blog series is for you.

After reading this articles series, I think you will be able to understand RNN in more mathematical and abstract ways. But in case some of the readers are allergic or intolerant to mathematics, I tried to use as little mathematics as possible.

Ideal prerequisite knowledge:

  • Some understanding on densely connected layers (or fully connected layers, multilayer perception) and how their forward/back propagation work.
  •  Some understanding on structure of Convolutional Neural Network.

*In this article “Densely Connected Layers” is written as “DCL,” and “Convolutional Neural Network” as “CNN.”

1, Difficulty of Understanding RNN
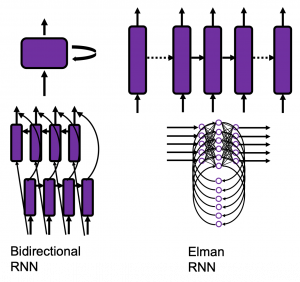
I bet a part of difficulty of understanding RNN comes from the variety of its structures. If you search “recurrent neural network” on Google Image or something, you will see what I mean. But that cannot be helped because RNN enables a variety of tasks.

Another major difficulty of understanding RNN is understanding its back propagation algorithm. I think some of you found it hard to understand chain rules in calculating back propagation of densely connected layers, where you have to make the most of linear algebra. And I have to say backprop of RNN, especially LSTM, is a monster of chain rules. I am planing to upload not only a blog post on RNN backprop, but also a presentation slides with animations to make it more understandable, in some external links.

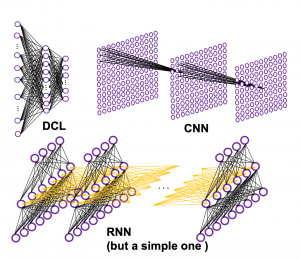
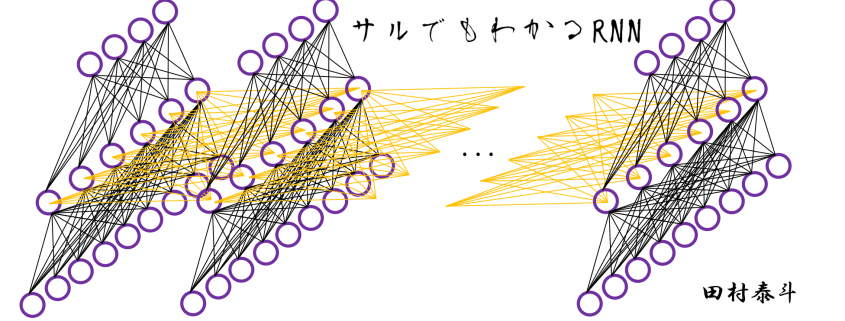
In order to avoid such confusions, I am going to introduce a very simplified type of RNN, which I call a “simple RNN.” The RNN displayed as the head image of this article is a simple RNN.

2, How Neurons are Connected

    \begin{equation*}   1 = 3 - 2 \end{equation*}

How to connect neurons and how to activate them is what neural networks are all about. Structures of those neurons are easy to grasp as long as that is about DCL or CNN. But when it comes to the structure of RNN, many study materials try to avoid showing that RNNs are also connections of neurons, as well as DCL or CNN(*If you are not sure how neurons are connected in CNN, this link should be helpful. Draw a random digit in the square at the corner.). In fact the structure of RNN is also the same, and as long as it is a simple RNN, and it is not hard to visualize its structure.

Even though RNN is also connections of neurons, usually most RNN charts are simplified, using blackboxes. In case of simple RNN, most study material would display it as the chart below.

But that also cannot be helped because fancier RNN have more complicated connections of neurons, and there are no longer advantages of displaying RNN as connections of neurons, and you would need to understand RNN in more abstract way, I mean, as you see in most of textbooks.

I am going to explain details of simple RNN in the next article of this series.

3, Neural Networks as Mappings

If you still think that neural networks are something like magical spider webs or models of brain tissues, forget that. They are just ordinary mappings.

If you have been allergic to mathematics in your life, you might have never heard of the word “mapping.” If so, at least please keep it in mind that the equation y=f(x), which most people would have seen in compulsory education, is a part of mapping. If you get a value x, you get a value y corresponding to the x.

But in case of deep learning, x is a vector or a tensor, and it is denoted with \boldsymbol{x} . If you have never studied linear algebra , imagine that a vector is a column of Excel data (only one column), a matrix is a sheet of Excel data (with some rows and columns), and a tensor is some sheets of Excel data (each sheet does not necessarily contain only one column.)
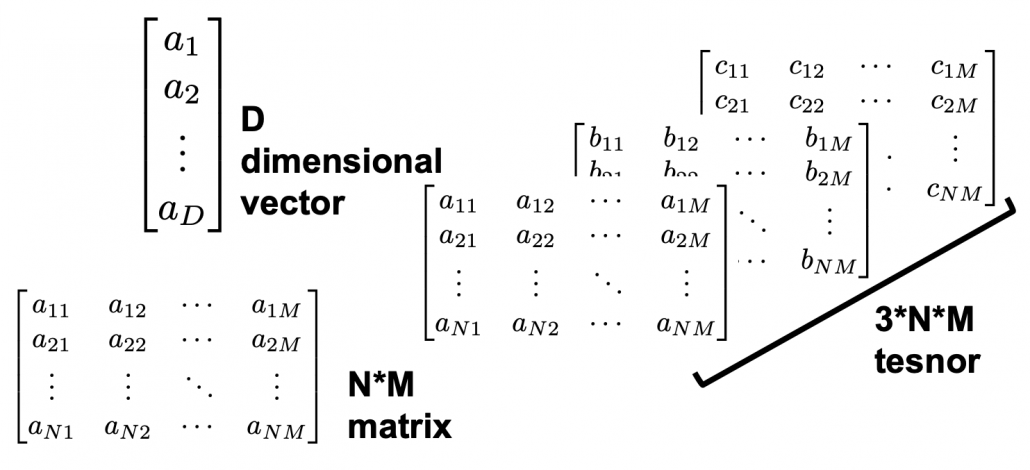
CNNs are mainly used for image processing, so their inputs are usually image data. Image data are in many cases (3, hight, width) tensors because usually an image has red, blue, green channels, and the image in each channel can be expressed as a hight*width matrix (the “height” and the “width” are number of pixels, so they are discrete numbers).

The convolutional part of CNN (which I call “feature extraction part”) maps the tensors to a vector, and the last part is usually DCL, which works as classifier/regressor. At the end of the feature extraction part, you get a vector. I call it a “semantic vector” because the vector has information of “meaning” of the input image. In this link you can see maps of pictures plotted depending on the semantic vector. You can see that even if the pictures are not necessarily close pixelwise, they are close in terms of the “meanings” of the images.

In the example of a dog/cat classifier introduced by François Chollet, the developer of Keras, the CNN maps (3, 150, 150) tensors to 2-dimensional vectors, (1, 0) or (0, 1) for (dog, cat).

Wrapping up the points above, at least you should keep two points in mind: first, DCL is a classifier or a regressor, and CNN is a feature extractor used for image processing. And another important thing is, feature extraction parts of CNNs map images to vectors which are more related to the “meaning” of the image.

Importantly, I would like you to understand RNN this way. An RNN is also just a mapping.

*I recommend you to at least take a look at the beautiful pictures in this link. These pictures give you some insight into how CNN perceive images.

4, Problems of DCL and CNN, and needs for RNN

Taking an example of RNN task should be helpful for this topic. Probably machine translation is the most famous application of RNN, and it is also a good example of showing why DCL and CNN are not proper for some tasks. Its algorithms is out of the scope of this article series, but it would give you a good insight of some features of RNN. I prepared three sentences in German, English, and Japanese, which have the same meaning. Assume that each sentence is divided into some parts as shown below and that each vector corresponds to each part. In machine translation we want to convert a set of the vectors into another set of vectors.

Then let’s see why DCL and CNN are not proper for such task.

  • The input size is fixed: In case of the dog/cat classifier I have mentioned, even though the sizes of the input images varies, they were first molded into (3, 150, 150) tensors. But in machine translation, usually the length of the input is supposed to be flexible.
  • The order of inputs does not mater: In case of the dog/cat classifier the last section, even if the input is “cat,” “cat,” “dog” or “dog,” “cat,” “cat” there’s no difference. And in case of DCL, the network is symmetric, so even if you shuffle inputs, as long as you shuffle all of the input data in the same way, the DCL give out the same outcome . And if you have learned at least one foreign language, it is easy to imagine that the orders of vectors in sequence data matter in machine translation.

*It is said English language has phrase structure grammar, on the other hand Japanese language has dependency grammar. In English, the orders of words are important, but in Japanese as long as the particles and conjugations are correct, the orders of words are very flexible. In my impression, German grammar is between them. As long as you put the verb at the second position and the cases of the words are correct, the orders are also relatively flexible.

5, Sequence Data

We can say DCL and CNN are not useful when you want to process sequence data. Sequence data are a type of data which are lists of vectors. And importantly, the orders of the vectors matter. The number of vectors in sequence data is usually called time steps. A simple example of sequence data is meteorological data measured at a spot every ten minutes, for instance temperature, air pressure, wind velocity, humidity. In this case the data is recorded as 4-dimensional vector every ten minutes.

But this “time step” does not necessarily mean “time.” In case of natural language processing (including machine translation), which you I mentioned in the last section, the numberings of each vector denoting each part of sentences are “time steps.”

And RNNs are mappings from a sequence data to another sequence data.

*At least I found a paper on the RNN’s capability of universal approximation on many-to-one RNN task. But I have not found any papers on universal approximation of many-to-many RNN tasks. Please let me know if you find any clue on whether such approximation is possible. I am desperate to know that. 

6, Types of RNN Tasks

RNN tasks can be classified into some types depending on the lengths of input/output sequences (the “length” means the times steps of input/output sequence data).

If you want to predict the temperature in 24 hours, based on several time series data points in the last 96 hours, the task is many-to-one. If you sample data every ten minutes, the input size is 96*6=574 (the input data is a list of 574 vectors), and the output size is 1 (which is a value of temperature). Another example of many-to-one task is sentiment classification. If you want to judge whether a post on SNS is positive or negative, the input size is very flexible (the length of the post varies.) But the output size is one, which is (1, 0) or (0, 1), which denotes (positive, negative).

*The charts in this section are simplified model of RNN used for each task. Please keep it in mind that they are not 100% correct, but I tried to make them as exact as possible compared to those in other study materials.

Music/text generation can be one-to-many tasks. If you give the first sound/word you can generate a phrase.

Next, let’s look at many-to-many tasks. Machine translation and voice recognition are likely to be major examples of many-to-many tasks, but here name entity recognition seems to be a proper choice. Name entity recognition is task of finding proper noun in a sentence . For example if you got two sentences “He said, ‘Teddy bears on sale!’ ” and ‘He said, “Teddy Roosevelt was a great president!” ‘ judging whether the “Teddy” is a proper noun or a normal noun is name entity recognition.
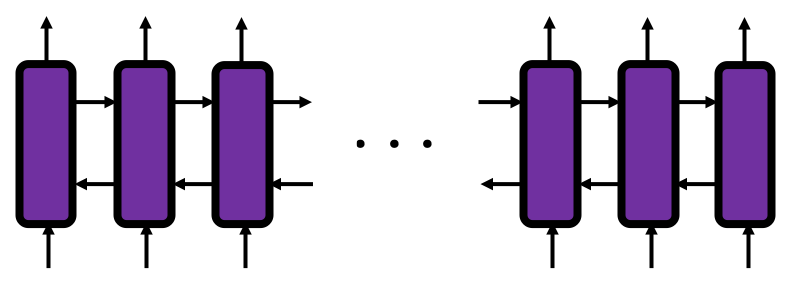
Machine translation and voice recognition, which are more popular, are also many-to-many tasks, but they use more sophisticated models. In case of machine translation, the inputs are sentences in the original language, and the outputs are sentences in another language. When it comes to voice recognition, the input is data of air pressure at several time steps, and the output is the recognized word or sentence. Again, these are out of the scope of this article but I would like to introduce the models briefly.

Machine translation uses a type of RNN named sequence-to-sequence model (which is often called seq2seq model). This model is also very important for other natural language processes tasks in general, such as text summarization. A seq2seq model is divided into the encoder part and the decoder part. The encoder gives out a hidden state vector and it used as the input of the decoder part. And decoder part generates texts, using the output of the last time step as the input of next time step.

Voice recognition is also a famous application of RNN, but it also needs a special type of RNN.

*To be honest, I don’t know what is the state-of-the-art voice recognition algorithm. The example in this article is a combination of RNN and a collapsing function made using Connectionist Temporal Classification (CTC). In this model, the output of RNN is much longer than the recorded words or sentences, so a collapsing function reduces the output into next output with normal length.

You might have noticed that RNNs in the charts above are connected in both directions. Depending on the RNN tasks you need such bidirectional RNNs.  I think it is also easy to imagine that such networks are necessary. Again, machine translation is a good example.

And interestingly, image captioning, which enables a computer to describe a picture, is one-to-many-task. As the output is a sentence, it is easy to imagine that the output is “many.” If it is a one-to-many task, the input is supposed to be a vector.

Where does the input come from? I told you that I was obsessed with the beauty of the last vector of the feature extraction part of CNN. Surprisingly the the “beautiful” vector, which I call a “semantic vector” is the input of image captioning task (after some transformations, depending on the network models).

I think this articles includes major things you need to know as prerequisites when you want to understand RNN at more mathematical level. In the next article, I would like to explain the structure of a simple RNN, and how it forward propagate.

* I make study materials on machine learning, sponsored by DATANOMIQ. I do my best to make my content as straightforward but as precise as possible. I include all of my reference sources. If you notice any mistakes in my materials, please let me know (email: yasuto.tamura@datanomiq.de). And if you have any advice for making my materials more understandable to learners, I would appreciate hearing it.

As Businesses Struggle With ML, Automation Offers a Solution

In recent years, machine learning technology and the business solutions it enables has developed into a big business in and of itself. According to the industry analysts at IDC, spending on ML and AI technology is set to grow to almost $98 billion per year by 2023. In practical terms, that figure represents a business environment where ML technology has become a key priority for companies of every kind.

That doesn’t mean that the path to adopting ML technology is easy for businesses. Far from it. In fact, survey data seems to indicate that businesses are still struggling to get their machine learning efforts up and running. According to one such survey, it currently takes the average business as many as 90 days to deploy a single machine learning model. For 20% of businesses, that number is even higher.

From the data, it seems clear that something is missing in the methodologies that most companies rely on to make meaningful use of machine learning in their business workflows. A closer look at the situation reveals that the vast majority of data workers (analysts, data scientists, etc.) spend an inordinate amount of time on infrastructure work – and not on creating and refining machine learning models.

Streamlining the ML Adoption Process

To fix that problem, businesses need to turn to another growing area of technology: automation. By leveraging the latest in automation technology, it’s now possible to build an automated machine learning pipeline (AutoML pipeline) that cuts down on the repetitive tasks that slow down ML deployments and lets data workers get back to the work they were hired to do. With the right customized solution in place, a business’s ML team can:

  • Reduce the time spent on data collection, cleaning, and ingestion
  • Minimize human errors in the development of ML models
  • Decentralize the ML development process to create an ML-as-a-service model with increased accessibility for all business stakeholders

In short, an AutoML pipeline turns the high-effort functions of the ML development process into quick, self-adjusting steps handled exclusively by machines. In some use cases, an AutoML pipeline can even allow non-technical stakeholders to self-create ML solutions tailored to specific business use cases with no expert help required. In that way, it can cut ML costs, shorten deployment time, and allow data scientists to focus on tackling more complex modelling work to develop custom ML solutions that are still outside the scope of available automation techniques.

The Parts of an AutoML Pipeline

Although the frameworks and tools used to create an AutoML pipeline can vary, they all contain elements that conform to the following areas:

  • Data Preprocessing – Taking available business data from a variety of sources, cleaning it, standardizing it, and conducting missing value imputation
  • Feature Engineering – Identifying features in the raw data set to create hypotheses for the model to base predictions on
  • Model Selection – Choosing the right ML approach or hyperparameters to produce the desired predictions
  • Tuning Hyperparameters – Determining which hyperparameters help the model achieve optimal performance

As anyone familiar with ML development can tell you, the steps in the above process tend to represent the majority of the labour and time-intensive work that goes into creating a model that’s ready for real-world business use. It is also in those steps where the lion’s share of business ML budgets get consumed, and where most of the typical delays occur.

The Limitations and Considerations for Using AutoML

Given the scope of the work that can now become part of an AutoML pipeline, it’s tempting to imagine it as a panacea – something that will allow a business to reduce its reliance on data scientists going forward. Right now, though, the technology can’t do that. At this stage, AutoML technology is still best used as a tool to augment the productivity of business data teams, not to supplant them altogether.

To that end, there are some considerations that businesses using AutoML will need to keep in mind to make sure they get reliable, repeatable, and value-generating results, including:

  • Transparency – Businesses must establish proper vetting procedures to make sure they understand the models created by their AutoML pipeline, so they can explain why it’s making the choices or predictions it’s making. In some industries, such as in medicine or finance, this could even fall under relevant regulatory requirements.
  • Extensibility – Making sure the AutoML framework may be expanded and modified to suit changing business needs or to tackle new challenges as they arise.
  • Monitoring and Maintenance – Since today’s AutoML technology isn’t a set-it-and-forget-it proposition, it’s important to establish processes for the monitoring and maintenance of the deployment so it can continue to produce useful and reliable ML models.

The Bottom Line

As it stands today, the convergence of automation and machine learning holds the promise of delivering ML models at scale for businesses, which would greatly speed up the adoption of the technology and lower barriers to entry for those who have yet to embrace it. On the whole, that’s great news both for the businesses that will benefit from increased access to ML technology, as well as for the legions of data professionals tasked with making it all work.

It’s important to note, of course, that complete end-to-end ML automation with no human intervention is still a long way off. While businesses should absolutely explore building an automated machine learning pipeline to speed up development time in their data operations, they shouldn’t lose sight of the fact that they still need plenty of high-skilled data scientists and analysts on their teams. It’s those specialists that can make appropriate and productive use of the technology. Without them, an AutoML pipeline would accomplish little more than telling the business what it wants to hear.

The good news is that the AutoML tools that exist right now are sufficient to alleviate many of the real-world problems businesses face in their road to ML adoption. As they become more commonplace, there’s little doubt that the lead time to deploy machine learning models is going to shrink correspondingly – and that businesses will enjoy higher ROI and enhanced outcomes as a result.

Six properties of modern Business Intelligence

Regardless of the industry in which you operate, you need information systems that evaluate your business data in order to provide you with a basis for decision-making. These systems are commonly referred to as so-called business intelligence (BI). In fact, most BI systems suffer from deficiencies that can be eliminated. In addition, modern BI can partially automate decisions and enable comprehensive analyzes with a high degree of flexibility in use.


Read this article in German:
“Sechs Eigenschaften einer modernen Business Intelligence“


Let us discuss the six characteristics that distinguish modern business intelligence, which mean taking technical tricks into account in detail, but always in the context of a great vision for your own company BI:

1. Uniform database of high quality

Every managing director certainly knows the situation that his managers do not agree on how many costs and revenues actually arise in detail and what the margins per category look like. And if they do, this information is often only available months too late.

Every company has to make hundreds or even thousands of decisions at the operational level every day, which can be made much more well-founded if there is good information and thus increase sales and save costs. However, there are many source systems from the company’s internal IT system landscape as well as other external data sources. The gathering and consolidation of information often takes up entire groups of employees and offers plenty of room for human error.

A system that provides at least the most relevant data for business management at the right time and in good quality in a trusted data zone as a single source of truth (SPOT). SPOT is the core of modern business intelligence.

In addition, other data on BI may also be made available which can be useful for qualified analysts and data scientists. For all decision-makers, the particularly trustworthy zone is the one through which all decision-makers across the company can synchronize.

2. Flexible use by different stakeholders

Even if all employees across the company should be able to access central, trustworthy data, with a clever architecture this does not exclude that each department receives its own views of this data. Many BI systems fail due to company-wide inacceptance because certain departments or technically defined employee groups are largely excluded from BI.

Modern BI systems enable views and the necessary data integration for all stakeholders in the company who rely on information and benefit equally from the SPOT approach.

3. Efficient ways to expand (time to market)

The core users of a BI system are particularly dissatisfied when the expansion or partial redesign of the information system requires too much of patience. Historically grown, incorrectly designed and not particularly adaptable BI systems often employ a whole team of IT staff and tickets with requests for change requests.

Good BI is a service for stakeholders with a short time to market. The correct design, selection of software and the implementation of data flows / models ensures significantly shorter development and implementation times for improvements and new features.

Furthermore, it is not only the technology that is decisive, but also the choice of organizational form, including the design of roles and responsibilities – from the technical system connection to data preparation, pre-analysis and support for the end users.

4. Integrated skills for Data Science and AI

Business intelligence and data science are often viewed and managed separately from each other. Firstly, because data scientists are often unmotivated to work with – from their point of view – boring data models and prepared data. On the other hand, because BI is usually already established as a traditional system in the company, despite the many problems that BI still has today.

Data science, often referred to as advanced analytics, deals with deep immersion in data using exploratory statistics and methods of data mining (unsupervised machine learning) as well as predictive analytics (supervised machine learning). Deep learning is a sub-area of ​​machine learning and is used for data mining or predictive analytics. Machine learning is a sub-area of ​​artificial intelligence (AI).

In the future, BI and data science or AI will continue to grow together, because at the latest after going live, the prediction models flow back into business intelligence. BI will probably develop into ABI (Artificial Business Intelligence). However, many companies are already using data mining and predictive analytics in the company, using uniform or different platforms with or without BI integration.

Modern BI systems also offer data scientists a platform to access high-quality and more granular raw data.

5. Sufficiently high performance

Most readers of these six points will probably have had experience with slow BI before. It takes several minutes to load a daily report to be used in many classic BI systems. If loading a dashboard can be combined with a little coffee break, it may still be acceptable for certain reports from time to time. At the latest, however, with frequent use, long loading times and unreliable reports are no longer acceptable.

One reason for poor performance is the hardware, which can be almost linearly scaled to higher data volumes and more analysis complexity using cloud systems. The use of cloud also enables the modular separation of storage and computing power from data and applications and is therefore generally recommended, but not necessarily the right choice for all companies.

In fact, performance is not only dependent on the hardware, the right choice of software and the right choice of design for data models and data flows also play a crucial role. Because while hardware can be changed or upgraded relatively easily, changing the architecture is associated with much more effort and BI competence. Unsuitable data models or data flows will certainly bring the latest hardware to its knees in its maximum configuration.

6. Cost-effective use and conclusion

Professional cloud systems that can be used for BI systems offer total cost calculators, such as Microsoft Azure, Amazon Web Services and Google Cloud. With these computers – with instruction from an experienced BI expert – not only can costs for the use of hardware be estimated, but ideas for cost optimization can also be calculated. Nevertheless, the cloud is still not the right solution for every company and classic calculations for on-premise solutions are necessary.

Incidentally, cost efficiency can also be increased with a good selection of the right software. Because proprietary solutions are tied to different license models and can only be compared using application scenarios. Apart from that, there are also good open source solutions that can be used largely free of charge and can be used for many applications without compromises.

However, it is wrong to assess the cost of a BI only according to its hardware and software costs. A significant part of cost efficiency is complementary to the aspects for the performance of the BI system, because suboptimal architectures work wastefully and require more expensive hardware than neatly coordinated architectures. The production of the central data supply in adequate quality can save many unnecessary processes of data preparation and many flexible analysis options also make redundant systems unnecessary and lead to indirect savings.

In any case, a BI for companies with many operational processes is always cheaper than no BI. However, if you take a closer look with BI expertise, cost efficiency is often possible.

Interview – There is no stand-alone strategy for AI, it must be part of the company-wide strategy

Ronny FehlingRonny Fehling is Partner and Associate Director for Artificial Intelligence as the Boston Consulting Group GAMMA. With more than 20 years of continually progressive experience in leading business and technology innovation, spearheading digital transformation, and aligning the corporate strategy with Artificial Intelligence he industry-leading organizations to grow their top-line and kick-start their digital transformation.

Ronny Fehling is furthermore speaker of the Predictive Analytics World for Industry 4.0 in May 2020.

Data Science Blog: Mr. Fehling, you are consulting companies and business leaders about AI and how to get started with it. AI as a definition is often misleading. How do you define AI?

This is a good question. I think there are two ways to answer this:

From a technical definition, I often see expressions about “simulation of human intelligence” and “acting like a human”. I find using these terms more often misleading rather than helpful. I studied AI back when it wasn’t yet “cool” and still middle of the AI winter. And yes, we have much more compute power and access to data, but we also think about data in a very different way. For me, I typically distinguish between machine learning, which uses algorithms and statistical methods to identify patterns in data, and AI, which for me attempts to interpret the data in a given context. So machine learning can help me identify and analyze frequency patterns in text and even predict the next word I will type based on my history. AI will help me identify ‘what’ I’m writing about – even if I don’t explicitly name it. It can tell me that when I’m asking “I’m looking for a place to stay” that I might want to see a list of hotels around me. In other words: machine learning can detect correlations and similar patterns, AI uses machine learning to generate insights.

I always wondered why top executives are so frequently asking about the definition of AI because at first it seemed to me not as relevant to the discussion on how to align AI with their corporate strategy. However, I started to realize that their question is ultimately about “What is AI and what can it do for me?”.

For me, AI can do three things really good, which humans cannot really do and previous approaches couldn’t cope with:

  1. Finding similar patterns in historical data. Imagine 20 years of data like maintenance or repair documents of a manufacturing plant. Although they describe work done on a multitude of products due to a multitude of possible problems, AI can use this to look for a very similar situation based on a current problem description. This can be used to identify a common root cause as well as a common solution approach, saving valuable time for the operation.
  2. Finding correlations across time or processes. This is often used in predictive maintenance use cases. Here, the AI tries to see what similar events happen typically at some time before a failure happen. This way, it can alert the operator much earlier about an impending failure, say due to a change in the vibration pattern of the machine.
  3. Finding an optimal solution path based on many constraints. There are many problems in the business world, where choosing the optimal path based on complex situations is critical. Let’s say that suddenly a severe weather warning at an airport forces an airline to have to change their scheduling because of a reduced airport capacity. Delays for some aircraft can cause disruptions because passengers or personnel not being able to connect anymore. Knowing which aircraft to delay, which to cancel, which to switch while causing the minimal amount of disruption to passengers, crew, maintenance and ground-crew is something AI can help with.

The key now is to link these fundamental capabilities with the business context of the company and how it can ultimately help transform.

Data Science Blog: Companies are still starting with their own company-wide data strategy. And now they are talking about AI strategies. Is that something which should be handled separately?

In my experience – both based on having seen the implementations of several corporate data strategies as well as my upbringing at Oracle – the data strategy and AI strategy are co-dependent and cannot be separated. Very often I hear from clients that they think they first need to bring their data in order before doing AI project. And yes, without good data access, AI cannot really work. In fact, most of the time spent on AI is spent on processing, cleansing, understanding and contextualizing the data. However, you cannot really know what data will be needed in which form without knowing what you want to use it for. This is why strategies that handle data and AI separately mostly fail and generate huge costs.

Data Science Blog: What are the important steps for developing a good data strategy? Is there something like a general approach?

In my eyes, the AI strategy defines the data strategy step by step as more use cases are implemented. Rather than focusing too quickly at how to get all corporate data into a data lake, it will be much more important to start creating a use-case, technology and data governance. This governance has to be established once the AI strategy is starting to mature to enable the scale up and productization. At the beginning is to find the (very few) use-cases that can serve as light house projects to demonstrate (1) value impact, (2) a way to go from MVP to Pilot, and (3) how to address the data challenge. This will then more naturally identify the elements of governance, data access and technology that are required.

Data Science Blog: What are the most common questions from business leaders to you regarding AI? Why do they hesitate to get started?

By far it the most common question I get is: how do I get started? The hesitations often come from multiple sources like: “We don’t have the talent in house to do AI”, “Our data is not good enough”, “We don’t know which use-case to start with”, “It’s not easy for us to embrace agile and failure culture because our products are mission critical”, “We don’t know how much value this can bring us”.

Data Science Blog: Most managers prefer to start small and with lower risk. They seem to postpone bigger ideas to a later stage, at least some milestones should be reached. Is that a good idea or should they think bigger?

AI is often associated (rightfully so) with a new way of working – agile and embracing failures. Similarly, there is also the perception of significant cost to starting with AI (talent, technology, data). These perceptions often lead managers wanting to start with several smaller ambition use-cases where failure isn’t that grave. Once they have proven itself somehow, they would then move on to bigger projects. The problem with this strategy is on the one side that you fragment your few precious AI resources on too many projects and at the same time you cannot really demonstrate an impact since the projects weren’t chosen based on their impact potential.

The AI pioneers typically were successful by “thinking big, starting small and scaling fast”. You start by assessing the value potential of a use-case, for example: my current OEE (Overall Equipment Efficiency) is at 65%. There is an addressable loss of 25% which would grow my top line by $X. With the help of AI experts, you then create a hypothesis of how you think you can reduce that loss. This might be by choosing one specific equipment and 50% of the addressable loss. This is now the measure against which you define your failure or non-failure criteria. Once you have proven an MVP that can solve this loss, you scale up by piloting it in real-life setting and then scaling it to all the equipment. At every step of this process, you have a failure criterion that is measured by the impact value.


Virtual Edition, 11-12 MAY, 2020

The premier machine learning
conference for industry 4.0

This year Predictive Analytics World for Industry 4.0 runs alongside Deep Learning World and Predictive Analytics World for Healthcare.

Interview – Predictive Maintenance and how it can unleash cost savings

Interview with Dr. Kai Goebel, Principal Scientist at PARC, a Xerox Company, about Predictive Maintenance and how it can unleash cost savings.

Dr. Kai Goebel is principal scientist as PARC with more than two decades experience in corporate and government research organizations. He is responsible for leading applied research on state awareness, prognostics and decision-making using data analytics, AI, hybrid methods and physics-base methods. He has also fielded numerous applications for Predictive Maintenance at General Electric, NASA, and PARC for uses as diverse as rocket launchpads, jet engines, and chemical plants.

Data Science Blog: Mr. Goebel, predictive maintenance is not just a hype since industrial companies are already trying to establish this use case of predictive analytics. What benefits do they really expect from it?

Predictive Maintenance is a good example for how value can be realized from analytics. The result of the analytics drives decisions about when to schedule maintenance in advance of an event that might cause unexpected shutdown of the process line. This is in contrast to an uninformed process where the decision is mostly reactive, that is, maintenance is scheduled because equipment has already failed. It is also in contrast to a time-based maintenance schedule. The benefits of Predictive Maintenance are immediately clear: one can avoid unexpected downtime, which can lead to substantial production loss. One can manage inventory better since lead times for equipment replacement can be managed well. One can also manage safety better since equipment health is understood and safety averse situations can potentially be avoided. Finally, maintenance operations will be inherently more efficient as they shift significant time from inspection to mitigation of.

Data Science Blog: What are the most critical success factors for implementing predictive maintenance?

Critical for success is to get the trust of the operator. To that end, it is imperative to understand the limitations of the analytics approach and to not make false performance promises. Often, success factors for implementation hinge on understanding the underlying process and the fault modes reasonably well. It is important to be able to recognize the difference between operational changes and abnormal conditions. It is equally important to recognize rare events reliably while keeping false positives in check.

Data Science Blog: What kind of algorithm does predictive maintenance work with? Do you differentiate between approaches based on classical machine learning and those based on deep learning?

Well, there is no one kind of algorithm that works for Predictive Mantenance everywhere. Instead, one should look at the plurality of all algorithms as tools in a toolbox. Then analyze the problem – how many examples for run-to-failure trajectories are there; what is the desired lead time to report on a problem; what is the acceptable false positive/false negative rate; what are the different fault modes; etc – and use the right kind of tool to do the job. Just because a particular approach (like the one you mentioned in your question) is all the hype right now does not mean it is the right tool for the problem. Sometimes, approaches from what you call “classical machine learning” actually work better. In fact, one should consider approaches even outside the machine learning domain, either as stand-alone approach as in a hybrid configuration. One may also have to invent new methods, for example to perform online learning of the dynamic changes that a system undergoes through its (long) life. In the end, a customer does not care about what approach one is using, only if it solves the problem.

Data Science Blog: There are several providers for predictive analytics software. Is it all about software tools? What makes the difference for having success?

Frequently, industrial partners lament that they have to spend a lot of effort in teaching a new software provider about the underlying industrial processes as well as the equipment and their fault modes. Others are tired of false promises that any kind of data (as long as you have massive amounts of it) can produce any kind of performance. If one does not physically sense a certain modality, no algorithmic magic can take place. In other words, it is not just all about the software. The difference for having success is understanding that there is no cookie cutter approach. And that realization means that one may have to role up the sleeves and to install new instrumentation.

Data Science Blog: What are coming trends? What do you think will be the main topic 2020 and 2021?

Predictive Maintenance is slowly evolving towards Prescriptive Maintenance. Here, one does not only seek to inform about an impending problem, but also what to do about it. Such an approach needs to integrate with the logistics element of an organization to find an optimal decision that trades off several objectives with regards to equipment uptime, process quality, repair shop loading, procurement lead time, maintainer availability, safety constraints, contractual obligations, etc.

Image Source: Pixabay (https://pixabay.com/photos/classroom-school-education-learning-2093744/)

The Data Surrounding Higher Education and COVID-19

Just a few short weeks ago, it would have seemed impossible for some microscopic pathogen to upend our lives as we knew it, but the novel Coronavirus has proven us breathtakingly wrong.

It has suddenly and unexpectedly changed everything we had thought was most stable and predictable in our lives, from the ways that we work to the ways we interact with one another. It’s even changed the way we learn, as colleges and universities across the nation shutter their doors.

But what is the real impact of COVID-19 on higher education? How are college students really faring in the face of the pandemic, and what can we do to support them now and in the post-pandemic life to come?

The Scramble is On

Probably the most significant challenge that schools, educators, and students alike are facing is that no one really saw this coming, so now we’re trying to figure out how to protect students’ education while also protecting their physical health. We’re having to make decisions that impact millions of students and faculty and do that with no preparation whatsoever.

To make matters worse, faculties are having to convert their classes to a forum the majority have never even used before. Before the lockdown, more than 70% of faculty in higher education had zero experience with online teaching. Now they’re being asked to convert their entire semester’s course schedule from an in-class to an online format, and they’re having to do it in a matter of weeks if not days.

For students who’ve never taken a distance learning course before, these impromptu, online, cobbled-together courses are hardly the recipe for academic success. The challenge is even greater for lab-based courses, where content mastery depends on hands-on work and laboratory applications. To solve this problem, some of the newly-minted distance ed instructors are turning to online lab simulations to help students make do until the real thing is open to them again.

Making Do

It’s not just the schools and the faculty that have been caught off guard by the sudden need to learn while under lockdown. Students are also having to hustle to make sure they have the technology they need to move their college experience online. Unfortunately, for many students, that’s not always easy, and for some, it’s downright impossible.

Studies show that large swaths of the student population: first-generation college students, community college students, immigrants, and lower-income students, typically rely on on-campus facilities to access the technology they need to do their work. When physical campuses close and the community libraries and hotspots with them, so too does the chance for many students to take their learning online.

Students in urban environments face particular risks. Even if they are able to access the technology they need to engage in distance learning, they may find it impossible to socially isolate. The need to access a hotspot or wi-fi connection might put them in unsafe proximity to other students, not to mention the millions of workers now forced to telecommute.

The Good News

America’s millions of new online learners and teachers may have a tough row to hoe, but the news isn’t all bad. Online education is by no means a new thing. By 2017, nearly 7 million students were enrolled in at least one distance education course according to a recent survey by the National Center for Education Statistics.

It isn’t as though the technology to provide a secure, user-friendly learning experience doesn’t exist. The financial industry, for example, has played a leading role in developing private, responsive, and highly-customizable technology solutions to meet practically any need a client or stakeholder may have.

The solutions used for the financial sector can be built on and modified for the online learning experience to ensure the privacy of students, educators, and institutions while providing real-time access to learning tools and content to classmates and teachers.

A New Path?

As challenging as it may be, transitioning to online learning not only offers opportunities for the present, but it may well open up new paths for the future. While our world may finally be approaching the downward slope of the curve and while we may be seeing the light at the end of the tunnel, until there’s a vaccine, we haven’t likely seen the last of COVID-19.

And even when we lay the COVID beast to rest, infectious disease, unfortunately, is a fact of human life. For students just starting to think about their career paths, this lockdown may well be the push they need to find a career that’s well-suited to this “new normal.”

For instance, careers in data science transition perfectly from onsite to at-home work, and as epidemiological superheroes like Dr. Fauci and Dr. Birx have shown, they are often involved in important, life-saving work. These are also careers that can be pursued largely, if not exclusively, online. Whether you’re a complete newbie or a veteran to the field, there is a large range of degree and certification programs available online to launch or advance your data science career.

It might be that your college-with-corona experience is pointing your life in a different direction, toward education rather than data science. With a doctorate in education, your future career path is virtually unlimited. You might find yourself teaching, researching, leading universities or developing education policy.

What matters most is that with an EdD, you can make a difference in the lives of students and teachers, just as your teachers and administrators are making a difference in your life. You can be the guiding and comforting force for students in a time of crisis and you can use your experiences today to pay it forward tomorrow.

Optimize AI Talent: Perception from Across the Globe

Despite the AI hype, the AI skill gap is turning into some pariah while businesses are accelerating to become demigods.

Reports from the “Global Talent Competitiveness Index (GTCI) 2020” cover multiple parameters both national and organizational to generate insight for further action. This report compiles 70 variables including 132 national economies across the globe – based on all groups of income and at every developmental level.

The sole purpose of the GTCI report is to narrow down the skill gap by delivering the right data inputs. The figures mentioned in the report could be of value to private and public organizations.

GTCI report covered multiple themes that need to be addressed: –

As the race to embrace AI spurs, it is evident to address the challenges faced due to AI and how best these problems can be solved.

The pace at which AI is developing is transforming the way we work, forcing a technology shift, change in the corporate structure, changing the innovation system for AI professionals in every possible way.

There’s more that is needed to be done as AI and automation continue to affect the way we work.

  • Reskilling in workplaces to eliminate dearth of talent

As the role in AI keeps evolving, organizations need a larger workforce, especially to play technology roles such as AI engineers and AI specialists. Looking closely at the statistics you may not fail to notice that the number of AI job roles is on the rise, but there’s scarce talent.

Employers must take on reskilling as a critical measure. Else how will the technology market keep up with changing trends? Reskilling in the form of training or AI certifications should be emphasized. Having an in-house AI talent is an added advantage to the company.

  • Skill gap between growing countries (low performing and high performing) are widening

Based on the GTCI report, it is seen there is a skill gap happening not only across industries but between nations. The report also highlights which country lacks basic digital skills, and this highly gets contributed toward a digital divide between nations.

  • High-level of cooperation needed to embrace AI benefits

As much as the world shows concern toward embracing AI, not much has been done to achieve these transformations. And AI has huge potential to transform society and make it a better place to live. However, to embrace these benefits, corporations must engage in AI regulation.

From a talent acquisition perspective, this simply means employers will need more training and reskilling opportunities.

  • AI to allow nations to skip generations

On a technological front, AI makes it possible to skip generations in developed nations. Although, not common due to structural obstruction.

  • Cities are now competing to become talent magnets and AI hubs

As AI continues to hit the market, organizations are aggressively coming up with newer policies to attract and retain AI professionals.

No doubt, cities are striving to attract the right kind of talent as competition keeps increasing. As such many cities are competing in becoming core AI engines in transforming energy grids, transportation, and many other multiple segments. Cities are now becoming the main test beds for AI-based tools i.e. self-driven vehicles, tele-surveillance, and facial recognition.

  • Sustainable AI comes when the society is equally up for it

With certain communities not adopting and accepting the advent of AI, it is difficult to say whether these communities will not try to distort AI narratives. As a result, it is crucial for multiple stakeholders to embrace AI and developed the AI workforce in parallel.

Not to forget, regulators and policy-makers have an equal role to play to ensure there’s a smooth transition in jobs. As AI-induced transformation skyrockets, educators and leaders need to move quickly as the new generations’ complete focus is entirely based on doing their bit to the society.

Two decades passed ever since McKinsey declared the war for talent – particularly for high-performing employees. As organizations are extensively looking to hire the right talent, it is imperative to retain and attract talent at large.

Despite the unprecedented growth in AI technologies, it is near to being unanimous regarding having hold of organizations to master in AI, forget about retaining talent. They’re not even getting better at it.

Even top tech companies such as Google and Amazon, the demand for top talent outstrips the supply. Although you may find thousands of candidates applying for the same job role, the competition just gets tougher since such employers are tough nuts and pleasing them is not an easy task.

If these tech giants are finding it difficult to hire the right talent, you could imagine the plight of other companies.

Given the optimistic view regarding the technology future, it is much more challenging to convince that the war for talent truly resembles the war on talent.

The good news is organizations that look forward to adopting new technology and reskill their employees will most likely thrive in the competitive edge.

Top 7 MBA Programs to Target for Business Analytics 

Business Analytics refers to the science of collecting, analysing, sorting, processing and compiling various available data pertaining to different areas and facets of business. It also includes studying and scrutinising the information for useful and deep insights into the functioning of a business which can be used smartly for making important business-related decisions and changes to the existing system of operations. This is especially helpful in identifying all loopholes and correcting them.

The job of a business analyst is spread across every domain and industry. It is one of the highest paying jobs in the present world due to the sheer shortage of people with great analytical minds and abilities. According to a report published by Ernst & Young in 2019, there is a 50% rise in how firms and enterprises use analytics to drive decision making at a broad level. Another reason behind the high demand is the fact that nowadays a huge amount of data is generated by all companies, large or small and it usually requires a big team of analysts to reach any successful conclusion. Also, the nature and high importance of the role compels every organisation and firm to look for highly qualified and educated professionals whose prestigious degrees usually speak for them.

An MBA in Business Analytics, which happens to be a branch of Business Intelligence, also prepares one for a successful career as a management, data or market research analyst among many others. Below, we list the top 7 graduate school programs in Business Analytics in the world that would make any candidate ideal for this high paying job.

1 New York University – Stern School of Business

Location: New York City, United States

Tuition Fees: $74,184 per year

Duration:  2 years (full time)

With a graduate acceptance rate of 23%, the NYU Stern School makes it to this list due to the diversity of the course structure that it offers in its MBA program in Business Analytics. One can specialise and learn the science behind econometrics, data mining, forecasting, risk management and trading strategies by being a part of this program. The School prepares its students and offers employability in fields of investment banking, marketing, consulting, public finance and strategic planning. Along with opportunities to study abroad for small durations, the school also offers its students ample chances to network with industry leaders by means of summer internships and career workshops. It is a STEM designated two-year, full time degree program.

2 University of Pennsylvania – Wharton School Business 

Location: Philadelphia, United States

Tuition fees: $81,378 per year

Duration: 20 months (full time, including internship)

The only Ivy-League school in the list with one of the best Business Analytics MBA programs in the world, Wharton has an acceptance rate of 19% only. The tough competition here is also characterised by the high range of GMAT scores that most successful applicants have – it lies between 540 and 790, averaging at a very high threshold of 732. Most of Wharton’s graduating class finds employment in a wide range of sectors including consulting, financial services, technology, real estate and health care among many others. The long list of Wharton’s alumni includes some of the biggest business entities in the world, them being – Warren Buffet, Elon Musk, Sundar Pichai, Ronald Perelman and John Scully.

The best part about Wharton’s program structure is its focus on building leadership and a strong sense of teamwork in every student.

3 Carnegie Mellon University – Tepper School of Business

Location: Pittsburgh, United States

Tuition Fees: $67,575

Duration: 18 months (online)

The Tepper School of Business in Carnegie Mellon University is the only graduate school in the list that offers an online Master of Science program in Business Analytics. The primary objectives of the program is to equip students with creative problem solving expertise and deep analytic skills. The highlights of the program include machine learning, programming in Python and R, corporate communication and the knowledge of various business domains like marketing, finance, accounting and operations.

The various sub courses offered within the program include statistics, data management, data analytics in finance, data exploration and optimization for prescriptive analytics. There are several special topics offered too, like Ethics in Artificial Intelligence and People Analytics among many others.

4 Massachusetts Institute of Technology – Sloan School of Management

Location: Cambridge, United States

Tuition Fees: $136,480

Duration: 12 months

The Master of Business Analytics program at MIT Sloan is a relatively new program but has made it to this list due to MIT’s promise and commitment of academic and all-rounder excellence. The program is offered in association with MIT’s Operations Research Centre and is customised for students who wish to pursue a career in the industry of data sciences. The program is easily comprehensible for students from any educational background. It is a STEM designated program and the curriculum includes several modules like machine learning, usage of analytics software tools like Python, R, SQL and Julia. It also includes courses on ethics, data privacy and a capstone project.

5 University of Chicago – Graham School

Location: Chicago, United States

Tuition Fees: $4,640 per course

Duration: 12 months (full time) or 4 years (part time)

The Graham School in the University of Chicago is mainly interested in candidates who show love and passion for analytics. An incoming class at Graham usually consists of graduates in science or social science, professionals in an early career who wish to climb higher in the job ladder and mid-career professionals who wish to better their analytical skills and enhance their decision-making prowess.

The curriculum at Graham includes introduction to statistics, basic levels of programming in analytics, linear and matrix algebra, machine learning, time series analysis and a compulsory core course in leadership skills. The acceptance rate of the program is relatively higher than the previous listed universities at 34%.

6 University of Warwick – Warwick Business School

Location: Coventry, United Kingdom

Tuition Fees: $34,500

Duration: 12 months (full time)

The only school to make it to this list from the United Kingdom and the only one outside of the United States, the Warwick Business School is ranked 7th in the world by the QS World Rankings for their Master of Science degree in Business Analytics. The course aims to build strong and impeccable quantitative consultancy skills in its candidates. One can also look forward to improving their business acumen, communication skills and commercial research experience after graduating out of this program.

The school has links with big corporates like British Airways, IBM, Proctor and Gamble, Tesco, Virgin Media and Capgemini among others where it offers employment for its students.

7 Columbia University – School of Professional Studies

Location: New York City, United States 

Tuition Fees: $2,182 per point

Duration: 1.5 years full time (three terms)

The Master of Sciences program in Applied Analytics at Columbia University is aimed for all decision makers and also favours candidates with strong critical thinking and logical reasoning abilities. The curriculum is not very heavy on pure stats and data sciences but it allows students to learn from extremely practical and real-life experiences and examples. The program is a blend of several online and on-campus classes with several week-long courses also. A large number of industry experts and guest lectures take regular classes, conduct workshops and seminars for exposing the students to the real-world scenario of Business Analytics. This also gives the students a solid platform to network and broaden their perspective.

Several interesting courses within the paradigm of the program includes storytelling with data, research design, data management and a capstone project.

The admission to every school listed above is extremely competitive and with very limited intake. However, as it is rightly said, hard work is the key to success, one can rest guaranteed that their career will never be the same if they make it into any of these programs.

Multi-touch attribution: A data-driven approach

Customers shopping behavior has changed drastically when it comes to online shopping, as nowadays, customer likes to do a thorough market research about a product before making a purchase.

What is Multi-touch attribution?

This makes it really hard for marketers to correctly determine the contribution for each marketing channel to which a customer was exposed to. The path a customer takes from his first search to the purchase is known as a Customer Journey and this path consists of multiple marketing channels or touchpoints. Therefore, it is highly important to distribute the budget between these channels to maximize return. This problem is known as multi-touch attribution problem and the right attribution model helps to steer the marketing budget efficiently. Multi-touch attribution problem is well known among marketers. You might be thinking that if this is a well known problem then there must be an algorithm out there to deal with this. Well, there are some traditional models  but every model has its own limitation which will be discussed in the next section.

Types of attribution models

Most of the eCommerce companies have a performance marketing department to make sure that the marketing budget is spent in an agile way. There are multiple heuristics attribution models pre-existing in google analytics however there are several issues with each one of them. These models are:

Traditional attribution models

First touch attribution model

100% credit is given to the first channel as it is considered that the first marketing channel was responsible for the purchase.

Figure 1: First touch attribution model

Last touch attribution model

100% credit is given to the last channel as it is considered that the first marketing channel was responsible for the purchase.

Figure 2: Last touch attribution model

Linear-touch attribution model

In this attribution model, equal credit is given to all the marketing channels present in customer journey as it is considered that each channel is equally responsible for the purchase.

Figure 3: Linear attribution model

U-shaped or Bath tub attribution model

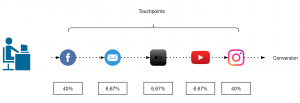
This is most common in eCommerce companies, this model assigns 40% to first and last touch and 20% is equally distributed among the rest.

Figure 4: Bathtub or U-shape attribution model

Data driven attribution models

Traditional attribution models follows somewhat a naive approach to assign credit to one or all the marketing channels involved. As it is not so easy for all the companies to take one of these models and implement it. There are a lot of challenges that comes with multi-touch attribution problem like customer journey duration, overestimation of branded channels, vouchers and cross-platform issue, etc.

Switching from traditional models to data-driven models gives us more flexibility and more insights as the major part here is defining some rules to prepare the data that fits your business. These rules can be defined by performing an ad hoc analysis of customer journeys. In the next section, I will discuss about Markov chain concept as an attribution model.

Markov chains

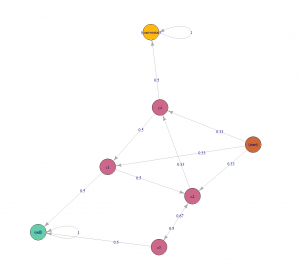
Markov chains concepts revolves around probability. For attribution problem, every customer journey can be seen as a chain(set of marketing channels) which will compute a markov graph as illustrated in figure 5. Every channel here is represented as a vertex and the edges represent the probability of hopping from one channel to another. There will be an another detailed article, explaining the concept behind different data-driven attribution models and how to apply them.

Figure 5: Markov chain example

Challenges during the Implementation

Transitioning from a traditional attribution models to a data-driven one, may sound exciting but the implementation is rather challenging as there are several issues which can not be resolved just by changing the type of model. Before its implementation, the marketers should perform a customer journey analysis to gain some insights about their customers and try to find out/perform:

  1. Length of customer journey.
  2. On an average how many branded and non branded channels (distinct and non-distinct) in a typical customer journey?
  3. Identify most upper funnel and lower funnel channels.
  4. Voucher analysis: within branded and non-branded channels.

When you are done with the analysis and able to answer all of the above questions, the next step would be to define some rules in order to handle the user data according to your business needs. Some of the issues during the implementation are discussed below along with their solution.

Customer journey duration

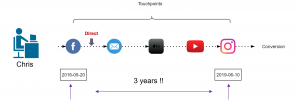
Assuming that you are a retailer, let’s try to understand this issue with an example. In May 2016, your company started a Fb advertising campaign for a particular product category which “attracted” a lot of customers including Chris. He saw your Fb ad while working in the office and clicked on it, which took him to your website. As soon as he registered on your website, his boss called him (probably because he was on Fb while working), he closed everything and went for the meeting. After coming back, he started working and completely forgot about your ad or products. After a few days, he received an email with some offers of your products which also he ignored until he saw an ad again on TV in Jan 2019 (after 3 years). At this moment, he started doing his research about your products and finally bought one of your products from some Instagram campaign. It took Chris almost 3 years to make his first purchase.

Figure 6: Chris journey

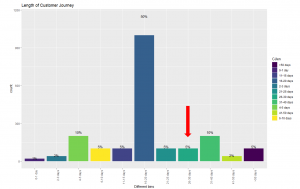
Now, take a minute and think, if you analyse the entire journey of customers like Chris, you would realize that you are still assigning some of the credit to the touchpoints that happened 3 years ago. This can be solved by using an attribution window. Figure 6 illustrates that 83% of the customers are making a purchase within 30 days which means the attribution window here could be 30 days. In simple words, it is safe to remove the touchpoints that happens after 30 days of purchase. This parameter can also be changed to 45 days or 60 days, depending on the use case.

Figure 7: Length of customer journey

Removal of direct marketing channel

A well known issue that every marketing analyst is aware of is, customers who are already aware of the brand usually comes to the website directly. This leads to overestimation of direct channel and branded channels start getting more credit. In this case, you can set a threshold (say 7 days) and remove these branded channels from customer journey.

Figure 8: Removal of branded channels

Cross platform problem

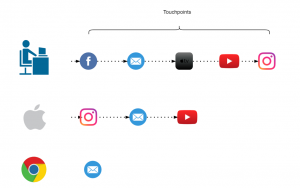
If some of your customers are using different devices to explore your products and you are not able to track them then it will make retargeting really difficult. In a perfect world these customers belong to same journey and if these can’t be combined then, except one, other paths would be considered as “non-converting path”. For attribution problem device could be thought of as a touchpoint to include in the path but to be able to track these customers across all devices would still be challenging. A brief introduction to deterministic and probabilistic ways of cross device tracking can be found here.

Figure 9: Cross platform clash

How to account for Vouchers?

To better account for vouchers, it can be added as a ‘dummy’ touchpoint of the type of voucher (CRM,Social media, Affiliate or Pricing etc.) used. In our case, we tried to add these vouchers as first touchpoint and also as a last touchpoint but no significant difference was found. Also, if the marketing channel of which the voucher was used was already in the path, the dummy touchpoint was not added.

Figure 10: Addition of Voucher as a touchpoint