New Sponsor: Snowflake

Dear readers,

we have good news again: Now we welcome snowflake as our new Data Science Blog Sponsor! So we are booked out for the moment regarding sponsoring. Snowflake provides data warehousing for the cloud and has an unique data, access and feature model, the snowflake. Now we are looking forward to editorial contributions by snowflake.

Snowflake is the only data warehouse built for the cloud. Snowflake delivers the performance, concurrency and simplicity needed to store and analyze all data available to an organization in one location. Snowflake’s technology combines the power of data warehousing, the flexibility of big data platforms, the elasticity of the cloud, and live data sharing at a fraction of the cost of traditional solutions. Snowflake: Your data, no limits. Find out more at snowflake.net.

Furthermore, snowflake will also sponsor our Data Leader Days 2018 in November in Berlin!

Applying Data Science Techniques in Python to Evaluate Ionospheric Perturbations from Earthquakes

Multi-GNSS (Galileo, GPS, and GLONASS) Vertical Total Electron Content Estimates: Applying Data Science techniques in Python to Evaluate Ionospheric Perturbations from Earthquakes

1 Introduction

Today, Global Navigation Satellite System (GNSS) observations are routinely used to study the physical processes that occur within the Earth’s upper atmosphere. Due to the experienced satellite signal propagation effects the total electron content (TEC) in the ionosphere can be estimated and the derived Global Ionosphere Maps (GIMs) provide an important contribution to monitoring space weather. While large TEC variations are mainly associated with solar activity, small ionospheric perturbations can also be induced by physical processes such as acoustic, gravity and Rayleigh waves, often generated by large earthquakes.

In this study Ionospheric perturbations caused by four earthquake events have been observed and are subsequently used as case studies in order to validate an in-house software developed using the Python programming language. The Python libraries primarily utlised are Pandas, Scikit-Learn, Matplotlib, SciPy, NumPy, Basemap, and ObsPy. A combination of Machine Learning and Data Analysis techniques have been applied. This in-house software can parse both receiver independent exchange format (RINEX) versions 2 and 3 raw data, with particular emphasis on multi-GNSS observables from GPS, GLONASS and Galileo. BDS (BeiDou) compatibility is to be added in the near future.

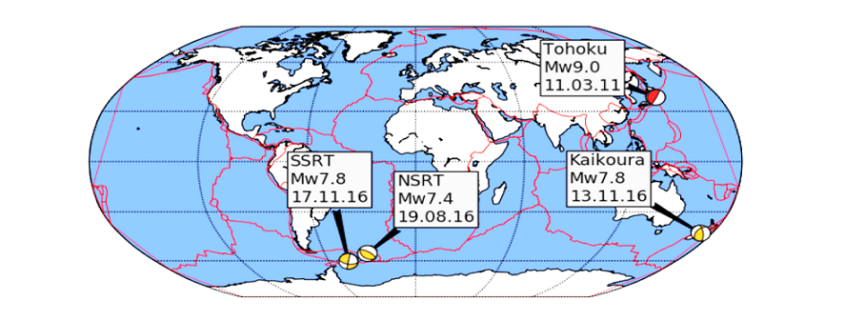
Several case studies focus on four recent earthquakes measuring above a moment magnitude (MW) of 7.0 and include: the 11 March 2011 MW 9.1 Tohoku, Japan, earthquake that also generated a tsunami; the 17 November 2013 MW 7.8 South Scotia Ridge Transform (SSRT), Scotia Sea earthquake; the 19 August 2016 MW 7.4 North Scotia Ridge Transform (NSRT) earthquake; and the 13 November 2016 MW 7.8 Kaikoura, New Zealand, earthquake.

Ionospheric disturbances generated by all four earthquakes have been observed by looking at the estimated vertical TEC (VTEC) and residual VTEC values. The results generated from these case studies are similar to those of published studies and validate the integrity of the in-house software.

2 Data Cleaning and Data Processing Methodology

Determining the absolute VTEC values are useful in order to understand the background ionospheric conditions when looking at the TEC perturbations, however small-scale variations in electron density are of primary interest. Quality checking processed GNSS data, applying carrier phase leveling to the measurements, and comparing the TEC perturbations with a polynomial fit creating residual plots are discussed in this section.

Time delay and phase advance observables can be measured from dual-frequency GNSS receivers to produce TEC data. Using data retrieved from the Center of Orbit Determination in Europe (CODE) site (ftp://ftp.unibe.ch/aiub/CODE), the differential code biases are subtracted from the ionospheric observables.

2.1 Determining VTEC: Thin Shell Mapping Function

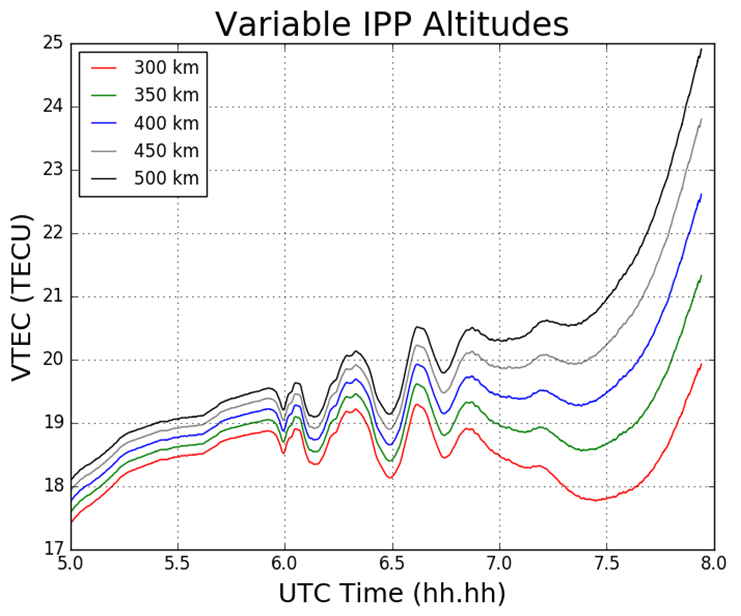
The ionospheric shell height, H, used in ionosphere modeling has been open to debate for many years and typically ranges from 300 – 400 km, which corresponds to the maximum electron density within the ionosphere. The mapping function compensates for the increased path length traversed by the signal within the ionosphere. Figure 1 demonstrates the impact of varying the IPP height on the TEC values.

Figure 1 Impact on TEC values from varying IPP heights. The height of the thin shell, H, is increased in 50km increments from 300 to 500 km.

2.2 Phase Smoothing

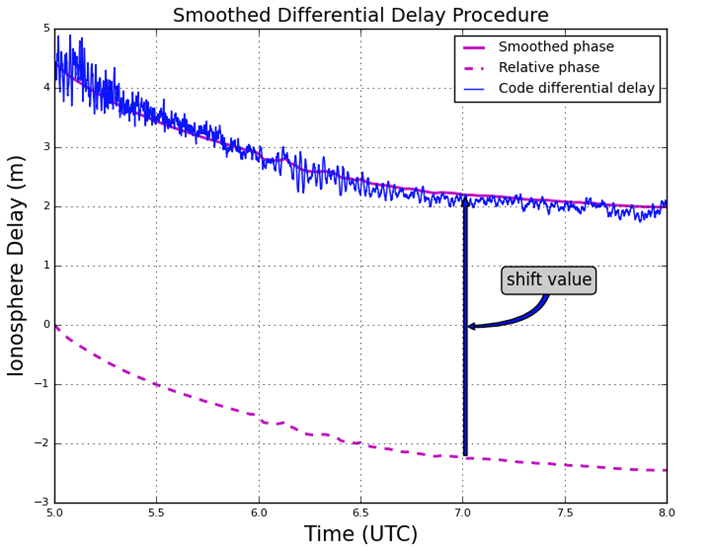
For dual-frequency GNSS users TEC values can be retrieved with the use of dual-frequency measurements by applying calculations. Calculation of TEC for pseudorange measurements in practice produces a noisy outcome and so the relative phase delay between two carrier frequencies – which produces a more precise representation of TEC fluctuations – is preferred. To circumvent the effect of pseudorange noise on TEC data, GNSS pseudorange measurements can be smoothed by carrier phase measurements, with the use of the carrier phase smoothing technique, which is often referred to as carrier phase leveling.

Figure 2 Phase smoothed code differential delay

2.3 Residual Determination

For the purpose of this study the monitoring of small-scale variations in ionospheric electron density from the ionospheric observables are of particular interest. Longer period variations can be associated with diurnal alterations, and changes in the receiver- satellite elevation angles. In order to remove these longer period variations in the TEC time series as well as to monitor more closely the small-scale variations in ionospheric electron density, a higher-order polynomial is fitted to the TEC time series. This higher-order polynomial fit is then subtracted from the observed TEC values resulting in the residuals. The variation of TEC due to the TID perturbation are thus represented by the residuals. For this report the polynomial order applied was typically greater than 4, and was chosen to emulate the nature of the arc for that particular time series. The order number selected is dependent on the nature of arcs displayed upon calculating the VTEC values after an initial inspection of the VTEC plots.

3 Results

3.1 Tohoku Earthquake

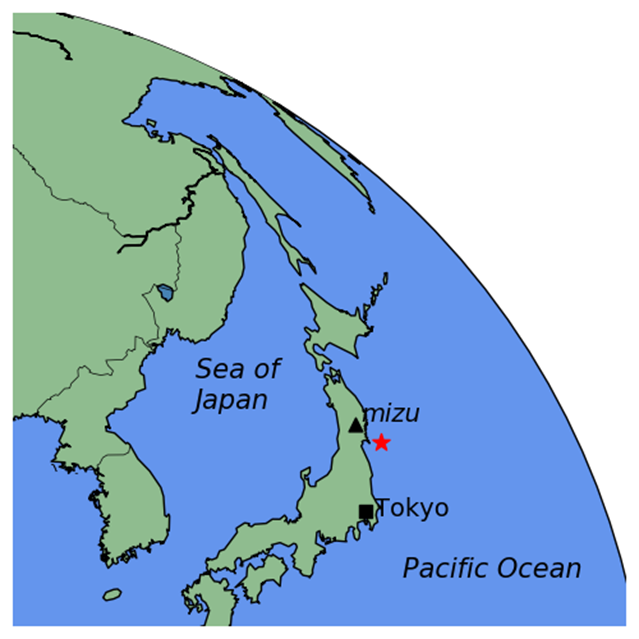
For this particular report, the sampled data focused on what was retrieved from the IGS station, MIZU, located at Mizusawa, Japan. The MIZU site is 39N 08′ 06.61″ and 141E 07′ 58.18″. The location of the data collection site, MIZU, and the earthquake epicenter can be seen in Figure 3.

Figure 3 MIZU IGS station and Tohoku earthquake epicenter [generated using the Python library, Basemap]

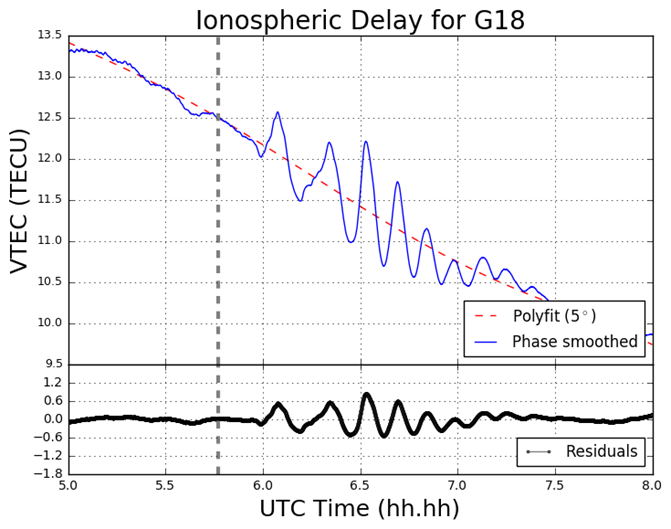
Figure 4 displays the ionospheric delay in terms of vertical TEC (VTEC), in units of TECU (1 TECU = 1016 el m-2). The plot is split into two smaller subplots, the upper section displaying the ionospheric delay (VTEC) in units of TECU, the lower displaying the residuals. The vertical grey-dashed lined corresponds to the epoch of the earthquake at 05:46:23 UT (2:46:23 PM local time) on March 11 2011. In the upper section of the plot, the blue line corresponds to the absolute VTEC value calculated from the observations, in this case L1 and L2 on GPS, whereby the carrier phase leveling technique was applied to the data set. The VTEC values are mapped from the STEC values which are calculated from the LOS between MIZU and the GPS satellite PRN18 (on Figure 4 denoted G18). For this particular data set as seen in Figure 4, a polynomial fit of  five degrees was applied, which corresponds to the red-dashed line. As an alternative to polynomial fitting, band-pass filtering can be employed when TEC perturbations are desired. However for the scope of this report polynomial fitting to the time series of TEC data was the only method used. In the lower section of Figure 4 the residuals are plotted. The residuals are simply the phase smoothed delay values (the blue line) minus the polynomial fit line (the red-dashed line). All ionosphere delay plots follow the same layout pattern and all time data is represented in UT (UT = GPS – 15 leap seconds, whereby 15 leap seconds correspond to the amount of leap seconds at the time of the seismic event). The time series shown for the ionosphere delay plots are given in terms of decimal of the hour, so that the format follows hh.hh.

Figure 4 VTEC and residual plot for G18 at MIZU on March 11 2011

3.2 South Georgia Earthquake

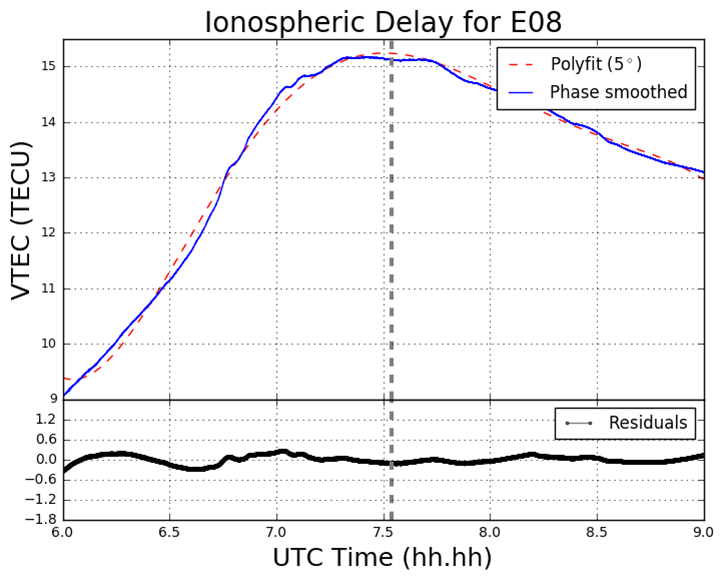
In the South Georgia Island region located in the North Scotia Ridge Transform (NSRT) plate boundary between the South American and Scotia plates on 19 August 2016, a magnitude of 7.4 MW earthquake struck at 7:32:22 UT. This subsection analyses the data retrieved from KEPA and KRSA. As well as computing the GPS and GLONASS TEC values, four Galileo satellites (E08, E14, E26, E28) are also analysed. Figure 5 demonstrates the TEC perturbations as computed for the Galileo L1 and L5 carrier frequencies.

Figure 5 VTEC and residual plots at KRSA on 19 August 2016. The plots are from the perspective of the GNSS receiver at KRSA, for four Galileo satellites (a) E08; (b) E14; (c) E24; (d) E26. The y-axes and x-axes in all plots do not conform with one another but are adjusted to fit the data. The y-axes for the residual section of each plot is consistent with one another.

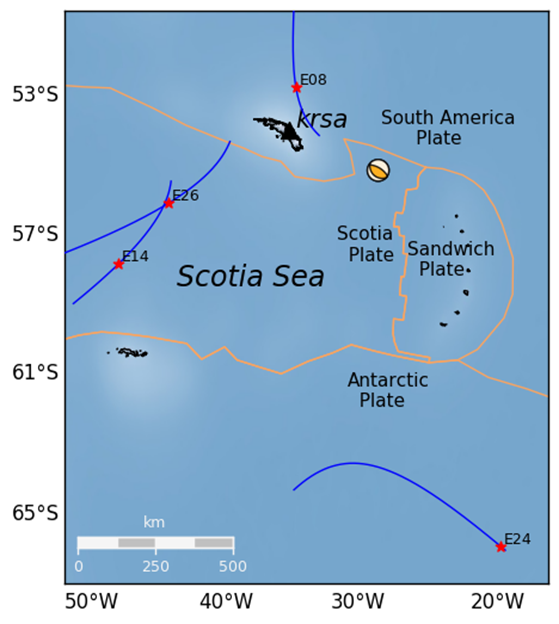
Figure 6 Geometry of the Galileo (E08, E14, E24 and E26) satellites’ projected ground track whereby the IPP is set to 300km altitude. The orange lines correspond to tectonic plate boundaries.

4 Conclusion

The proximity of the MIZU site and magnitude of the Tohoku event has provided a remarkable – albeit a poignant – opportunity to analyse the ocean-ionospheric coupling aftermath of a deep submarine seismic event. The Tohoku event has also enabled the observation of the origin and nature of the TIDs generated by both a major earthquake and tsunami in close proximity to the epicenter. Further, the Python software developed is more than capable of providing this functionality, by drawing on its mathematical packages, such as NumPy, Pandas, SciPy, and Matplotlib, as well as employing the cartographic toolkit provided from the Basemap package, and finally by utilizing the focal mechanism generation library, Obspy.

Pre-seismic cursors have been investigated in the past and strongly advocated in particular by Kosuke Heki. The topic of pre-seismic ionospheric disturbances remains somewhat controversial. A potential future study area could be the utilization of the Python program – along with algorithmic amendments – to verify the existence of this phenomenon. Such work would heavily involve the use of Scikit-Learn in order to ascertain the existence of any pre-cursors.

Finally, the code developed is still retained privately and as of yet not launched to any particular platform, such as GitHub. More detailed information on this report can be obtained here:

Download as PDF

New Sponsor: Cloudera

Dear readers,

we have good news: We welcome Cloudera as our new Data Science Blog Sponsor! Cloudera is one of the most famous platform and solution provider for big data analytics and machine learning. This also means editorial contributions by Cloudera for at least one year.

At Cloudera, we believe that data can make what is impossible today, possible tomorrow. We empower people to transform complex data into clear and actionable insights. We deliver the modern platform for machine learning and analytics optimized for the cloud. The world’s largest enterprises trust Cloudera to help solve their most challenging business problems.

Learn more about our new sponsor at cloudera.com.

New Sponsor: lexoro.ai

We wish our readers a happy new year and have good news: We welcome lexoro as our new Data Science Blog Sponsor for 2018!

lexoro GmbH is a Talent Management and Consulting company in the cosmos of the broad topic of Artificial Intelligence. Our focus lies on the relevant technologies and trends in the fields of data science, machine learning and big data. We identify and connect the best talents and experts behind the buzzwords, and help technology-focused industrial and consulting firms in finding the right people with the right skills to build and grow their analytics teams. In addition, we advise companies in identifying their individual challenges, hurdles and opportunities that go along with the great hype of Artificial Intelligence. We develop A.I. Prototypes and make the market transparent with industry-typical use cases.

Do you want to know more about lexoro? Visit them on lexoro.ai!

My Desk for Data Science

In my last post I anounced a blog parade about what a data scientist’s workplace might look like.

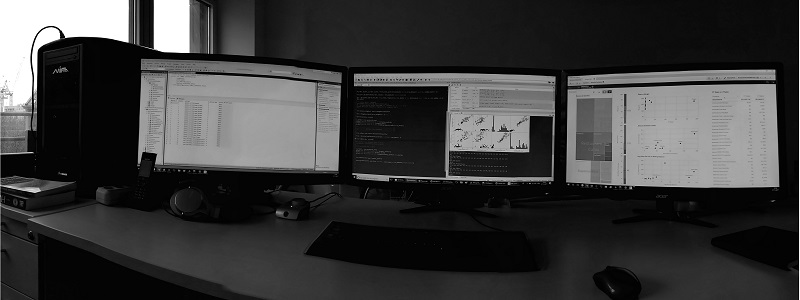
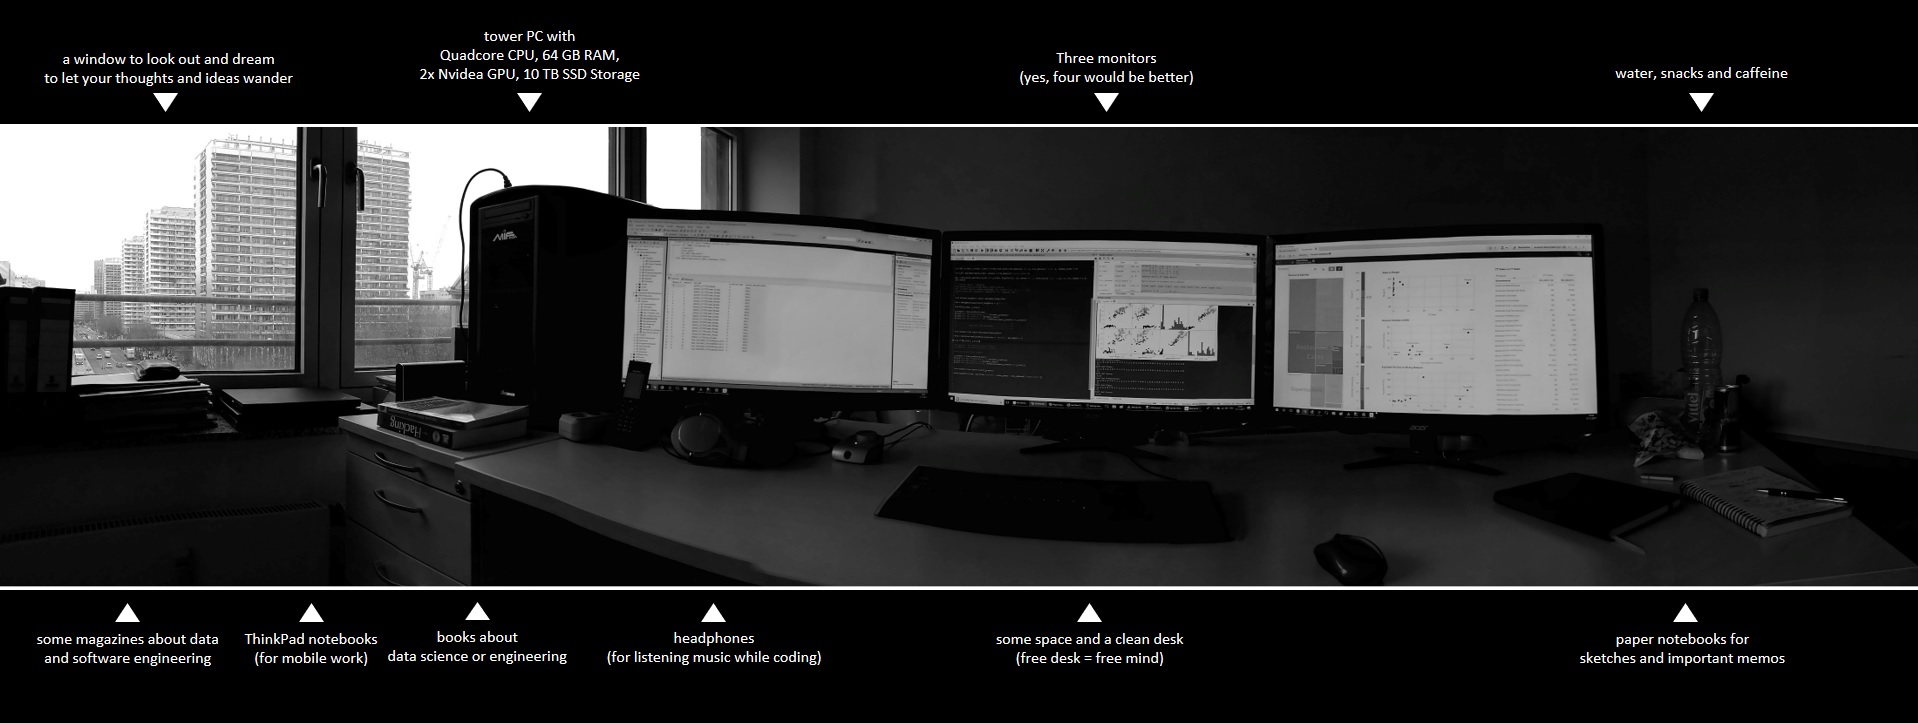
Here are some photos of my desk and my answers to the questions:

How many monitors do you use (or wish to have)?

I am mostly working at my desk in my office with a tower PC and three monitors.
I definitely need at least three monitors to work productively as a data scientist. Who does not know this: On the left monitor the data model is displayed, on the right monitor the data mapping and in the middle I do my work: programming the analysis scripts.

What hardware do you use? Apple? Dell? Lenovo? Others?

I am note an Apple guy. When I need to work mobile, I like to use ThinkPad notebooks. The ThinkPads are (in my experience) very robust and are therefore particularly good for mobile work. Besides, those notebooks look conservative and so I’m not sad if there comes a scratch on the notebook. However, I do not solve particularly challenging analysis tasks on a notebook, because I need my monitors for that.

Which OS do you use (or prefer)? MacOS, Linux, Windows? Virtual Machines?

As a data scientist, I have to be able to communicate well with my clients and they usually use Microsoft Windows as their operating system. I also use Windows as my main operating system. Of course, all our servers run on Linux Debian, but most of my tasks are done directly on Windows.
For some notebooks, I have set up a dual boot, because sometimes I need to start native Linux, for all other cases I work with virtual machines (Linux Ubuntu or Linux Mint).

What are your favorite databases, programming languages and tools?

I prefer the Microsoft SQL Server (T-SQL), C# and Python (pandas, numpy, scikit-learn). This is my world. But my customers are kings, therefore I am working with Postgre SQL, MongoDB, Neo4J, Tableau, Qlik Sense, Celonis and a lot more. I like to get used to new tools and technologies again and again. This is one of the benefits of being a data scientist.

Which data dou you analyze on your local hardware? Which in server clusters or clouds?

There have been few cases yet, where I analyzed really big data. In cases of analyzing big data we use horizontally scalable systems like Hadoop and Spark. But we also have customers analyzing middle-sized data (more than 10 TB but less than 100 TB) on one big server which is vertically scalable. Most of my customers just want to gather data to answer questions on not so big amounts of data. Everything less than 10TB we can do on a highend workstation.

If you use clouds, do you prefer Azure, AWS, Google oder others?

Microsoft Azure! I am used to tools provided by Microsoft and I think Azure is a well preconfigured cloud solution.

Where do you make your notes/memos/sketches. On paper or digital?

My calender is managed digital, because I just need to know everywhere what appointments I have. But my I prefer to wirte down my thoughts on paper and that´s why I have several paper-notebooks.

Now it is your turn: Join our Blog Parade!

So what does your workplace look like? Show your desk on your blog until 31/12/2017 and we will show a short introduction of your post here on the Data Science Blog!


Show your Data Science Workplace!

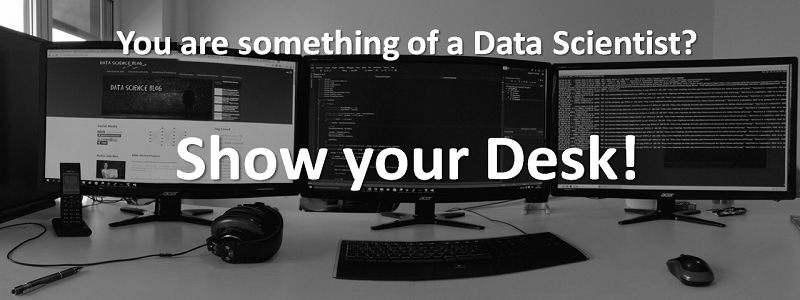
The job of a data scientist is often a mystery to outsiders. Of course, you do not really need much more than a medium-sized notebook to use data science methods for finding value in data. Nevertheless, data science workplaces can look so different and, let’s say, interesting. And that’s why I want to launch a blog parade – which I want to start with this article – where you as a Data Scientist or Data Engineer can show your workplace and explain what tools a data scientist in your opinion really needs.

I am very curious how many monitors you prefer, whether you use Apple, Dell, HP or Lenovo, MacOS, Linux or Windows, etc., etc. And of course, do you like a clean or messy desk?

What is a Blog Parade?

A blog parade is a call to blog owners to report on a specific topic. Everyone who participates in the blog parade, write on their blog a contribution to the topic. The organizer of the blog parade collects all the articles and will recap those articles in a short form together, of course with links to the articles.

How can I participate?

Write an article on your blog! Mention this blog parade here, show and explain your workplace (your desk with your technical equipment) in an article. If you’re missing your own blog, articles can also be posted directly to LinkedIn (LinkedIn has its own blogging feature that every LinkedIn member can use). Alternative – as a last resort – it would also be possible to send me your article with a photo about your workplace directly to: redaktion@data-science-blog.com.
Please make me aware of an article, via e-mail or with a comment (below) on this article.

Who can participate?

Any data scientist or anyone close to Data Science: Everyone concerned with topics such as data analytics, data engineering or data security. Please do not over-define data science here, but keep it in a nutshell, so that all professionals who manage and analyze data can join in with a clear conscience.

And yes, I will participate too. I will propably be the first who write an article about my workplace (I just need a new photo of my desk).

When does the article have to be finished?

By 31/12/2017, the article must have been published on your blog (or LinkedIn or wherever) and the release has to be reported to me.
But beware: Anyone who has previously written an article will also be linked earlier. After all, reporting on your article will take place immediately after I hear about it.
If you publish an artcile tomorrow, it will be shown the day after tomorrow here on the Data Science Blog.

What is in it for me to join?

Nothing! Except perhaps the fun factor of sharing your idea of ​​a nice desk for a data expert with others, so as to share creativity or a certain belief in what a data scientist needs.
Well and for bloggers: There is a great backlink from this data science blog for you 🙂

What should I write? What are the minimum requirements of content?

The article does not have to (but may be) particularly long. Anyway, here on this data science blog only a shortened version of your article will appear (with a link, of course).

Minimum requirments:

  • Show a photo (at least one!) of your workplace desk!
  • And tell us something about:
    • How many monitors do you use (or wish to have)?
    • What hardware do you use? Apple? Dell? Lenovo? Others?
    • Which OS do you use (or prefer)? MacOS, Linux, Windows? Virtual Machines?
    • What are your favorite databases, programming languages and tools? (e.g. Python, R, SAS, Postgre, Neo4J,…)
    • Which data dou you analyze on your local hardware? Which in server clusters or clouds?
    • If you use clouds, do you prefer Azure, AWS, Google oder others?
    • Where do you make your notes/memos/sketches. On paper or digital?

Not allowed:
Of course, please do not provide any information, which could endanger your company`s IT security.

Absolutly allowed:
Bringing some joke into the matter 🙂 We are happy to vote in the comments on the best or funniest desk for election, there may be also a winner later!


The resulting Blog Posts: https://data-science-blog.com/data-science-insights/show-your-desk/


The importance of domain knowledge – A healthcare data science perspective

Data scientists have (and need) many skills. They are frequently either former academic researchers or software engineers, with knowledge and skills in statistics, programming, machine learning, and many other domains of mathematics and computer science. These skills are general and allow data scientists to offer valuable services to almost any field. However, data scientists in some cases find themselves in industries they have relatively little knowledge of.

This is especially true in the healthcare field. In healthcare, there is an enormous amount of important clinical knowledge that might be relevant to a data scientist. It is unreasonable to expect a data scientist to not only have all of the skills typically required of a data scientist, but to also have all of the knowledge a medical professional may have.

Why is domain knowledge necessary?

This lack of domain knowledge, while perfectly understandable, can be a major barrier to healthcare data scientists. For one thing, it’s difficult to come up with project ideas in a domain that you don’t know much about. It can also be difficult to determine the type of data that may be helpful for a project – if you want to build a model to predict a health outcome (for example, whether a patient has or is likely to develop a gastrointestinal bleed), you need to know what types of variables might be related to this outcome so you can make sure to gather the right data.

Knowing the domain is useful not only for figuring out projects and how to approach them, but also for having rules of thumb for sanity checks on the data. Knowing how data is captured (is it hand-entered? Is it from machines that can give false readings for any number of reasons?) can help a data scientist with data cleaning and from going too far down the wrong path. It can also inform what true outliers are and which values might just be due to measurement error.

Often the most challenging part of building a machine learning model is feature engineering. Understanding clinical variables and how they relate to a health outcome is extremely important for this. Is a long history of high blood pressure important for predicting heart problems, or is only very recent history? How long a time horizon is considered ‘long’ or ‘short’ in this context? What other variables might be related to this health outcome? Knowing the domain can help direct the data exploration and greatly speed (and enhance) the feature engineering process.

Once features are generated, knowing what relationships between variables are plausible helps for basic sanity checks. If you’re finding the best predictor of hospitalization is the patient’s eye color, this might indicate an issue with your code. Being able to glance at the outcome of a model and determine if they make sense goes a long way for quality assurance of any analytical work.

Finally, one of the biggest reasons a strong understanding of the data is important is because you have to interpret the results of analyses and modeling work. Knowing what results are important and which are trivial is important for the presentation and communication of results. An analysis that determines there is a strong relationship between age and mortality is probably well-known to clinicians, while weaker but more surprising associations may be of more use. It’s also important to know what results are actionable. An analysis that finds that patients who are elderly are likely to end up hospitalized is less useful for trying to determine the best way to reduce hospitalizations (at least, without further context).

How do you get domain knowledge?

In some industries, such as tech, it’s fairly easy and straightforward to see an end-user’s prospective. By simply viewing a website or piece of software from the user’s point of view, a data scientist can gain a lot of the needed context and background knowledge needed to understand where their data is coming from and how their model output is being used. In the healthcare industry, it’s more difficult. A data scientist can’t easily choose to go through med school or the experience of being treated for a chronic illness. This means there is no easy single answer to where to gain domain knowledge. However, there are many avenues available.

Reading literature and attending presentations can boost one’s domain knowledge. However, it’s often difficult to find resources that are penetrable for someone who is not already a clinician. To gain deep knowledge, one needs to be steeped in the topic. One important avenue to doing this is through the establishment of good relationships with clinicians. Clinicians can be powerful allies that can help point you in the right direction for understanding your data, and simply by chatting with them you can gain important insights. They can also help you visit the clinics or practices to interact with the people that perform the procedures or even watch the procedures being done. At Fresenius Medical Care, where I work, members of my team regularly visit clinics. I have in the last year visited one of our dialysis clinics, a nephrology practice, and a vascular care unit. These experiences have been invaluable to me in developing my knowledge of the treatment of chronic illnesses.

In conclusion, it is crucial for data scientists to acquire basic familiarity in the field they are working in and in being part of collaborative teams that include people who are technically knowledgeable in the field they work in. This said, acquiring even an essential understanding (such as “Medicine 101”) may go a long way for the data scientists in being able to become self-sufficient in essential feature selection and design.


Data Science vs Data Engineering

The job of the Data Scientist is actually a fairly new trend, and yet other job titles are coming to us. “Is this really necessary?”, Some will ask. But the answer is clear: yes!

There are situations, every Data Scientist know: a recruiter calls, speaks about a great new challenge for a Data Scientist as you obviously claim on your LinkedIn profile, but in the discussion of the vacancy it quickly becomes clear that you have almost none of the required skills. This mismatch is mainly due to the fact that under the job of the Data Scientist all possible activity profiles, method and tool knowledge are summarized, which a single person can hardly learn in his life. Many open jobs, which are to be called under the name Data Science, describe rather the professional image of the Data Engineer.


Read this article in German:
“Data Science vs Data Engineering – Wo liegen die Unterschiede?“


What is a Data Engineer?

Data engineering is primarily about collecting or generating data, storing, historicalizing, processing, adapting and submitting data to subsequent instances. A Data Engineer, often also named as Big Data Engineer or Big Data Architect, models scalable database and data flow architectures, develops and improves the IT infrastructure on the hardware and software side, deals with topics such as IT Security , Data Security and Data Protection. A Data Engineer is, as required, a partial administrator of the IT systems and also a software developer, since he or she extends the software landscape with his own components. In addition to the tasks in the field of ETL / Data Warehousing, he also carries out analyzes, for example, to investigate data quality or user access. A Data Engineer mainly works with databases and data warehousing tools.

A Data Engineer is talented as an educated engineer or computer scientist and rather far away from the actual core business of the company. The Data Engineer’s career stages are usually something like:

  1. (Big) Data Architect
  2. BI Architect
  3. Senior Data Engineer
  4. Data Engineer

What makes a Data Scientist?

Although there may be many intersections with the Data Engineer’s field of activity, the Data Scientist can be distinguished by using his working time as much as possible to analyze the available data in an exploratory and targeted manner, to visualize the analysis results and to convert them into a red thread (storytelling). Unlike the Data Engineer, a data scientist rarely sees into a data center, because he picks up data via interfaces provided by the Data Engineer or provides by other resources.

A Data Scientist deals with mathematical models, works mainly with statistical procedures, and applies them to the data to generate knowledge. Common methods of Data Mining, Machine Learning and Predictive Modeling should be known to a Data Scientist. Data Scientists basically work close to the department and need appropriate expertise. Data Scientists use proprietary tools (e.g. Tools by IBM, SAS or Qlik) and program their own analyzes, for example, in Scala, Java, Python, Julia, or R. Using such programming languages and data science libraries (e.g. Mahout, MLlib, Scikit-Learn or TensorFlow) is often considered as advanced data science.

Data Scientists can have diverse academic backgrounds, some are computer scientists or engineers for electrical engineering, others are physicists or mathematicians, not a few have economical backgrounds. Common career levels could be:

  1. Chief Data Scientist
  2. Senior Data Scientist
  3. Data Scientist
  4. Data Analyst oder Junior Data Scientist

Data Scientist vs Data Analyst

I am often asked what the difference between a Data Scientist and a Data Analyst would be, or whether there would be a distinction criterion at all:

In my experience, the term Data Scientist stands for the new challenges for the classical concept of Data Analysts. A Data Analyst performs data analysis like a Data Scientist. More complex topics such as predictive analytics, machine learning or artificial intelligence are topics for a Data Scientist. In other words, a Data Scientist is a Data Analyst++ (one step above the Data Analyst).

And how about being a Business Analyst?

Business Analysts can (but need not) be Data Analysts. In any case, they have a very strong relationship with the core business of the company. Business Analytics is about analyzing business models and business successes. The analysis of business success is usually carried out by IT, and many business analysts are starting a career as Data Analyst now. Dashboards, KPIs and SQL are the tools of a good business analyst, but there might be a lot business analysts, who are just analysing business models by reading the newspaper…

Data Science Knowledge Stack – Abstraction of the Data Science Skillset

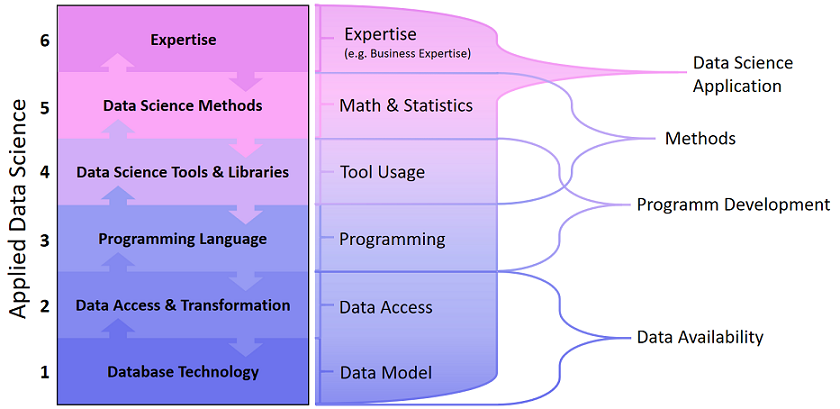
What must a Data Scientist be able to do? Which skills does as Data Scientist need to have? This question has often been asked and frequently answered by several Data Science Experts. In fact, it is now quite clear what kind of problems a Data Scientist should be able to solve and which skills are necessary for that. I would like to try to bring this consensus into a visual graph: a layer model, similar to the OSI layer model (which any data scientist should know too, by the way).
I’m giving introductory seminars in Data Science for merchants and engineers and in those seminars I always start explaining what we need to work out together in theory and practice-oriented exercises. Against this background, I came up with the idea for this layer model. Because with my seminars the problem already starts: I am giving seminars for Data Science for Business Analytics with Python. So not for medical analyzes and not with R or Julia. So I do not give a general knowledge of Data Science, but a very specific direction.

A Data Scientist must deal with problems at different levels in any Data Science project, for example, the data access does not work as planned or the data has a different structure than expected. A Data Scientist can spend hours debating its own source code or learning the ropes of new DataScience packages for its chosen programming language. Also, the right algorithms for data evaluation must be selected, properly parameterized and tested, sometimes it turns out that the selected methods were not the optimal ones. Ultimately, we are not doing Data Science all day for fun, but for generating value for a department and a data scientist is also faced with special challenges at this level, at least a basic knowledge of the expertise of that department is a must have.


Read this article in German:
“Data Science Knowledge Stack – Was ein Data Scientist können muss“


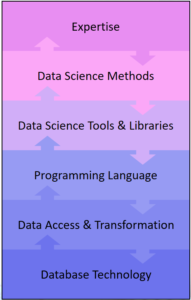
Data Science Knowledge Stack

With the Data Science Knowledge Stack, I would like to provide a structured insight into the tasks and challenges a Data Scientist has to face. The layers of the stack also represent a bidirectional flow from top to bottom and from bottom to top, because Data Science as a discipline is also bidirectional: we try to answer questions with data, or we look at the potentials in the data to answer previously unsolicited questions.
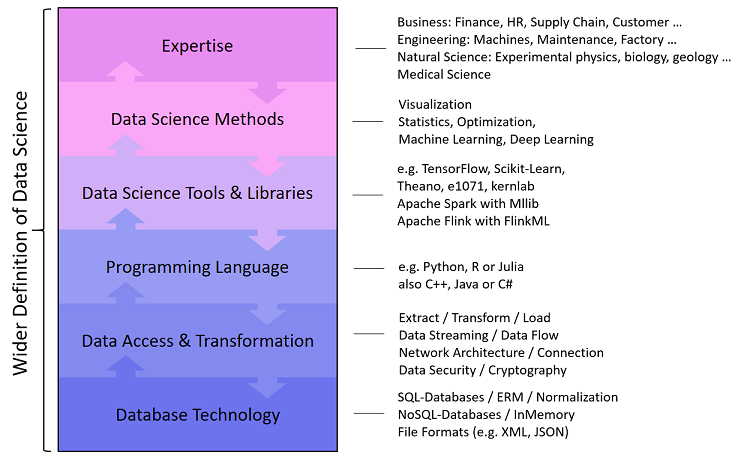
The DataScience Knowledge Stack consists of six layers:

Database Technology Knowledge

A Data Scientist works with data which is rarely directly structured in a CSV file, but usually in one or more databases that are subject to their own rules. In particular, business data, for example from the ERP or CRM system, are available in relational databases, often from Microsoft, Oracle, SAP or an open source alternative. A good Data Scientist is not only familiar with Structured Query Language (SQL), but is also aware of the importance of relational linked data models, so he also knows the principle of data table normalization.

Other types of databases, so-called NoSQL databases (Not only SQL) are based on file formats, column or graph orientation, such as MongoDB, Cassandra or GraphDB. Some of these databases use their own programming languages ​​(for example JavaScript at MongoDB or the graph-oriented database Neo4J has its own language called Cypher). Some of these databases provide alternative access via SQL (such as Hive for Hadoop).

A data scientist has to cope with different database systems and has to master at least SQL – the quasi-standard for data processing.

Data Access & Transformation Knowledge

If data are given in a database, Data Scientists can perform simple (and not so simple) analyzes directly on the database. But how do we get the data into our special analysis tools? To do this, a Data Scientist must know how to export data from the database. For one-time actions, an export can be a CSV file, but which separators and text qualifiers should be used? Possibly, the export is too large, so the file must be split.
If there is a direct and synchronous data connection between the analysis tool and the database, interfaces like REST, ODBC or JDBC come into play. Sometimes a socket connection must also be established and the principle of a client-server architecture should be known. Synchronous and asynchronous encryption methods should also be familiar to a Data Scientist, as confidential data are often used, and a minimum level of security is most important for business applications.

Many datasets are not structured in a database but are so-called unstructured or semi-structured data from documents or from Internet sources. And again we have interfaces, a frequent entry point for Data Scientists is, for example, the Twitter API. Sometimes we want to stream data in near real-time, let it be machine data or social media messages. This can be quite demanding, so the data streaming is almost a discipline with which a Data Scientist can come into contact quickly.

Programming Language Knowledge

Programming languages ​​are tools for Data Scientists to process data and automate processing. Data Scientists are usually no real software developers and they do not have to worry about software security or economy. However, a certain basic knowledge about software architectures often helps because some Data Science programs can be going to be integrated into an IT landscape of the company. The understanding of object-oriented programming and the good knowledge of the syntax of the selected programming languages ​​are essential, especially since not every programming language is the most useful for all projects.

At the level of the programming language, there is already a lot of snares in the programming language that are based on the programming language itself, as each has its own faults and details determine whether an analysis is done correctly or incorrectly: for example, whether data objects are copied or linked as reference, or how NULL/NaN values ​​are treated.

Data Science Tool & Library Knowledge

Once a data scientist has loaded the data into his favorite tool, for example, one of IBM, SAS or an open source alternative such as Octave, the core work just began. However, these tools are not self-explanatory and therefore there is a wide range of certification options for various Data Science tools. Many (if not most) Data Scientists work mostly directly with a programming language, but this alone is not enough to effectively perform statistical data analysis or machine learning: We use Data Science libraries (packages) that provide data structures and methods as a groundwork and thus extend the programming language to a real Data Science toolset. Such a library, for example Scikit-Learn for Python, is a collection of methods implemented in the programming language. The use of such libraries, however, is intended to be learned and therefore requires familiarization and practical experience for reliable application.

When it comes to Big Data Analytics, the analysis of particularly large data, we enter the field of Distributed Computing. Tools (frameworks) such as Apache Hadoop, Apache Spark or Apache Flink allows us to process and analyze data in parallel on multiple servers. These tools also provide their own libraries for machine learning, such as Mahout, MLlib and FlinkML.

Data Science Method Knowledge

A Data Scientist is not simply an operator of tools, he uses the tools to apply his analysis methods to data he has selected for to reach the project targets. These analysis methods are, for example, descriptive statistics, estimation methods or hypothesis tests. Somewhat more mathematical are methods of machine learning for data mining, such as clustering or dimensional reduction, or more toward automated decision making through classification or regression.

Machine learning methods generally do not work immediately, they have to be improved using optimization methods like the gradient method. A Data Scientist must be able to detect under- and overfitting, and he must prove that the prediction results for the planned deployment are accurate enough.

Special applications require special knowledge, which applies, for example, to the fields of image recognition (Visual Computing) or the processing of human language (Natural Language Processiong). At this point, we open the door to deep learning.

Expertise

Data Science is not an end in itself, but a discipline that would like to answer questions from other expertise fields with data. For this reason, Data Science is very diverse. Business economists need data scientists to analyze financial transactions, for example, to identify fraud scenarios or to better understand customer needs, or to optimize supply chains. Natural scientists such as geologists, biologists or experimental physicists also use Data Science to make their observations with the aim of gaining knowledge. Engineers want to better understand the situation and relationships between machinery or vehicles, and medical professionals are interested in better diagnostics and medication for their patients.

In order to support a specific department with his / her knowledge of data, tools and analysis methods, every data scientist needs a minimum of the appropriate skills. Anyone who wants to make analyzes for buyers, engineers, natural scientists, physicians, lawyers or other interested parties must also be able to understand the people’s profession.
Engere Data Science Definition

While the Data Science pioneers have long established and highly specialized teams, smaller companies are still looking for the Data Science Allrounder, which can take over the full range of tasks from the access to the database to the implementation of the analytical application. However, companies with specialized data experts have long since distinguished Data Scientists, Data Engineers and Business Analysts. Therefore, the definition of Data Science and the delineation of the abilities that a data scientist should have, varies between a broader and a more narrow demarcation.
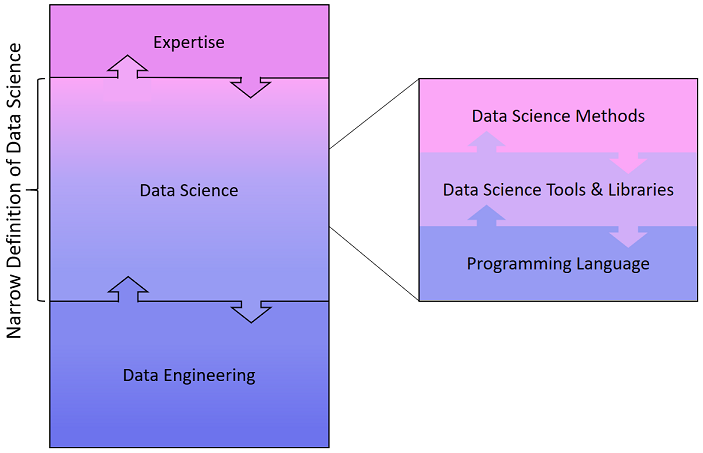

A closer look at the more narrow definition shows, that a Data Engineer takes over the data allocation, the Data Scientist loads it into his tools and runs the data analysis together with the colleagues from the department. According to this, a Data Scientist would need no knowledge of databases or APIs, neither an expertise would be necessary …

In my experience, DataScience is not that narrow, the task spectrum covers more than just the core area. This misunderstanding comes from Data Science courses and – for me – I should point to the overall picture of Data Science again and again. In courses and seminars, which want to teach Data Science as a discipline, the focus will of course be on the core area: programming, tools and methods from mathematics & statistics.

Data Science and Predictive Analytics in Healthcare

Doing data science in a healthcare company can save lives. Whether it’s by predicting which patients have a tumor on an MRI, are at risk of re-admission, or have misclassified diagnoses in electronic medical records are all examples of how predictive models can lead to better health outcomes and improve the quality of life of patients.  Nevertheless, the healthcare industry presents many unique challenges and opportunities for data scientists.

The impact of data science in healthcare

Healthcare providers have a plethora of important but sensitive data. Medical records include a diverse set of data such as basic demographics, diagnosed illnesses, and a wealth of clinical information such as lab test results. For patients with chronic diseases, there could be a long and detailed history of data available on a number of health indicators due to the frequency of visits to a healthcare provider. Information from medical records can often be combined with outside data as well. For example, a patient’s address can be combined with other publicly available information to determine the number of surgeons that practice near a patient or other relevant information about the type of area that patients reside in.

With this rich data about a patient as well as their surroundings, models can be built and trained to predict many outcomes of interest. One important area of interest is models predicting disease progression, which can be used for disease management and planning. For example, at Fresenius Medical Care (where we primarily care for patients with chronic conditions such as kidney disease), we use a Chronic Kidney Disease progression model that can predict the trajectory of a patient’s condition to help clinicians decide whether and when to proceed to the next stage in their medical care. Predictive models can also notify clinicians about patients who may require interventions to reduce risk of negative outcomes. For instance, we use models to predict which patients are at risk for hospitalization or missing a dialysis treatment. These predictions, along with the key factors driving the prediction, are presented to clinicians who can decide if certain interventions might help reduce the patient’s risk.

Challenges of data science in healthcare

One challenge is that the healthcare industry is far behind other sectors in terms of adopting the latest technology and analytics tools. This does present some challenges, and data scientists should be aware that the data infrastructure and development environment at many healthcare companies will not be at the bleeding edge of the field. However it also means there are a lot of opportunities for improvement, and even small simple models can yield vast improvements over current methods.

Another challenge in the healthcare sector arises from the sensitive nature of medical information. Due to concerns over data privacy, it can often be difficult to obtain access to data that the company has. For this reason, data scientists considering a position at a healthcare company should be aware of whether there is already an established protocol for data professionals to get access to the data. If there isn’t, be aware that simply getting access to the data may be a major effort in itself.

Finally, it is important to keep in mind the end-use of any predictive model. In many cases, there are very different costs to false-negatives and false-positives. A false-negative may be detrimental to a patient’s health, while too many false-positives may lead to many costly and unnecessary treatments (also to the detriment of patients’ health for certain treatments as well as economy overall). Education about the proper use of predictive models and their limitations is essential for end-users. Finally, making sure the output of a predictive model is actionable is important. Predicting that a patient is at high-risk is only useful if the model outputs is interpretable enough to explain what factors are putting that patient at risk. Furthermore, if the model is being used to plan interventions, the factors that can be changed need to be highlighted in some way – telling a clinician that a patient is at risk because of their age is not useful if the point of the prediction is to lower risk through intervention.

The future of data science in the healthcare sector

The future holds a lot of promise for data science in healthcare. Wearable devices that track all kinds of activity and biometric data are becoming more sophisticated and more common. Streaming data coming from either wearables or devices providing treatment (such as dialysis machines) could eventually be used to provide real-time alerts to patients or clinicians about health events outside of the hospital.

Currently, a major issue facing medical providers is that patients’ data tends to exist in silos. There is little integration across electronic medical record systems (both between and within medical providers), which can lead to fragmented care. This can lead to clinicians receiving out of date or incomplete information about a patient, or to duplication of treatments. Through a major data engineering effort, these systems could (and should) be integrated. This would vastly increase the potential of data scientists and data engineers, who could then provide analytics services that took into account the whole patients’ history to provide a level of consistency across care providers. Data workers could use such an integrated record to alert clinicians to duplications of procedures or dangerous prescription drug combinations.

Data scientists have a lot to offer in the healthcare industry. The advances of machine learning and data science can and should be adopted in a space where the health of individuals can be improved. The opportunities for data scientists in this sector are nearly endless, and the potential for good is enormous.