Simple RNN

Understanding LSTM forward propagation in two ways

*This article is only for the sake of understanding the equations in the second page of the paper named “LSTM: A Search Space Odyssey”. If you have no trouble understanding the equations of LSTM forward propagation, I recommend you to skip this article and go the the next article.

1. Preface

I  heard that in Western culture, smart people write textbooks so that other normal people can understand difficult stuff, and that is why textbooks in Western countries tend to be bulky, but also they are not so difficult as they look. On the other hand in Asian culture, smart people write puzzling texts on esoteric topics, and normal people have to struggle to understand what noble people wanted to say. Publishers also require the authors to keep the texts as short as possible, so even though the textbooks are thin, usually students have to repeat reading the textbooks several times because usually they are too abstract.

Both styles have cons and pros, and usually I prefer Japanese textbooks because they are concise, and sometimes it is annoying to read Western style long texts with concrete straightforward examples to reach one conclusion. But a problem is that when it comes to explaining LSTM, almost all the text books are like Asian style ones. Every study material seems to skip the proper steps necessary for “normal people” to understand its algorithms. But after actually making concrete slides on mathematics on LSTM, I understood why: if you write down all the equations on LSTM forward/back propagation, that is going to be massive, and actually I had to make 100-page PowerPoint animated slides to make it understandable to people like me.

I already had a feeling that “Does it help to understand only LSTM with this precision? I should do more practical codings.” For example François Chollet, the developer of Keras, in his book, said as below.


For me that sounds like “We have already implemented RNNs for you, so just shut up and use Tensorflow/Keras.” Indeed, I have never cared about the architecture of my Mac Book Air, but I just use it every day, so I think he is to the point. To make matters worse, for me, a promising algorithm called Transformer seems to be replacing the position of LSTM in natural language processing. But in this article series and in my PowerPoint slides, I tried to explain as much as possible, contrary to his advice.

But I think, or rather hope,  it is still meaningful to understand this 23-year-old algorithm, which is as old as me. I think LSTM did build a generation of algorithms for sequence data, and actually Sepp Hochreiter, the inventor of LSTM, has received Neural Network Pioneer Award 2021 for his work.

I hope those who study sequence data processing in the future would come to this article series, and study basics of RNN just as I also study classical machine learning algorithms.

 *In this article “Densely Connected Layers” is written as “DCL,” and “Convolutional Neural Network” as “CNN.”

2. Why LSTM?

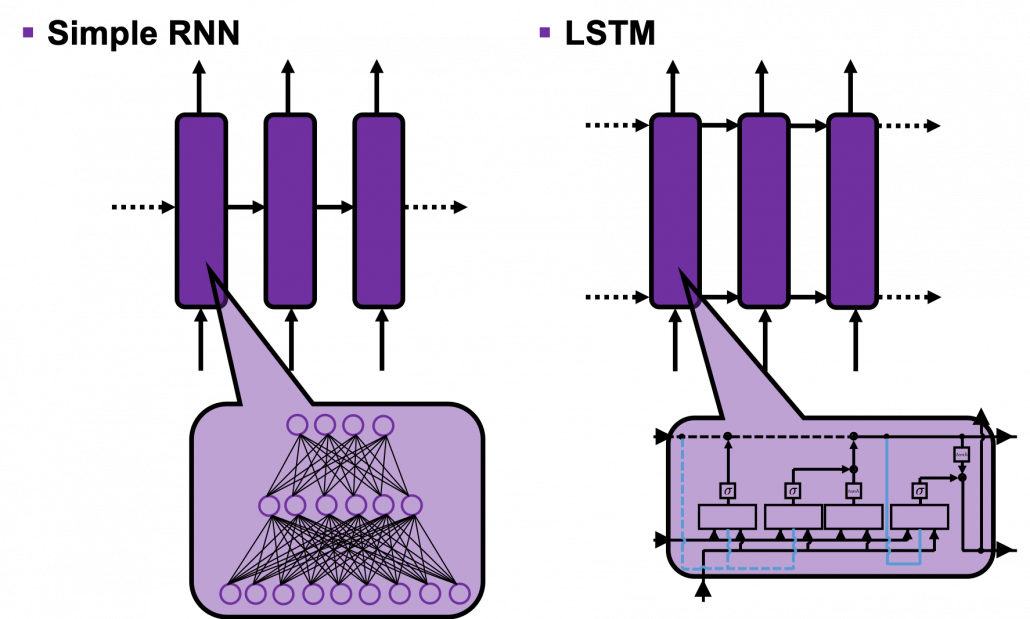
First of all, let’s take a brief look at what I said about the structures of RNNs,  in the first and the second article. A simple RNN is basically densely connected network with a few layers. But the RNN gets an input every time step, and it gives out an output at the time step. Part of information in the middle layer are succeeded to the next time step, and in the next time step, the RNN also gets an input and gives out an output. Therefore, virtually a simple RNN behaves almost the same way as densely connected layers with many layers during forward/back propagation if you focus on its recurrent connections.
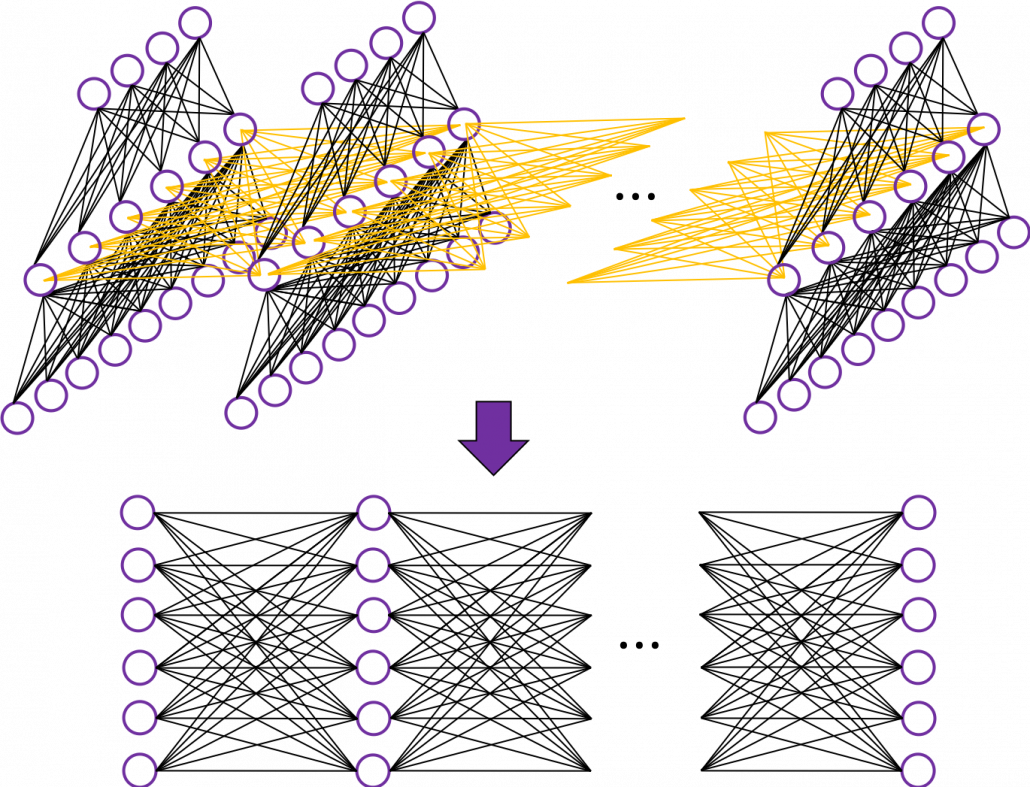
That is why simple RNNs suffer from vanishing/exploding gradient problems, where the information exponentially vanishes or explodes when its gradients are multiplied many times through many layers during back propagation. To be exact, I think you need to consider this problem precisely like you can see in this paper. But for now, please at least keep it in mind that when you calculate a gradient of an error function with respect to parameters of simple neural networks, you have to multiply parameters many times like below, and this type of calculation usually leads to vanishing/exploding gradient problem.

LSTM was invented as a way to tackle such problems as I mentioned in the last article.

3. How to display LSTM

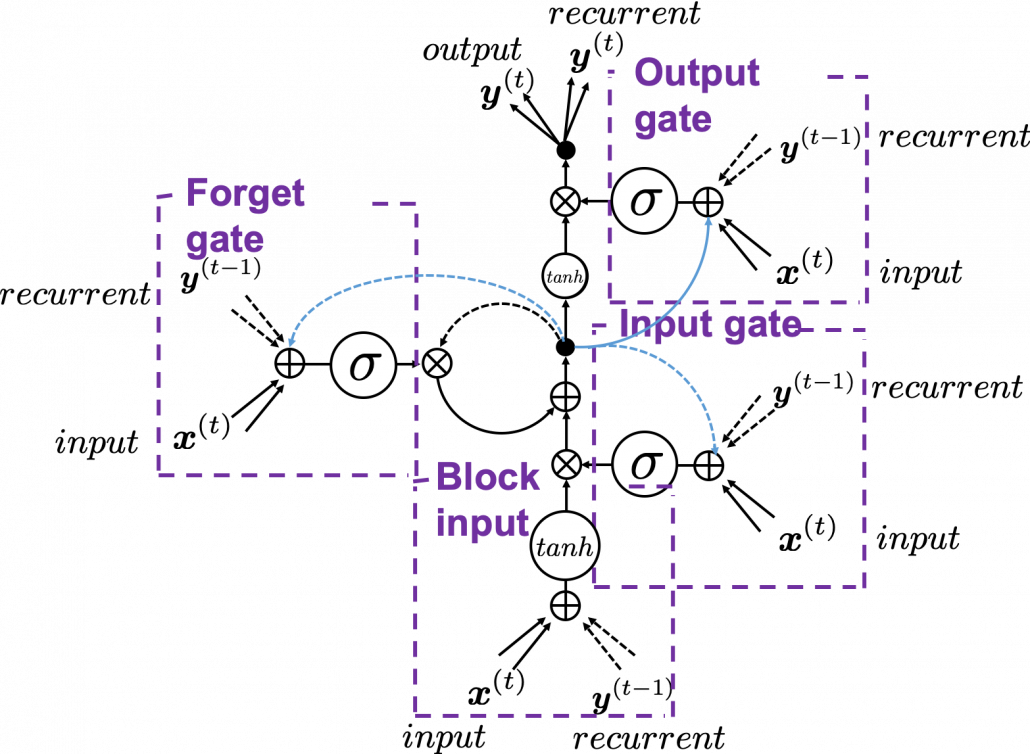
I would like you to just go to image search on Google, Bing, or Yahoo!, and type in “LSTM.” I think you will find many figures, but basically LSTM charts are roughly classified into two types: in this article I call them “Space Odyssey type” and “electronic circuit type”, and in conclusion, I highly recommend you to understand LSTM as the “electronic circuit type.”

*I just randomly came up with the terms “Space Odyssey type” and “electronic circuit type” because the former one is used in the paper I mentioned, and the latter one looks like an electronic circuit to me. You do not have to take how I call them seriously.

However, not that all the well-made explanations on LSTM use the “electronic circuit type,” and I am sure you sometimes have to understand LSTM as the “space odyssey type.” And the paper “LSTM: A Search Space Odyssey,” which I learned a lot about LSTM from,  also adopts the “Space Odyssey type.”

LSTM architectur visualization

The main reason why I recommend the “electronic circuit type” is that its behaviors look closer to that of simple RNNs, which you would have seen if you read my former articles.

*Behaviors of both of them look different, but of course they are doing the same things.

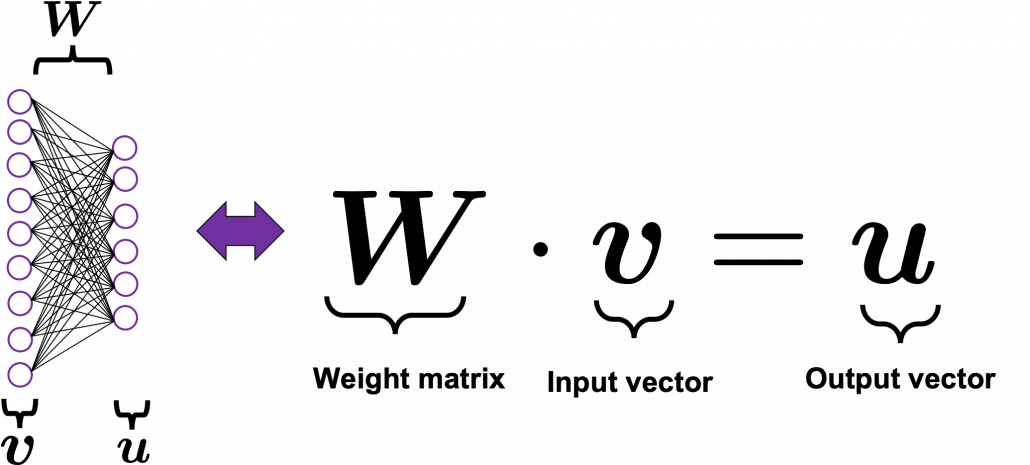
If you have some understanding on DCL, I think it was not so hard to understand how simple RNNs work because simple RNNs  are mainly composed of linear connections of neurons and weights, whose structures are the same almost everywhere. And basically they had only straightforward linear connections as you can see below.

But from now on, I would like you to give up the ideas that LSTM is composed of connections of neurons like the head image of this article series. If you do that, I think that would be chaotic and I do not want to make a figure of it on Power Point. In short, sooner or later you have to understand equations of LSTM.

4. Forward propagation of LSTM in “electronic circuit type”

*For further understanding of mathematics of LSTM forward/back propagation, I recommend you to download my slides.

The behaviors of an LSTM block is quite similar to that of a simple RNN block: an RNN block gets an input every time step and gets information from the RNN block of the last time step, via recurrent connections. And the block succeeds information to the next block.

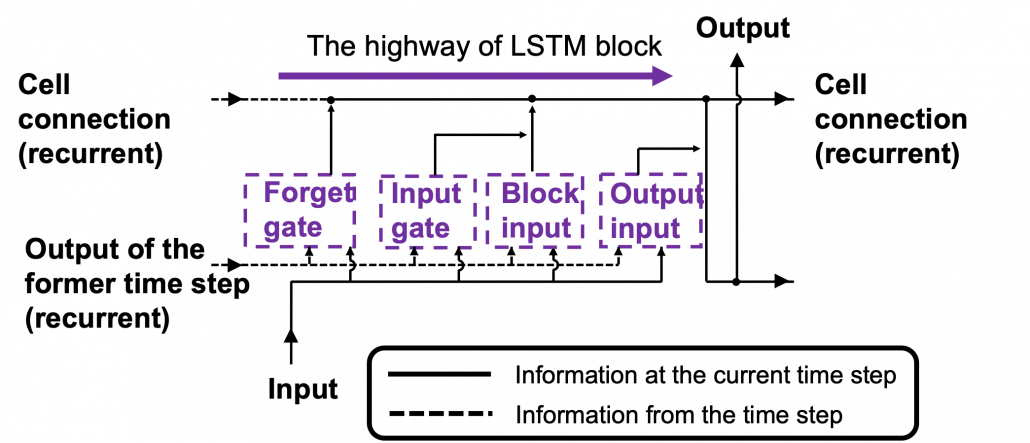
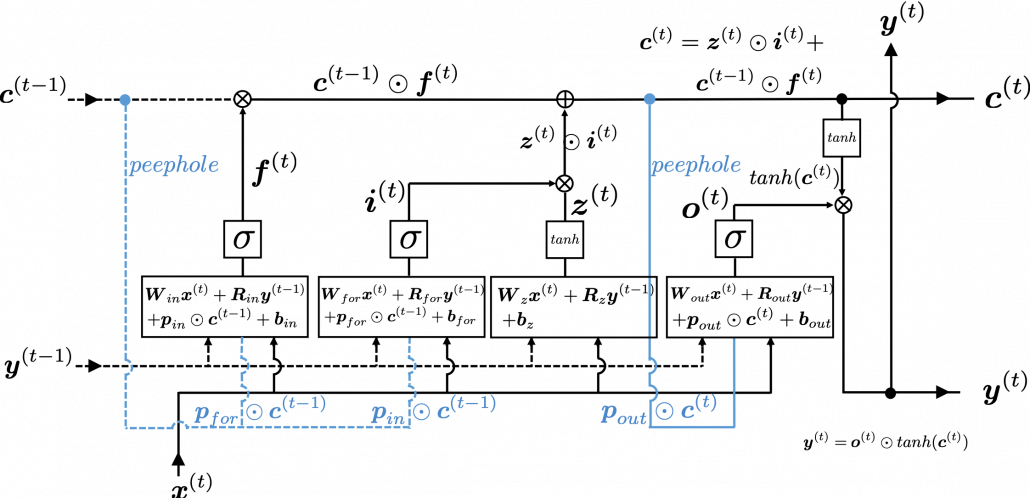
Let’s look at the simplified architecture of  an LSTM block. First of all, you should keep it in mind that LSTM have two streams of information: the one going through all the gates, and the one going through cell connections, the “highway” of LSTM block. For simplicity, we will see the architecture of an LSTM block without peephole connections, the lines in blue. The flow of information through cell connections is relatively uninterrupted. This helps LSTMs to retain information for a long time.

In a LSTM block, the input and the output of the former time step separately go through sections named “gates”: input gate, forget gate, output gate, and block input. The outputs of the forget gate, the input gate, and the block input join the highway of cell connections to renew the value of the cell.

*The small two dots on the cell connections are the “on-ramp” of cell conection highway.

*You would see the terms “input gate,” “forget gate,” “output gate” almost everywhere, but how to call the “block gate” depends on textbooks.

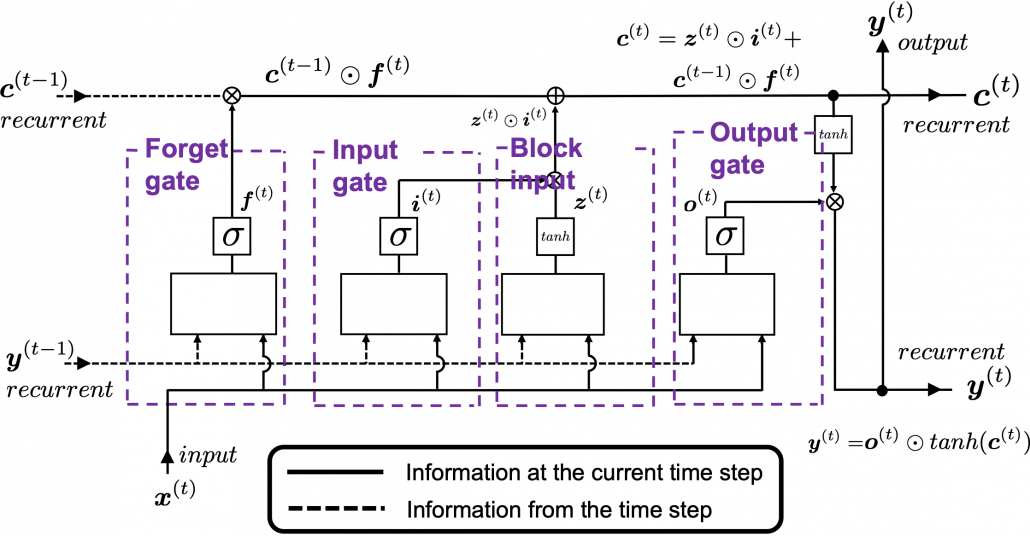
Let’s look at the structure of an LSTM block a bit more concretely. An LSTM block at the time step (t) gets \boldsymbol{y}^{(t-1)}, the output at the last time step,  and \boldsymbol{c}^{(t-1)}, the information of the cell at the time step (t-1), via recurrent connections. The block at time step (t) gets the input \boldsymbol{x}^{(t)}, and it separately goes through each gate, together with \boldsymbol{y}^{(t-1)}. After some calculations and activation, each gate gives out an output. The outputs of the forget gate, the input gate, the block input, and the output gate are respectively \boldsymbol{f}^{(t)}, \boldsymbol{i}^{(t)}, \boldsymbol{z}^{(t)}, \boldsymbol{o}^{(t)}. The outputs of the gates are mixed with \boldsymbol{c}^{(t-1)} and the LSTM block gives out an output \boldsymbol{y}^{(t)}, and gives \boldsymbol{y}^{(t)} and \boldsymbol{c}^{(t)} to the next LSTM block via recurrent connections.

You calculate \boldsymbol{f}^{(t)}, \boldsymbol{i}^{(t)}, \boldsymbol{z}^{(t)}, \boldsymbol{o}^{(t)} as below.

  • \boldsymbol{f}^{(t)}= \sigma(\boldsymbol{W}_{for} \boldsymbol{x}^{(t)} + \boldsymbol{R}_{for} \boldsymbol{y}^{(t-1)} +  \boldsymbol{b}_{for})
  • \boldsymbol{i}^{(t)}=\sigma(\boldsymbol{W}_{in} \boldsymbol{x}^{(t)} + \boldsymbol{R}_{in} \boldsymbol{y}^{(t-1)} + \boldsymbol{b}_{in})
  • \boldsymbol{z}^{(t)}=tanh(\boldsymbol{W}_z \boldsymbol{x}^{(t)} + \boldsymbol{R}_z \boldsymbol{y}^{(t-1)} + \boldsymbol{b}_z)
  • \boldsymbol{o}^{(t)}=\sigma(\boldsymbol{W}_{out} \boldsymbol{x}^{(t)} + \boldsymbol{R}_{out} \boldsymbol{y}^{(t-1)} + \boldsymbol{b}_{out})

*You have to keep it in mind that the equations above do not include peephole connections, which I am going to show with blue lines in the end.

The equations above are quite straightforward if you understand forward propagation of simple neural networks. You add linear products of \boldsymbol{y}^{(t)} and \boldsymbol{c}^{(t)} with different weights in each gate. What makes LSTMs different from simple RNNs is how to mix the outputs of the gates with the cell connections. In order to explain that, I need to introduce a mathematical operator called Hadamard product, which you denote as \odot. This is a very simple operator. This operator produces an elementwise product of two vectors or matrices with identical shape.

With this Hadamar product operator, the renewed cell and the output are calculated as below.

  • \boldsymbol{c}^{(t)} = \boldsymbol{z}^{(t)}\odot \boldsymbol{i}^{(t)} + \boldsymbol{c}^{(t-1)} \odot \boldsymbol{f}^{(t)}
  • \boldsymbol{y}^{(t)} = \boldsymbol{o}^{(t)} \odot tanh(\boldsymbol{c}^{(t)})

The values of \boldsymbol{f}^{(t)}, \boldsymbol{i}^{(t)}, \boldsymbol{z}^{(t)}, \boldsymbol{o}^{(t)} are compressed into the range of [0, 1] or [-1, 1] with activation functions. You can see that the input gate and the block input give new information to the cell. The part \boldsymbol{c}^{(t-1)} \odot \boldsymbol{f}^{(t)} means that the output of the forget gate “forgets” the cell of the last time step by multiplying the values from 0 to 1 elementwise. And the cell \boldsymbol{c}^{(t)} is activated with tanh() and the output of the output gate “suppress” the activated value of \boldsymbol{c}^{(t)}. In other words, the output gatedecides how much information to give out as an output of the LSTM block. The output of every gate depends on the input \boldsymbol{x}^{(t)}, and the recurrent connection \boldsymbol{y}^{(t-1)}. That means an LSTM block learns to forget the cell of the last time step, to renew the cell, and to suppress the output. To describe in an extreme manner, if all the outputs of every gate are always (1, 1, …1)^T, LSTMs forget nothing, retain information of inputs at every time step, and gives out everything. And  if all the outputs of every gate are always (0, 0, …0)^T, LSTMs forget everything, receive no inputs, and give out nothing.

This model has one problem: the outputs of each gate do not directly depend on the information in the cell. To solve this problem, some LSTM models introduce some flows of information from the cell to each gate, which are shown as lines in blue in the figure below.

LSTM inner architecture

LSTM models, for example the one with or without peephole connection, depend on the library you use, and the model I have showed is one of standard LSTM structure. However no matter how complicated structure of an LSTM block looks, you usually cover it with a black box as below and show its behavior in a very simplified way.

5. Space Odyssey type

I personally think there is no advantages of understanding how LSTMs work with this Space Odyssey type chart, but in several cases you would have to use this type of chart. So I will briefly explain how to look at that type of chart, based on understandings of LSTMs you have gained through this article.

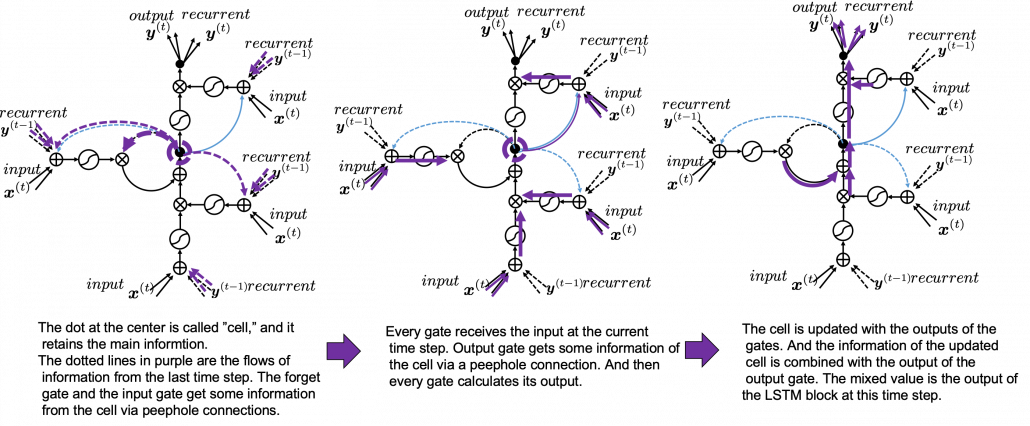
In Space Odyssey type of LSTM chart, at the center is a cell. Electronic circuit type of chart, which shows the flow of information of the cell as an uninterrupted “highway” in an LSTM block. On the other hand, in a Spacey Odyssey type of chart, the information of the cell rotate at the center. And each gate gets the information of the cell through peephole connections,  \boldsymbol{x}^{(t)}, the input at the time step (t) , sand \boldsymbol{y}^{(t-1)}, the output at the last time step (t-1), which came through recurrent connections. In Space Odyssey type of chart, you can more clearly see that the information of the cell go to each gate through the peephole connections in blue. Each gate calculates its output.

Just as the charts you have seen, the dotted line denote the information from the past. First, the information of the cell at the time step (t-1) goes to the forget gate and get mixed with the output of the forget cell In this process the cell is partly “forgotten.” Next, the input gate and the block input are mixed to generate part of new value of the the cell at time step  (t). And the partly “forgotten” \boldsymbol{c}^{(t-1)} goes back to the center of the block and it is mixed with the output of the input gate and the block input. That is how \boldsymbol{c}^{(t)} is renewed. And the value of new cell flow to the top of the chart, being mixed with the output of the output gate. Or you can also say the information of new cell is “suppressed” with the output gate.

I have finished the first four articles of this article series, and finally I am gong to write about back propagation of LSTM in the next article. I have to say what I have written so far is all for the next article, and my long long Power Point slides.


[References]

[1] Klaus Greff, Rupesh Kumar Srivastava, Jan Koutník, Bas R. Steunebrink, Jürgen Schmidhuber, “LSTM: A Search Space Odyssey,” (2017)

[2] Francois Chollet, Deep Learning with Python,(2018), Manning , pp. 202-204

[3] “Sepp Hochreiter receives IEEE CIS Neural Networks Pioneer Award 2021”, Institute of advanced research in artificial intelligence, (2020)
URL: https://www.iarai.ac.at/news/sepp-hochreiter-receives-ieee-cis-neural-networks-pioneer-award-2021/?fbclid=IwAR27cwT5MfCw4Tqzs3MX_W9eahYDcIFuoGymATDR1A-gbtVmDpb8ExfQ87A

[4] Oketani Takayuki, “Machine Learning Professional Series: Deep Learning,” (2015), pp. 120-125
岡谷貴之 著, 「機械学習プロフェッショナルシリーズ 深層学習」, (2015), pp. 120-125

[5] Harada Tatsuya, “Machine Learning Professional Series: Image Recognition,” (2017), pp. 252-257
原田達也 著, 「機械学習プロフェッショナルシリーズ 画像認識」, (2017), pp. 252-257

[6] “Understandable LSTM ~ With the Current Trends,” Qiita, (2015)
「わかるLSTM ~ 最近の動向と共に」, Qiita, (2015)
URL: https://qiita.com/t_Signull/items/21b82be280b46f467d1b

Must-have Skills to Master Data Science

The need to process a massive amount of data sets is making Data Science the most-demanded job across diverse industry verticals. In today’s times, organizations are actively looking for Data Scientists.

But What does a Data Scientist do?

Data Scientist design data models, create various algorithms to extract the data the organization needs, and then they analyze the gathered data and communicate the data insights with the business stakeholders.

If you are looking forward to pursuing a career in Data Science, then this blog is for you 🙂

Data Scientists often come from many different educational and work experience backgrounds but few skills are common and essential.

Let’s have a look at all the essential skills required to become a Data Scientist:

  1. Multivariable Calculus & Linear Algebra
  2. Probability & Statistics
  3. Programming Skills (Python & R)
  4. Machine Learning Algorithms
  5. Data Visualization
  6. Data Wrangling
  7. Data Intuition

Let’s dive deeper into all these skills one by one.

Multivariable Calculus & Linear Algebra:

Having a solid understanding of math concepts is very helpful for a Data Scientist.

Key Concepts:

  • Matrices
  • Linear Algebra Functions
  • Derivatives and Gradient
  • Relational Algebra

Probability & Statistics:

Probability and Statistics play a major role in Data Science for estimation and prediction purposes.

Key concepts required:

  • Probability Distributions
  • Conditional Probability
  • Bayesian Thinking
  • Descriptive Statistics
  • Random Variables
  • Hypothesis Testing and Regression
  • Maximum Likelihood Estimation

Programming Skills (Python & R):

Python :

Start with Python Fundamentals using a jupyter notebook, which comes pre-packaged with Python libraries.

Important Python Libraries used:

  • NumPy (For Data Exploration)
  • Pandas (For Data Exploration)
  • Matplotlib (For Data Visualization)

R:

It is a programming language and software environment used for statistical computing and graphics. 

Key Concepts required:

  • R Languages fundamentals and basic syntax
  • Vectors, Matrices, Factors
  • Data frames
  • Basic Graphics

Machine Learning Algorithms

Machine Learning is an innovative and essential field in the industry. There are quite a few algorithms out there, major ones are as follows –

  • Linear Regression
  • Logistic Regression
  • Decision Trees
  • Random Forest
  • Naïve Bayes
  • Support Vector Machines
  • Dimensionality Reduction
  • K-means
  • Artificial Neural Networks

Data Visualization:

Data visualization is very essential when it comes to analyzing a massive amount of information and data. 

To make data-driven decisions, data visualization tools, and technologies are essential in the world of Data Science.

Data Visualization tools:

  • Tableau
  • Microsoft Power Bi
  • E Charts
  • Datawrapper
  • HighCharts

Data Wrangling:

Data wrangling, this term refers to the process of cleaning and refining the messy and complex data available into a more usable format. 

It is considered one of the most crucial parts of working with data.

Important Steps to Data Wrangling:

  1. Discovering
  2. Structuring
  3. Cleaning
  4. Enriching
  5. Validating
  6. Documenting

Tools used:

  • Tabula
  • Google DataPrep
  • Data Wrangler
  • CSVkit

Data Wrangling can be done using Python and R.

Data Intuition:

Data Intuition in Data Science is an intuitive understanding of concepts. It’s one of the most significant skills required to become a Data Scientist.

It’s about recognizing patterns where none are observable on the surface.

This is something that you need to develop. It is a skill that will only come with experience.

A Data Scientist should know which Data Science methods to apply to the problem at hand.

Conclusion:

 As you can see, all these skills – from programming to algorithmic methods, work with one another to build on top of each other for gathering deeper data insights.

There are a wide number of courses available online for developing these skills and to help you become a true talent in this data industry.

Sure, this journey isn’t an easy one to follow but it’s not impossible. With sheer determination and consistency, you will be able to cross all the hurdles in your Data Science career path.

AI Voice Assistants are the Next Revolution: How Prepared are You?

By 2022, voice-based shopping is predicted to rise to USD 40 billion, based on the data from OC&C Strategy Consultants. We’re in an era of ‘voice’ where drastic transformation is seen between the way AI and voice recognition are changing the way we live.

According to the survey, the surge of voice assistants is said to be driven by the number of homes that used smart speakers, as such that the rise is seen to grow from 13% to 55%. Nonetheless, Amazon will be one of the leaders to dominate the new channel having the largest market share.

Perhaps this is the first time you’ve heard about the voice revolution. Well, why not, based on multiple researchers, it is estimated that the number of voice assistants will grow to USD 8 billion by 2023 from USD 2.5 billion in 2018.

But what is voice revolution or voice assistant or voice search?

It was only until recently that the consumers have started learning about voice assistants which further predicts to exist in the future.

You’ve heard of Alexa, Cortana, Siri, and Google Assistant, these technologies are some of the world’s greatest examples of voice assistants. They will further help to drive consumer behavior as well as prepare the companies and adjust based on the industry demands. Consumers can now transform the way they act, search, and advertise their brand through voice technology.

Voice search is a technology to help users or consumers perform a search on the website by simply asking a question on their smartphone, their computer, or their smart device.

The voice assistant awareness: Why now?

As surveyed by PwC, amongst the 90% respondents, about 72% have been recorded to use voice assistant while merely 10% said they were clueless about voice-enabled devices and products. It is noted, the adoption of voice-enabled was majorly driven by children, young consumers, and households earning an income of around >USD100k.

Let us have a glance to ensure the devices that are used mainly for voice assistance: –

  • Smartphone – 57%
  • Desktop – 29%
  • Tablet – 29%
  • Laptop – 29%
  • Speaker – 27%
  • TV remote – 21%
  • Car navigation – 20%
  • Wearable – 14%

According to the survey, most consumers that use voice-assistants were the younger generation, aged between 18-24.

While individuals between the ages 25-49 were said to use these technologies in a much more statistical manner, and are called the “heavy users.”

Significance of mobile voice assistants: What is the need?

Although mobile is accessible everywhere, you will merely find three out of four consumers using mobile voice assistants in their household i.e. 74%.

Mobile-based AI chatbots have taken our lives by storm, thus providing the best solution to both the customers and agents in varied areas – insurance, travel, and education, etc.

A certain group of individuals said they needed privacy while speaking to their device and that sending a voice command in public is weird.

Well, this simply explains why 18-24 aged group individuals prefer less use of voice assistants. However, this age group tends to spend more time out of their homes.

Situations where voice assistants can be used – standalone speakers Vs mobile

Cooking

  • Standalone speakers – 65%
  • Mobile – 37%

Multitasking

  • Standalone speakers – 62%
  • Mobile – 12%

Watching TV

  • Standalone speakers – 57%
  • Mobile – 43%

In bed

  • Standalone speakers – 38%
  • Mobile – 37%

Working

  • Standalone speakers – 29%
  • Mobile – 25%

Driving

  • Standalone speakers – 0%
  • Mobile – 40%

By the end of 2020, nearly half of all the searches made will be voice-based, as predicted by Comscore, a media analytics firm.

Don’t you think voice-based assistant is changing the way businesses function? Thanks to the advent of AI!

  • A 2018 study on AI chatbots and voice assistants by Spiceworks said, 24% of businesses that were spread largely, and 16% of smaller businesses have already started using AI technologies in their workplaces. While 25% of the business market is expected to adopt AI within the next 12 months.

Surprisingly, voice-based assistants such as Siri, Google Assistant, and Cortana are some of the most prominent technologies these businesses are using in their workstations.

Where will the next AI voice revolution take us?

Voice-authorized transactions

Paypal, an online payment gateway now leverages Siri and Alexa’s voice recognition capability, thus, allowing users to make payments, check their balance, and ask payments from people via voice command.

Voice remote control – AI-powered

Communications conglomerate Comcast, an American telecommunications and media conglomerate introduces their first-ever X1 voice remote control that provides both natural image processing and voice recognition.

With the help of deep learning, the X1 can easily come up with better search results with just a press of the button telling what your television needs to do next.

Voice AI-enabled memos and analytics

Salesforce recently unveiled Einstein Voice which is an AI assistant that helps in entering critical data the moment it hears, making use of the voice command. This AI assistant also initiates in interpreting voice memos. Besides this, the voice bots accompanying Einstein Voice also helps the company create their customized voice bots to answer customer queries.

Voice-activated ordering

It is astonishing to see how Domino’s is using voice-activated feature automate orders made over the phone by customers. Well, welcome to the era of voice revolution.

This app, developed by Nuance Communications already has a Siri like voice recognition feature that allows customers to place their orders just like how they would be doing it in front of the cash counter making your order to take place efficiently.

As more businesses look forward to breaking down the roadblocks between a consumer and a brand, voice search now projects to become an impactful technology of bridging the gap.

Data Science – A Beautiful Data Driven Journey

Data Science is a profession related to processing algorithms and extracting deep insights from raw data. It depicts the importance of data and how it can be used in business and to make IT strategies. For recognizing the new ventures available in the market, identifying the patterns and to make better business decisions, data science is of utmost significance.  It is the duty of data scientists to convert raw data into relevant business information. They hold a center stage in developing the data products by carrying out experiments, analyzing them by using scientific methods and using their skill set. Spotting the growing trends and capitalizing on it before the competition to gain advantage.

TRAITS REQUIRED FOR DATA SCIENCE:

Data Scientists are not born intellectuals; they continuously work to gain all the skills expected by the companies as the demand surpasses the supply of applicants. Here are a few skills of data scientists:

  • Curiosity and Intuition to identify the hidden meaning of data and able to visualize.
  • Need to have leadership skills and have a business savvy mind to identify risks and opportunities.
  • A bachelor’s degree in math, IT, statistics along with a letter of recommendation which will help in knowing your acquired range of knowledge.
  • Specialized skills in machine learning, clustering and segmentation, exploration of data, Statistical research which helps in finances and increasing the profits of companies including modeling.
  • Familiarity and strong hold with programming languages such as hadoop, python, perl, R, etc.

BENEFITS OF DATA SCIENCE:

There are many advantages depending on the aim and interest of the company. Sales and Marketing departments, for example collect information from a particular industry and determine which products interest the customer the most and recommend for their production, be it online shopping goods, some online series or which shipment companies are best. They also help in detection of bank fraud. Data Science currently is a raging industry with well paid professionals. The amount of knowledge acquired through this course makes it a bonus for a better and lucrative career.

APPLICATIONS OF DATA SCIENCE:

Data Science has become a significant field in almost all sectors ranging from healthcare, internet searches, e-commerce sites, cell phones by increasing the features. By making use of statistical measures they predict the future events and try to avoid them by giving optimal solutions. Speech recognition has made it easy to search information or do stuff without typing the best eg being google voice, siri. learn data science training in hyderabad

ROLES OF DATA SCIENTIST IN THE INDUSTRY:

This course is a boon for aspirants who wish to build a career in: Data Science, Machine Learning, Data Visualization, Business Intelligence, Big data, etc. This course is a combination of knowledge and money providing both these aspects in abundant measure. There are many boot camps and courses that provide certifications and provide you with the skills. A data scientist must have enough business domain expertise to analyze the risks, profits and achieve the department goals.

RESOURCE BOX:

Data Science is an amazing course enriching your education bank..If you are thinking how to learn data science then some of the best online data science courses are available to give a start to your incredible journey filled with incredible knowledge learning experience.

Click here for more about the data science course in Bangalore.

How Data Science Can Benefit Nonprofits

Image Source: https://pixabay.com/vectors/pixel-cells-pixel-creative-commons-3704068/

Data science is the poster child of the 21st century and for good reason. Data-based decisions have streamlined, automated, and made businesses more efficient than ever before, and there are practically no industries that haven’t recognized its immense potential. But when you think of data science application, sectors like marketing, finance, technology, SMEs, and even education are the first that come to mind. There’s one more sector that’s proving to be an untapped market for data—the social sector. At first, one might question why non-profit organizations even need complex data applications, but that’s just it—they don’t. What they really need is data tools that are simple and reliable, because if anything, accountability is the most important component of the way non-profits run.

Challenges for Non-profits and Data Science

If you’re wondering why many non-profits haven’t already hopped onto the data bandwagon, its because in most cases they lack one big thing—quality data.

One reason is that effective data application requires clean data, and heaps of it, something non-profits struggle with. Most don’t sell products or services, and their success is reliant on broad, long-term (sometimes decades) results and changes, which means their outcomes are highly unmeasurable. Metrics and data seem out of place when appealing to donors, who are persuaded more by emotional campaigns. Data collection is also rare, perhaps only being recorded when someone signs up to the program or leaves, and hardly any tracking in between. The result is data that’s too little and unreliable to make effective change.

Perhaps the most important phase, data collection relies heavily on accurate and organized processes. For non-profits that don’t have the resources for accurate and manual record-keeping, clean, and quality data collection is a huge pain point. However, that is an issue now easily avoidable. For instance, avoiding duplicate files, adopting record-keeping methods like off-site and cloud storage, digital retention, and of course back-up plans—are all processes that could save non-profits time, effort, and risk. On the other hand, poor record management has its consequences, namely on things like fund allocation, payroll, budgeting, and taxes. It could lead to financial risk, legal trouble, and data loss — all added worries for already under-resourced non-profit organizations.

But now, as non-governmental organizations (NGOs) and non-profits catch up and invest more in data collection processes, there’s room for data science to make its impact. A growing global movement, ‘Data For Good’ represents individuals, companies, and organizations volunteering to create or use data to help further social causes ad support non-profit organizations. This ‘Data For Good’ movement includes tools for data work that are donated or subsidized, as well as educational programs that serve marginalized communities. As the movement gains momentum, non-profits are seeing data seep into their structures and turn processes around.

How Can Data Do Social Good?

With data science set to take the non-profit sector by storm, let’s look at some of the ways data can do social good:

  1. Improving communication with donors: Knowing when to reach out to your donors is key. In between a meeting? You’re unlikely to see much enthusiasm. Once they’re at home with their families? You may see wonderful results, as pointed out in this Forbes article. The article opines that data can help non-profits understand and communicate with their donors better.
  2. Donor targetting: Cold calls are a hit and miss, and with data on their side, non-profits can discover and define their ideal donor and adapt their messaging to reach out to them for better results.
  3. Improving cost efficiency: Costs are a major priority for non-profits and every penny counts. Data can help decrease costs and streamline financial planning
  4. Increasing new member sign-ups and renewals: Through data, non-profits can reach out to the right people they want on-board, strengthen recruitment processes and keep track of volunteers reaching out to them for future events or recruitment drives.
  5. Modeling and forecasting performance: With predictive modeling tools, non-profits can make data-based decisions on where they should allocate time and money for the future, rather than go on gut instinct.
  6. Measuring return on investment: For a long time, the outcomes of social campaigns have been perceived as intangible and immeasurable—it’s hard to measure empowerment or change. With data, non-profits can measure everything from the amount a fundraiser raised against a goal, the cost of every lead in a lead generation campaign, etc
  7. Streamlining operations: Finally, non-profits can use data tools to streamline their business processes internally and invest their efforts into resources that need it.

It’s true, measuring good and having social change down to a science is a long way off — but data application is a leap forward into a more efficient future for the social sector. With mission-aligned processes, data-driven non-profits can realize their potential, redirect their focus from trivial tasks, and onto the bigger picture to drive true change.