Customer Journey Mapping: The data-driven approach to understanding your users

Businesses across the globe are on a mission to know their customers inside out – something commonly referred to as customer-centricity. It’s an attempt to better understand the needs and wants of customers in order to provide them with a better overall experience.

But while this sounds promising in theory, it’s much harder to achieve in practice. To really know your customer you must not only understand what they want, but you also need to hone in on how they want it, when they want it and how often as well.

In essence, your business should use customer journey mapping. It allows you to visualise customer feelings and behaviours through the different stages of their journey – from the first interaction, right up until the point of purchase and beyond.

The Data-Driven Approach 

To ensure your customer journey mapping is successful, you must conduct some extensive research on your customers. You can’t afford to make decisions based on feelings and emotions alone. There are two types of research that you should use for customer journey mapping – quantitative and qualitative research.

Quantitative data is best for analysing the behaviour of your customers as it identifies their habits over time. It’s also extremely useful for confirming any hypotheses you may have developed. That being so, relying solely upon quantitative data can present one major issue – it doesn’t provide you with the specific reason behind those behaviours.

That’s where qualitative data comes to the rescue. Through data collection methods like surveys, interviews and focus groups, you can figure out the reasoning behind some of your quantitative data trends. The obvious downside to qualitative data is its lack of evidence and its tendency to be subjective. Therefore, a combination of both quantitative and qualitative research is most effective.

Creating A Customer Persona

A customer persona is designed to help businesses understand the key traits of specific groups of people. For example, those defined by their age range or geographic location. A customer persona can help improve your customer journey map by providing more insight into the behavioural trends of your “ideal” customer. 

The one downside to using customer personas is that they can be over-generalised at times. Just because a group of people shares a similar age, for example, it does not mean they all share the same beliefs and interests. Nevertheless, creating a customer persona is still beneficial to customer journey mapping – especially if used in combination with the correct customer journey analytics tools.

All Roads Lead To Customer-centricity 

To achieve customer-centricity, businesses must consider using a data-driven approach to customer journey mapping. First, it requires that you achieve a balance between both quantitative and qualitative research. Quantitative research will provide you with definitive trends while qualitative data gives you the reasoning behind those trends. 

To further increase the effectiveness of your customer journey map, consider creating customer personas. They will give you further insight into the behavioural trends within specific groups. 

This article was written by TAP London. Experts in the Adobe Experience Cloud, TAP London help brands organise data to provide meaningful insight and memorable customer experiences. Find out more at wearetaplondon.com.

Article series: 5 Clean Coding Tips – 2. Name Variables in a Meaningful Way

This is the second of the article series “5 tips for clean coding” to follow as soon as you’ve made the first steps into your coding career, in this article series. Read the introduction here, to find out why it is important to write clean code if you missed it.

When it comes to naming variables, there are a few official rules in the PEP8 style guide. A variable must start with an underscore or a letter and can be followed by a number of underscores or letters or digits. They cannot be reserved words: True, False, or, not, lambda etc. The preferred naming style is lowercase or lowercase_with_underscore. This all refers to variable names on a visual level. However, for readability purposes, the semantic level is as important, or maybe even more so. If it was for python, the variables could be named like this:

b_a327647_3 = DataFrame() 
hw_abc7622 = DataFrame()  
a10001_kkl = DataFrame()

It wouldn’t make the slightest difference. But again, the code is not only for the interpreter to be read. It is for humans. Other people might need to look at your code to understand what you did, to be able to continue the work that you have already started. In any case, they need to be able to decipher what hides behind the variable names, that you’ve given the objects in your code. They will need to remember what they meant as they reappear in the code. And it might not be easy for them.

Remembering names is not an easy thing to do in all life situations. Let’s consider the following situation. You go to a party, there is a bunch of new people that you meet for the first time. They all have names and you try very hard to remember them all. Imagine how much easier would it be if you could call the new girl who came with John as the_girl_who_came_with_John. How much easier would it be to gossip to your friends about her? ‘Camilla is on the 5th glass of wine tonight, isn’t she?!.’ ‘Who are you talking about???’ Your friends might ask. ‘The_Girl_who_came_with_John.’ And they will all know. ‘It was nice to meet you girl_who_came_with_john, see you around.’ The good thing is that variables are not really like people. You can be a bit rude to them, they will not mind. You don’t have to force yourself or anyone else to remember an arbitrary name of a variable, that accidentally came to your mind in the moment of creation. Let your colleagues figure out what is what by a meaningful, straightforward description of it.

There is an important tradeoff to be aware of here. The lines of code should not exceed a certain length (79 characters, according to the PEP 8), therefore, it is recommended that you keep your names as short as possible. It is worth to give it a bit of thought about how you can name your variable in the most descriptive way, keeping it as short as possible. Keep in mind, that
the_blond_girl_in_a_dark_blue_dress_who_came_with_John_to_this_party might not be the best choice.

There are a few additional pieces of advice when it comes to naming your variables. First, try to always use pronounceable names. If you’ve ever been to an international party, you will know how much harder to remember is something that you cannot even repeat. Second, you probably have been taught over and over again that whenever you create a loop, you use i and j to denote the iterators.

for i in m:
    for j in n:

It is probably engraved deep into the folds in your brain to write for i in…. You need to try and scrape it out of your cortex. Think about what the i stands for, what it really does and name it accordingly. Is i maybe the row_index? Is it a list_element?

for element in list_of_words:
    for letter in word:

Additionally, think about when to use a noun and where a verb. Variables usually are things and functions usually do things. So, it might be better to name functions with verb expressions, for example: get_id() or raise_to_power().

Moreover, it is a good practice to name constant numbers in the code. First, because when you name them you explain the meaning of the number. Second, because maybe one day you will have to change that number. If it appears multiple times in your code, you will avoid searching and changing it in every place. PEP 8 states that the constants should be named with UPPER_CASE_NAME. It is also quite common practice to explain the meaning of the constants with an inline comment at the end of the line, where the number appears. However, this approach will increase the line length and will require repeating the comment if the number appears more than one time in the code.

How Important is Customer Lifetime Value?

This is the third article of article series Getting started with the top eCommerce use cases. If you are interested in reading the first article you can find it here.

Customer Lifetime Value

Many researches have shown that cost for acquiring a new customer is higher than the cost of retention of an existing customer which makes Customer Lifetime Value (CLV or LTV) one of the most important KPI’s. Marketing is about building a relationship with your customer and quality service matters a lot when it comes to customer retention. CLV is a metric which determines the total amount of money a customer is expected to spend in your business.

CLV allows marketing department of the company to understand how much money a customer is going  to spend over their  life cycle which helps them to determine on how much the company should spend to acquire each customer. Using CLV a company can better understand their customer and come up with different strategies either to retain their existing customers by sending them personalized email, discount voucher, provide them with better customer service etc. This will help a company to narrow their focus on acquiring similar customers by applying customer segmentation or look alike modeling.

One of the main focus of every company is Growth in this competitive eCommerce market today and price is not the only factor when a customer makes a decision. CLV is a metric which revolves around a customer and helps to retain valuable customers, increase revenue from less valuable customers and improve overall customer experience. Don’t look at CLV as just one metric but the journey to calculate this metric involves answering some really important questions which can be crucial for the business. Metrics and questions like:

  1. Number of sales
  2. Average number of times a customer buys
  3. Full Customer journey
  4. How many marketing channels were involved in one purchase?
  5. When the purchase was made?
  6. Customer retention rate
  7. Marketing cost
  8. Cost of acquiring a new customer

and so on are somehow associated with the calculation of CLV and exploring these questions can be quite insightful. Lately, a lot of companies have started to use this metric and shift their focuses in order to make more profit. Amazon is the perfect example for this, in 2013, a study by Consumers Intelligence Research Partners found out that prime members spends more than a non-prime member. So Amazon started focusing on Prime members to increase their profit over the past few years. The whole article can be found here.

How to calculate CLV?

There are several methods to calculate CLV and few of them are listed below.

Method 1: By calculating average revenue per customer


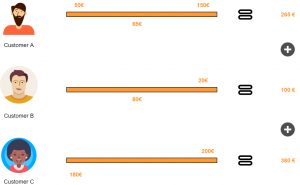
Figure 1: Using average revenue per customer


Let’s suppose three customers brought 745€ as profit to a company over a period of 2 months then:

CLV (2 months) = Total Profit over a period of time / Number of Customers over a period of time

CLV (2 months) = 745 / 3 = 248 €

Now the company can use this to calculate CLV for an year however, this is a naive approach and works only if the preferences of the customer are same for the same period of time. So let’s explore other approaches.

Method 2

This method requires to first calculate KPI’s like retention rate and discount rate.


CLV = Gross margin per lifespan ( Retention rate per month / 1 + Discount rate – Retention rate per month)

Where

Retention rate = Customer at the end of the month – Customer during the month / Customer at the beginning of the month ) * 100

Method 3

This method will allow us to look at other metrics also and can be calculated in following steps:

  1. Calculate average number of transactions per month (T)
  2. Calculate average order value (OV)
  3. Calculate average gross margin (GM)
  4. Calculate customer lifespan in months (ALS)

After calculating these metrics CLV can be calculated as:


CLV = T*OV*GM*ALS / No. of Clients for the period

where

Transactions (T) = Total transactions / Period

Average order value (OV) = Total revenue / Total orders

Gross margin (GM) = (Total revenue – Cost of sales/ Total revenue) * 100 [but how you calculate cost of sales is debatable]

Customer lifespan in months (ALS) = 1 / Churn Rate %


CLV can be calculated using any of the above mentioned methods depending upon how robust your company wants the analysis to be. Some companies are also using Machine learning models to predict CLV, maybe not directly but they use ML models to predict customer churn rate, retention rate and other marketing KPI’s. Some companies take advantage of all the methods by taking an average at the end.

Matrix search: Finding the blocks of neighboring fields in a matrix with Python

Task

In this article we will look at a solution in python to the following grid search task:

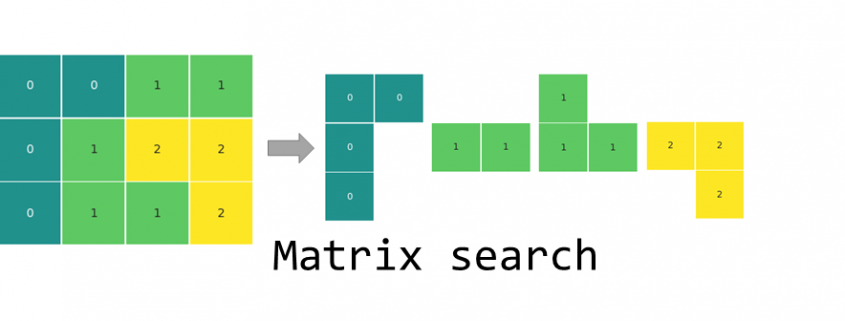
Find the biggest block of adjoining elements of the same kind and into how many blocks the matrix is divided. As adjoining blocks, we will consider field touching by the sides and not the corners.

Input data

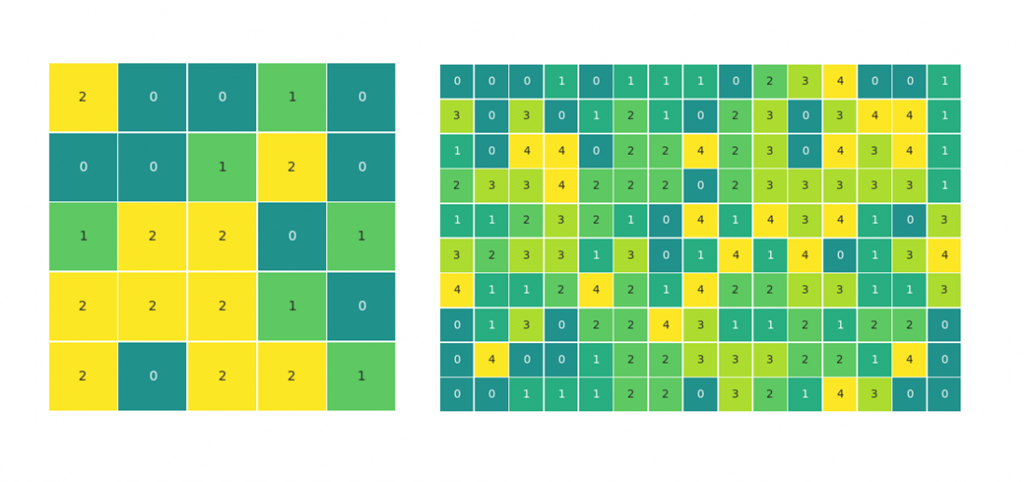
For the ease of the explanation, we will be looking at a simple 3×4 matrix with elements of three different kinds, 0, 1 and 2 (see above). To test the code, we will simulate data to achieve different matrix sizes and a varied number of element types. It will also allow testing edge cases like, where all elements are the same or all elements are different.

To simulate some test data for later, we can use the numpy randint() method:

import numpy as np
matrix = [[0,0,1,1], [0,1,2,2], [0,1,1,2]]

matrix_test1 = np.random.randint(3, size = (5,5))
matrix_test2 = np.random.randint(5, size = (10,15))

The code

def find_blocks(matrix):
    visited = []
    block_list = []     
    for x in range(len(matrix)):
        for y in range(len(matrix[0])):
            if (x, y) not in visited:
                field_count, visited = explore_block(x, y, visited)
                block_list.append(field_count)                 
    return print('biggest block: {0}, number of blocks: {1}'
                 .format(max(block_list), len(block_list)))

def explore_block(x, y, visited):
    queue = {(x,y)}
    field_count = 1
    while queue:  
        x,y = queue.pop()
        visited.append((x,y))
        if x+1<len(matrix) and (x+1,y) not in visited and (x+1,y) not in queue:
            if matrix[x+1][y] == matrix[x][y]:
                field_count += 1
                queue.add((x+1,y))         
        if x-1>=0 and (x-1,y) not in visited and (x-1,y) not in queue:
            if matrix[x-1][y] == matrix[x][y]:
                field_count += 1
                queue.add((x-1,y))                    
        if y-1>=0 and (x,y-1) not in visited and (x,y-1) not in queue:
            if matrix[x][y-1] == matrix[x][y]:
                field_count += 1
                queue.add((x,y-1))                    
        if y+1<len(matrix[0]) and (x,y+1) not in visited and (x,y+1) not in queue:
            if matrix[x][y+1] == matrix[x][y]:
                field_count += 1
                queue.add((x,y+1))                                              
    return field_count, visited

How the code works

In summary, the algorithm loops through all fields of the matrix looking for unseen fields that will serve as a starting point for a local exploration of each block of color – the find_blocks() function. The local exploration is done by looking at the neighboring fields and if they are within the same kind, moving to them to explore further fields – the explore_block() function. The fields that have already been seen and counted are stored in the visited list.

find_blocks() function:

  1. Finds a starting point of a new block
  2. Runs a the explore_block() function for local exploration of the block
  3. Appends the size of the explored block
  4. Updates the list of visited points
  5. Returns the result, once all fields of the matrix have been visited.

explore_block() function:

  1. Takes the coordinates of the starting field for a new block and the list of visited points
  2. Creates the queue set with the starting point
  3. Sets the size of the current block (field_count) to 1
  4. Starts a while loop that is executed for as long as the queue is not empty
    1. Takes an element of the queue and uses its coordinates as the current location for further exploration
    2. Adds the current field to the visited list
    3. Explores the neighboring fields and if they belong to the same block, they are added to the queue
    4. The fields are taken off the queue for further exploration one by one until the queue is empty
  5. Returns the field_count of the explored block and the updated list of visited fields

Execute the function

find_blocks(matrix)

The returned result is biggest block: 4, number of blocks: 4.

Run the test matrices:

find_blocks(matrix_test1)
find_blocks(matrix_test2)

Visualization

The matrices for the article were visualized with the seaborn heatmap() method.

import seaborn as sns
import matplotlib.pyplot as plt
# use annot=False for a matrix without the number labels
sns.heatmap(matrix, annot=True, center = 0, linewidths=.5, cmap = "viridis",
            xticklabels=False, yticklabels=False, cbar=False, square=True)
plt.show()

5 Applications for Location-Based Data in 2020

Location-based data enables giving people relevant information based on where they are at any given moment. Here are five location data applications to look for in 2020 and beyond. 

1. Increasing Sales and Reducing Frustration

One 2019 report indicated that 89% of the marketers who used geo data saw increased sales within their customer bases. Sometimes, the ideal way to boost sales is to convert what would be a frustration into something positive. 

A French campaign associated with the Actimel yogurt brand achieved this by sending targeted, encouraging messages to drivers who used the Waze navigation app and appeared to have made a wrong turn or got caught in traffic. 

For example, a driver might get a message that said, “Instead of getting mad and honking your horn, pump up the jams! #StayStrong.” The three-month campaign saw a 140% increase in ad recall. 

More recently, home furnishing brand IKEA launched a campaign in Dubai where people can get free stuff for making a long trip to a store. The freebies get more valuable as a person’s commute time increases. The catch is that participants have to activate location settings on their phones and enable Google Maps. Driving five minutes to a store got a person a free veggie hot dog, and they’d get a complimentary table for traveling 49 minutes. 

2. Offering Tailored Ad Targeting in Medical Offices

Pharmaceutical companies are starting to rely on companies that send targeted ads to patients connected to the Wi-Fi in doctors’ offices. One such provider is Semcasting. A recent effort involved sending ads to cardiology offices for a type of drug that lowers cholesterol levels in the blood. 

The company has taken a similar approach for an over-the-counter pediatric drug and a medication to relieve migraine headaches, among others. Such initiatives cause a 10% boost in the halo effect, plus a 1.5% uptick in sales. The first perk relates to the favoritism that people feel towards other products a company makes once they like one of them.

However, location data applications related to health care arguably require special attention regarding privacy. Patients may feel uneasy if they believe that companies are watching them and know they need a particular kind of medical treatment. 

3. Facilitating the Deployment of the 5G Network

The 5G network is coming soon, and network operators are working hard to roll it out. Statistics indicate that the 5G infrastructure investment will total $275 billion over seven years. Geodata can help network brands decide where to deploy 5G connectivity first.

Moreover, once a company offers 5G in an area, marketing teams can use location data to determine which neighborhoods to target when contacting potential customers. Most companies that currently have 5G within their product lineups have carefully chosen which areas are at the top of the list to receive 5G, and that practice will continue throughout 2020. 

It’s easy to envision a scenario whereby people can send error reports to 5G providers by using location data. For example, a company could say that having location data collection enabled on a 5G-powered smartphone allows a technician to determine if there’s a persistent problem with coverage.

Since the 5G network is still, it’s impossible to predict all the ways that a telecommunications operator might use location data to make their installations maximally profitable. However, the potential is there for forward-thinking brands to seize. 

4. Helping People Know About the Events in Their Areas

SoundHound, Inc. and Wcities recently announced a partnership that will rely on location-based data to keep people in the loop about upcoming local events. People can use a conversational intelligence platform that has information about more than 20,000 cities around the world. 

Users also don’t need to mention their locations in voice queries. They could say, for example, “Which bands are playing downtown tonight?” or “Can you give me some events happening on the east side tomorrow?” They can also ask something associated with a longer timespan, such as “Are there any wine festivals happening this month?”

People can say follow-up commands, too. They might ask what the weather forecast is after hearing about an outdoor event they want to attend. The system also supports booking an Uber, letting people get to the happening without hassles. 

5. Using Location-Based Data for Matchmaking

In honor of Valentine’s Day 2020, students from more than two dozen U.S colleges signed up for a matchmaking opportunity. It, at least in part, uses their location data to work. 

Participants answer school-specific questions, and their responses help them find a friend or something more. The platform uses algorithms to connect people with like-minded individuals. 

However, the company that provides the service can also give a breakdown of which residence halls have the most people taking part, or whether people generally live off-campus. This example is not the first time a university used location data by any means, but it’s different from the usual approach. 

Location Data Applications Abound

These five examples show there are no limits to how a company might use location data. However, they must do so with care, protecting user privacy while maintaining a high level of data quality. 

Integrate Unstructured Data into Your Enterprise to Drive Actionable Insights

In an ideal world, all enterprise data is structured – classified neatly into columns, rows, and tables, easily integrated and shared across the organization.

The reality is far from it! Datamation estimates that unstructured data accounts for more than 80% of enterprise data, and it is growing at a rate of 55 – 65 percent annually. This includes information stored in images, emails, spreadsheets, etc., that cannot fit into databases.

Therefore, it becomes imperative for a data-driven organization to leverage their non-traditional information assets to derive business value. We have outlined a simple 3-step process that can help organizations integrate unstructured sources into their data eco-system:

1. Determine the Challenge

The primary step is narrowing down the challenges you want to solve through the unstructured data flowing in and out of your organization. Financial organizations, for instance, use call reports, sales notes, or other text documents to get real-time insights from the data and make decisions based on the trends. Marketers make use of social media data to evaluate their customers’ needs and shape their marketing strategy.

Figuring out which process your organization is trying to optimize through unstructured data can help you reach your goal faster.

2. Map Out the Unstructured Data Sources Within the Enterprise

An actionable plan starts with identifying the range of data sources that are essential to creating a truly integrated environment. This enables organizations to align the sources with business objectives and streamline their data initiatives.

Deciding which data should be extracted, analyzed, and stored should be a primary concern in this regard. Even if you can ingest data from any source, it doesn’t mean that you should.

Collecting a large volume of unstructured data is not enough to generate insights. It needs to be properly organized and validated for quality before integration. Full, incremental, online, and offline extraction methods are generally used to mine valuable information from unstructured data sources.

3. Transform Unstructured Assets into Decision-Ready Insights

Now that you have all the puzzle pieces, the next step is to create a complete picture. This may require making changes in your organization’s infrastructure to derive meaning from your unstructured assets and get a 360-degree business view.

IDC recommends creating a company culture that promotes the collection, use, and sharing of both unstructured and structured business assets. Therefore, finding an enterprise-grade integration solution that offers enhanced connectivity to a range of data sources, ideally structured, unstructured, and semi-structured, can help organizations generate the most value out of their data assets.

Automation is another feature that can help speed up integration processes, minimize error probability, and generate time-and-cost savings. Features like job scheduling, auto-mapping, and workflow automation can optimize the process of extracting information from XML, JSON, Excel or audio files, and storing it into a relational database or generating insights.

The push to become a data-forward organization has enterprises re-evaluating the way to leverage unstructured data assets for decision-making. With an actionable plan in place to integrate these sources with the rest of the data, organizations can take advantage of the opportunities offered by analytics and stand out from the competition.