Posts

Wie der C++-Programmierer bei der Analyse großer Datenmengen helfen kann

Die Programmiersprache C wurde von Dennis Ritchie in den Bell Labs in einer Zeit (1969-1973) entwickelt, als jeder CPU-Zyklus und jeder Byte Speicher sehr teuer war. Aus diesem Grund wurde C (und später C++) so konzipiert, dass die maximale Leistung der Hardware mit der Sprachkomplexität erzielt werden konnte. Derzeit ist der C++ Programmierer besonders begehrt auf dem Arbeitsmarkt, für ganz bestimmte Abläufe, die wir später genauer beschreiben werden.

Warum sollten Sie einen C++ Entwickler mieten, wenn es um große Daten geht?

C++ ermöglicht, als Sprache auf einem niedrigen Level, eine Feinabstimmung der Leistung der Anwendung in einer Weise, die bei der Verwendung von Sprachen auf einem hohen Level nicht möglich ist. Warum sollten Sie einen C++ Entwickler mieten? C++ bietet den Entwicklern eine viel bessere Kontrolle über den Systemspeicher und die Ressourcen, als die der C Programmierer oder Anderer.

C++ ist die einzige Sprache, in der man Daten mit mehr als 1 GB pro Sekunde knacken, die prädiktive Analyse in Echtzeit neu trainieren und anwenden und vierstellige QPS einer REST-ful API in der Produktion bedienen kann, während die [eventuelle] Konsistenz des Aufzeichnungssystems ständig erhalten bleibt. Auf einem einzigen Server, natürlich aus Gründen der Zuverlässigkeit dupliziert, aber das, ohne in Repliken, Sharding und das Auffüllen und Wiederholen von persistenten Nachrichtenwarteschlangen investieren zu. Für ein groß angelegtes Werbesystem, dynamischen Lastausgleich oder eine hocheffiziente adaptive Caching-Schicht ist C++ die klügste Wahl.

Die allgemeine Vorstellung ist, dass R und Python schneller sind, aber das ist weit von der Wahrheit entfernt. Ein gut optimierter C++-Code könnte hundertmal schneller laufen, als das gleiche Stück Code, das in Python oder R geschrieben wurde. Die einzige Herausforderung bei C++ ist die Menge an Arbeit, die Sie bewältigen müssen, um die fertigen Funktionen zum Laufen zu bringen. Sie müssen wissen, wie man Zeiger verteilt und verwaltet – was ehrlich gesagt ein wenig kompliziert sein kann. Die C# Programmierer Ausbildung ist aus diesem Grunde z.Z. sehr begehrt.

R und Python

Akademiker und Statistiker haben R über zwei Jahrzehnte entwickelt. R verfügt nun über eines der reichsten Ökosysteme, um Datenanalysen durchzuführen. Es sind etwa 12000 Pakete in CRAN (Open-Source-Repository) verfügbar. Es ist möglich, eine Bibliothek zu finden, für was auch immer für eine Analyse Sie durchführen möchten. Die reiche Vielfalt der Bibliothek macht R zur ersten Wahl für statistische Analysen, insbesondere für spezialisierte analytische Arbeiten.

Python kann so ziemlich die gleichen Aufgaben wie R erledigen: Data Wrangling, Engineering, Feature Selection Web Scrapping, App und so weiter. Python ist ein Werkzeug, um maschinelles Lernen in großem Maßstab einzusetzen und zu implementieren. Python-Codes sind einfacher zu warten und robuster als R. Vor Jahren hatte Python nicht viele Bibliotheken für Datenanalyse und maschinelles Lernen. In letzter Zeit holt Python auf und bietet eine hochmoderne API für maschinelles Lernen oder künstliche Intelligenz. Der größte Teil der datenwissenschaftlichen Arbeit kann mit fünf Python-Bibliotheken erledigt werden: Numpy, Pandas, Scipy, Scikit-Learning und Seaborn.

Aber das Wissen, mit Zeigern zu arbeiten oder den Code in C++ zu verwalten, ist mit einem hohen Preis verbunden. Aus diesem Grunde werden C++ Programmierer gesucht, für die Bewältigung von großen Datenpaketen. Ein tiefer Einblick in das Innenleben der Anwendung ermöglicht es ihnen, die Anwendung im Falle von Fehlern besser zu debuggen und sogar Funktionen zu erstellen, die eine Kontrolle des Systems auf Mikroebene erfordern. Schauen Sie sich doch nach C# Entwickler in Berlin um, denn sie haben einen besonders guten Ruf unter den neuen Entwicklern.

Das Erlernen der Programmierung ist eine wesentliche Fähigkeit im Arsenal der Analysten von Big Data. Analysten müssen kodieren, um numerische und statistische Analysen mit großen Datensätzen durchzuführen. Einige der Sprachen, in deren Erlernen auch die C Entwickler Zeit und Geld investieren sollten, sind unter anderem Python, R, Java und C++. Je mehr sie wissen, desto besser – Programmierer sollten immer daran denken, dass sie nicht nur eine einzelne Sprache lernen sollten. C für Java Programmierer sollte ein MUSS sein.

Wo wird das C++ Programmieren eingesetzt?

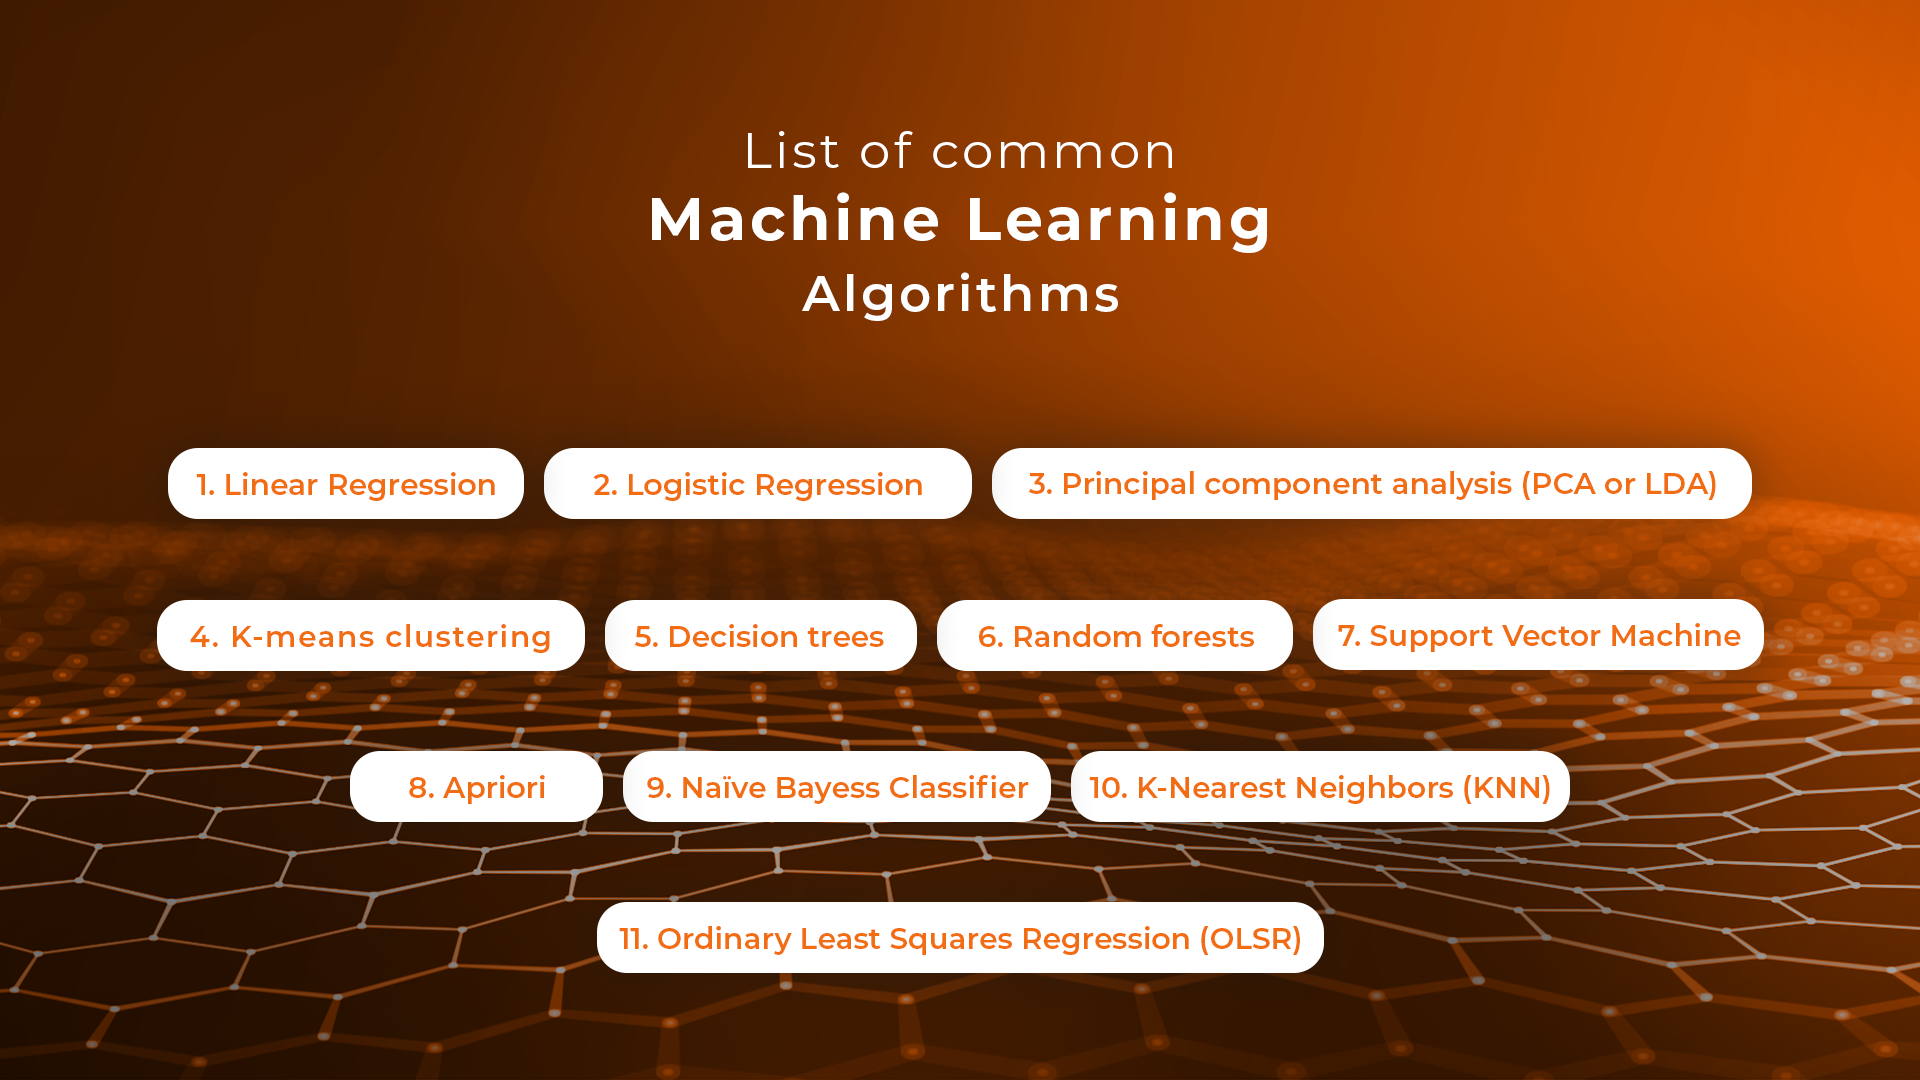
Die Programmiersprache C++ ist eine etablierte Sprache mit einem großen Satz von Bibliotheken und Tools, die bereit ist, große Datenanwendungen und verteilte Systeme zu betreiben. In den meisten Fällen wird C++ zum Schreiben von Frameworks und Paketen für große Daten verwendet. Diese Programmiersprache bietet auch eine Reihe von Bibliotheken, die beim Schreiben von Algorithmen für das tiefe Lernen helfen. Mit ausreichenden C++-Kenntnissen ist es möglich, praktisch unbegrenzte Funktionen auszuführen. Dennoch ist C++ nicht die Sprache, die man leicht erlernen kann, da man die über 1000 Seiten Spezifikation und fast 100 Schlüsselwörter beherrschen muss.

Die Verwendung von C++ ermöglicht die prozedurale Programmierung für intensive Funktionen der CPU und die Kontrolle über die Hardware, und diese Sprache ist sehr schnell, weshalb sie bei der Entwicklung verschiedener Spiele oder in Spielmaschinen weit verbreitet ist.

C++ bietet viele Funktionen, die anderen Sprachen fehlen. Darüber hinaus bietet die Sprache auch Zugang zu umfangreichen Vorlagen, die es Ihnen ermöglichen, generische Codes zu schreiben. Als betroffenes Unternehmen sollten Sie sich deshalb tatsächlich überlegen, einen C++ Programmierer zu suchen oder in einen Kurs von C++ für Ihren C Programmierer zu investieren. Am Ende lohnen sich bestimmt diese Kosten.

Und vergessen Sie nicht: C++ ist die einzige Sprache, die in der Lage ist, 1 GB+ Daten in weniger als einer Sekunde zu verarbeiten. Darüber hinaus können Sie Ihr Modell neu trainieren und prädiktive Analysen in Echtzeit und sogar die Konsistenz der Systemaufzeichnung anwenden. Diese Gründe machen C++ zu einer bevorzugten Wahl für Sie, wenn Sie einen Datenwissenschaftler für Ihr Unternehmen suchen.

Beispiele für die Verwendung von C++

Die Verwendung von C++ zur Entwicklung von Anwendungen und vielen produktbasierten Programmen, die in dieser Sprache entwickelt wurden, hat mehrere Vorteile, die nur auf ihren Eigenschaften und ihrer Sicherheit beruhen. Unten finden Sie eine Liste der häufigsten Anwendungen von C++.

  • Google-Anwendungen – Einige der Google-Anwendungen sind auch in C++ geschrieben, darunter das Google-Dateisystem und der Google-Chromium-Browser sowie MapReduce für die Verarbeitung großer Clusterdaten. Die Open-Source-Gemeinschaft von Google hat über 2000 Projekte, von denen viele in den Programmiersprachen C oder C++ geschrieben und bei GitHub frei verfügbar sind.
  • Mozilla Firefox und Thunderbird – Der Mozilla-Internetbrowser Firefox und der E-Mail-Client Thunderbird sind beide in der Programmiersprache C++ geschrieben, und sie sind ebenfalls Open-Source-Projekte. Der C++-Quellcode dieser Anwendungen ist in den MDN-Webdokumenten zu finden.
  • Adobe-Systeme – Die meisten der wichtigsten Anwendungen von Adobe-Systemen werden in der Programmiersprache C++ entwickelt. Zu diesen Anwendungen gehören Adobe Photoshop und Image Ready, Illustrator und Adobe Premier. Sie haben in der Vergangenheit eine Menge Open-Source-Codes veröffentlicht, immer in C++, und ihre Entwickler waren in der C++-Community aktiv.
  • 12D-Lösungen – 12D Solutions Pty Ltd ist ein australischer Softwareentwickler, der sich auf Anwendungen im Bereich Bauwesen und Vermessung spezialisiert hat. Computer Aided Design-System für Vermessung, Bauwesen und mehr. Zu den Kunden von 12D Solutions gehören Umweltberater, Berater für Bau- und Wasserbau, lokale, staatliche und nationale Regierungsabteilungen und -behörden, Vermessungsingenieure, Forschungsinstitute, Bauunternehmen und Bergbau-Berater.
  • In C/C++ geschriebene Betriebssysteme

Apple – Betriebssystem OS XApple – Betriebssystem OS X

Einige Teile von Apple OS X sind in der Programmiersprache C++ geschrieben. Auch einige Anwendungen für den iPod sind in C++ geschrieben.

Microsoft-BetriebssystemeMicrosoft-Betriebssysteme

Der Großteil der Software wird buchstäblich mit verschiedenen Varianten von Visual C++ oder einfach C++ entwickelt. Die meisten der großen Anwendungen wie Windows 95, 98, Me, 200 und XP sind ebenfalls in C++ geschrieben. Auch Microsoft Office, Internet Explorer und Visual Studio sind in Visual C++ geschrieben.

  • Betriebssystem Symbian – Auch Symbian OS wird mit C++ entwickelt. Dies war eines der am weitesten verbreiteten Betriebssysteme für Mobiltelefone.

Die Einstellung eines C- oder C++-Entwicklers kann eine gute Investition in Ihr Projekt-Upgrade sein

Normalerweise benötigen C- und C++-Anwendungen weniger Strom, Speicher und Platz als die Sprachen der virtuellen Maschinen auf hoher Ebene. Dies trägt dazu bei, den Kapitalaufwand, die Betriebskosten und sogar die Kosten für die Serverfarm zu reduzieren. Hier zeigt sich, dass C++ die Gesamtentwicklungskosten erheblich reduziert.

Trotz der Tatsache, dass wir eine Reihe von Tools und Frameworks nur für die Verwaltung großer Daten und die Arbeit an der Datenwissenschaft haben, ist es wichtig zu beachten, dass auf all diesen modernen Frameworks eine Schicht einer niedrigen Programmiersprache – wie C++ – aufgesetzt ist. Die Niedrigsprachen sind für die tatsächliche Ausführung des dem Framework zugeführten Hochsprachencodes verantwortlich. Es ist also ratsam in ein C-Entwickler-Gehalt zu investieren.

Der Grund dafür, dass C++ ein so unverzichtbares Werkzeug ist, liegt darin, dass es nicht nur einfach, sondern auch extrem leistungsfähig ist und zu den schnellsten Sprachen auf dem Markt gehört. Darüber hinaus verfügt ein gut geschriebenes Programm in C++ über ein komplexes Wissen und Verständnis der Architektur der Maschine, sowie der Speicherzugriffsmuster und kann schneller laufen als andere Programme. Es wird Ihrem Unternehmen Zeit- und Stromkosten sparen.

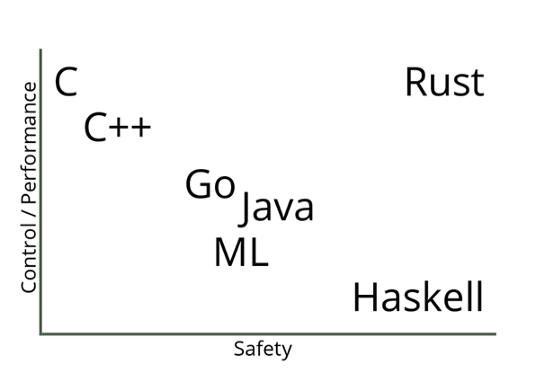
Zum Abschluss eine Grafik, die Sie als Unternehmer interessieren wird und die das Verhältnis von der Performance and der Sicherheit diverser Sprachen darstellt:

Aus diesen und weiteren Gründen neigen viele Unternehmensentwickler und Datenwissenschaftler mit massiven Anforderungen an Skalierbarkeit und Leistung zu dem guten alten C++. Viele Organisationen, die Python oder andere Hochsprachen für die Datenanalyse und Erkundungsaufgaben verwenden, verlassen sich auf C++, um Programme zu entwickeln, die diese Daten an die Kunden weiterleiten – in Echtzeit.

Multi-touch attribution: A data-driven approach

This is the first article of article series Getting started with the top eCommerce use cases.

What is Multi-touch attribution?

Customers shopping behavior has changed drastically when it comes to online shopping, as nowadays, customer likes to do a thorough market research about a product before making a purchase. This makes it really hard for marketers to correctly determine the contribution for each marketing channel to which a customer was exposed to. The path a customer takes from his first search to the purchase is known as a Customer Journey and this path consists of multiple marketing channels or touchpoints. Therefore, it is highly important to distribute the budget between these channels to maximize return. This problem is known as multi-touch attribution problem and the right attribution model helps to steer the marketing budget efficiently. Multi-touch attribution problem is well known among marketers. You might be thinking that if this is a well known problem then there must be an algorithm out there to deal with this. Well, there are some traditional models  but every model has its own limitation which will be discussed in the next section.

Traditional attribution models

Most of the eCommerce companies have a performance marketing department to make sure that the marketing budget is spent in an agile way. There are multiple heuristics attribution models pre-existing in google analytics however there are several issues with each one of them. These models are:

First touch attribution model

100% credit is given to the first channel as it is considered that the first marketing channel was responsible for the purchase.

Figure 1: First touch attribution model

Last touch attribution model

100% credit is given to the last channel as it is considered that the first marketing channel was responsible for the purchase.

Figure 2: Last touch attribution model

Linear-touch attribution model

In this attribution model, equal credit is given to all the marketing channels present in customer journey as it is considered that each channel is equally responsible for the purchase.

Figure 3: Linear attribution model

U-shaped or Bath tub attribution model

This is most common in eCommerce companies, this model assigns 40% to first and last touch and 20% is equally distributed among the rest.

Figure 4: Bathtub or U-shape attribution model

Data driven attribution models

Traditional attribution models follows somewhat a naive approach to assign credit to one or all the marketing channels involved. As it is not so easy for all the companies to take one of these models and implement it. There are a lot of challenges that comes with multi-touch attribution problem like customer journey duration, overestimation of branded channels, vouchers and cross-platform issue, etc.

Switching from traditional models to data-driven models gives us more flexibility and more insights as the major part here is defining some rules to prepare the data that fits your business. These rules can be defined by performing an ad hoc analysis of customer journeys. In the next section, I will discuss about Markov chain concept as an attribution model.

Markov chains

Markov chains concepts revolves around probability. For attribution problem, every customer journey can be seen as a chain(set of marketing channels) which will compute a markov graph as illustrated in figure 5. Every channel here is represented as a vertex and the edges represent the probability of hopping from one channel to another. There will be an another detailed article, explaining the concept behind different data-driven attribution models and how to apply them.

Figure 5: Markov chain example

Challenges during the Implementation

Transitioning from a traditional attribution models to a data-driven one, may sound exciting but the implementation is rather challenging as there are several issues which can not be resolved just by changing the type of model. Before its implementation, the marketers should perform a customer journey analysis to gain some insights about their customers and try to find out/perform:

  1. Length of customer journey.
  2. On an average how many branded and non branded channels (distinct and non-distinct) in a typical customer journey?
  3. Identify most upper funnel and lower funnel channels.
  4. Voucher analysis: within branded and non-branded channels.

When you are done with the analysis and able to answer all of the above questions, the next step would be to define some rules in order to handle the user data according to your business needs. Some of the issues during the implementation are discussed below along with their solution.

Customer journey duration

Assuming that you are a retailer, let’s try to understand this issue with an example. In May 2016, your company started a Fb advertising campaign for a particular product category which “attracted” a lot of customers including Chris. He saw your Fb ad while working in the office and clicked on it, which took him to your website. As soon as he registered on your website, his boss called him (probably because he was on Fb while working), he closed everything and went for the meeting. After coming back, he started working and completely forgot about your ad or products. After a few days, he received an email with some offers of your products which also he ignored until he saw an ad again on TV in Jan 2019 (after 3 years). At this moment, he started doing his research about your products and finally bought one of your products from some Instagram campaign. It took Chris almost 3 years to make his first purchase.

Figure 6: Chris journey

Now, take a minute and think, if you analyse the entire journey of customers like Chris, you would realize that you are still assigning some of the credit to the touchpoints that happened 3 years ago. This can be solved by using an attribution window. Figure 6 illustrates that 83% of the customers are making a purchase within 30 days which means the attribution window here could be 30 days. In simple words, it is safe to remove the touchpoints that happens after 30 days of purchase. This parameter can also be changed to 45 days or 60 days, depending on the use case.

Figure 7: Length of customer journey

Removal of direct marketing channel

A well known issue that every marketing analyst is aware of is, customers who are already aware of the brand usually comes to the website directly. This leads to overestimation of direct channel and branded channels start getting more credit. In this case, you can set a threshold (say 7 days) and remove these branded channels from customer journey.

Figure 8: Removal of branded channels

Cross platform problem

If some of your customers are using different devices to explore your products and you are not able to track them then it will make retargeting really difficult. In a perfect world these customers belong to same journey and if these can’t be combined then, except one, other paths would be considered as “non-converting path”. For attribution problem device could be thought of as a touchpoint to include in the path but to be able to track these customers across all devices would still be challenging. A brief introduction to deterministic and probabilistic ways of cross device tracking can be found here.

Figure 9: Cross platform clash

How to account for Vouchers?

To better account for vouchers, it can be added as a ‘dummy’ touchpoint of the type of voucher (CRM,Social media, Affiliate or Pricing etc.) used. In our case, we tried to add these vouchers as first touchpoint and also as a last touchpoint but no significant difference was found. Also, if the marketing channel of which the voucher was used was already in the path, the dummy touchpoint was not added.

Figure 10: Addition of Voucher as a touchpoint

Let me know in comments if you would like to add something or if you have a different perspective about this use case.

4 Industries Likely to Be Further Impacted by Data and Analytics in 2020

The possibilities for collecting and analyzing data have skyrocketed in recent years. Company leaders no longer must rely primarily on guesswork when making decisions. They can look at the hard statistics to get verification before making a choice.

Here are four industries likely to notice continuing positive benefits while using data and analytics in 2020.

  1. Transportation

If the transportation sector suffers from problems like late arrivals or buses and trains never showing up, people complain. Many use transportation options to reach work or school, and use long-term solutions like planes to visit relatives or enjoy vacations.

Data analysis helps transportation authorities learn about things such as ridership numbers, the most efficient routes and more. Digging into data can also help professionals in the sector verify when recent changes pay off.

For example, New York City recently enacted a plan called the 14th Street Busway. It stops cars from traveling on 14th Street for more than a couple of blocks from 6 a.m. to 10 p.m. every day. One of the reasons for making the change was to facilitate the buses that carry passengers along 14th Street. Data confirms the Busway did indeed encourage people to use the bus. Ridership jumped 24% overall, and by 20% during the morning rush hour.

Data analysis could also streamline air travel. A new solution built with artificial intelligence can reportedly make flights more on time and reduce fuel consumption by improving traffic flow in the terminals. The system also crunches numbers to warn people about long lines in an airport. Then, some passengers might make schedule adjustments to avoid those backups.

These examples prove why it’s smart for transportation professionals to continually see what the data shows. Becoming more aware of what’s happening, where problems exist and how people respond to different transit options could lead to better decision-making.

  1. Agriculture

People in the agriculture industry face numerous challenges, such as climate change and the need to produce food for a growing global population. There’s no single, magic fix for these challenges, but data analytics could help.

For example, MIT researchers are using data to track the effects of interventions on underperforming African farms. The outcome could make it easier for farmers to prove that new, high-tech equipment will help them succeed, which could be useful when applying for loans.

Elsewhere, scientists developed a robot called the TerraSentia that can collect information about a variety of crop traits, such as the height and biomass. The machine then transfers that data to a farmer’s laptop or computer. The robot’s developers say their creation could help farmers figure out which kinds of crops would give the best yields in specific locations, and that the TerraSentia will do it much faster than humans.

Applying data analysis to agriculture helps farmers remove much of the guesswork from what they do. Data can help them predict the outcome of a growing season, target a pest or crop disease problem and more. For these reasons and others, data analysis should remain prominent in agriculture for the foreseeable future.

  1. Energy 

Statistics indicate global energy demand will increase by at least 30% over the next two decades. Many energy industry companies have turned to advanced data analysis technologies to prepare for that need. Some solutions examine rocks to improve the detection of oil wells, while others seek to maximize production over the lifetime of an oilfield.

Data collection in the energy sector is not new, but there’s been a long-established habit of only using a small amount of the overall data collected. That’s now changing as professionals are more frequently collecting new data, plus converting information from years ago into usable data.

Strategic data analysis could also be a good fit for renewable energy efforts. A better understanding of weather forecasts could help energy professionals pinpoint how much a solar panel or farm could contribute to the electrical grid on a given day.

Data analysis helps achieve that goal. For example, some solutions can predict the weather up to a month in advance. Then, it’s possible to increase renewable power generation by up to 10%.

  1. Construction

Construction projects can be costly and time-consuming, although the results are often impressive. Construction professionals must work with a vast amount of data as they meet customers’ needs. Site plans, scheduling specifics, weather information and regulatory documents all help define how the work progresses and whether everything stays under budget.

Construction firms increasingly use big data analysis software to pull all the information into one place and make it easier to use. That data often streamlines customer communications and helps with meeting expectations. In one instance, a construction company depended on a real-time predictive modeling solution and combined it with in-house estimation software.

The outcome enabled instantly showing a client how much a new addition would cost. Other companies that are starting to use big data in construction note that having the option substantially reduces their costs — especially during the planning phase before construction begins. Another company is working on a solution that can analyze job site photos and use them to spot injury risks.

Data Analysis Increases Success

The four industries mentioned here have already enjoyed success by investigating the potential data analysis offers. People should expect them to continue making gains through 2020.

AI For Advertisers: How Data Analytics Can Change The Maths Of Advertising?

All Images Credit: Freepik

The task of understanding a customer’s journey and designing your marketing strategy accordingly can be difficult in this data-driven world. Today, the customer expresses their needs in myriad forms of requests.

Consumers express their needs and want attitudes, and values in various forms through search, comments, blogs, Tweets, “likes,” videos, and conversations and access such data across many channels like web, mobile, and face to face. Volume, variety, velocity and veracity of the data accumulated through these customer interactions are huge.

BigData and data analytics can be leveraged to understand several phases of the customer journey. There are risks involved in using Artificial Intelligence for the marketing data analysis of data breach and even manipulation. But, AI do have brighter prospects when it comes to marketing and advertiser applications.

As the CEO of a technology firm Chop Dawg and marketer, Joshua Davidson puts it, “AI-powered apps are going to be the future for us, and there are several industries that are ripe for this.” The mobile-first strategy of many enterprises has powered the use of AI for digital marketing and developing technologies and innovations to power industries with intelligent systems.

How AI and Machine learning are affecting customer journeys?

Any consumer journey begins with the recognition of a problem and then stages like initial consideration, active evaluation, purchase, and postpurchase come through up till the consumer journey is over. The need for identifying the purchasing and need patterns of the consumers and finding the buyer personas to strategize the marketing for them.

Need and Want Recognition:

Identifying a need is quite difficult as it is the most initial level of a consumer’s journey and it is more on the category level than at a brand level. Marketers and advertisers are relying on techniques like market research, web analytics, and data mining to build consumer profiles and buyer’s persona for understanding the needs and influencing the purchase of products. AI can help identify these wants and needs in real-time as the consumers usually express their needs and wants online and help build profiles more quickly.

AI technologies offered by several firms help in consumer profiling. Firms like Microsoft offers Azure that crunches billions of data points in seconds to determine the needs of consumers. It then personalizes web content on specific platforms in real-time to align with those status-updates. Consumer digital footprints are evolving through social media status updates, purchasing behavior, online comments and posts. Ai tends to update these profiles continuously through machine learning techniques.

Initial Consideration:

A key objective of advertising is to insert a brand into the consideration set of the consumers when they are looking for deliberate offerings. Advertising includes increasing the visibility of brands and emphasize on the key reasons for consideration. Advertisers currently use search optimization, paid search advertisements, organic search, or advertisement retargeting for finding the consideration and increase the probability of consumer consideration.

AI can leverage machine learning and data analytics to help with search, identify and rank functions of consumer consideration that can match the real-time considerations at any specific time. Take an example of Google Adwords, it analyzes the consumer data and helps advertisers make clearer distinctions between qualified and unqualified leads for better targeting.

Google uses AI to analyze the search-query data by considering, not only the keywords but also context words and phrases, consumer activity data and other BigData. Then, Google identifies valuable subsets of consumers and more accurate targeting.

Active Evaluation: 

When consumers narrow it down to a few choices of brands, advertisers need to insert trust and value among the consumers for brands. A common technique is to identify the higher purchase consumers and persuade them through persuasive content and advertisement. AI can support these tasks using some techniques:

Predictive Lead Scoring: Predictive lead scoring by leveraging machine learning techniques of predictive analytics to allow marketers to make accurate predictions related to the intent of purchase for consumers. A machine learning algorithm runs through a database of existing consumer data, then recognize trends and patterns and after processing the external data on consumer activities and interests, creates robust consumer profiles for advertisers.

Natural Language Generation: By leveraging the image, speech recognition and natural language generation, machine learning enables marketers to curate content while learning from the consumer behavior in real-time scenarios and adjusts the content according to the profiles on the fly.

Emotion AI: Marketers use emotion AI to understand consumer sentiment and feel about the brand in general. By tapping into the reviews, blogs or videos they understand the mood of customers. Marketers also use emotion AI to pretest advertisements before its release. The famous example of Kelloggs, which used emotion AI to help devise an advertising campaign for their cereal, eliminating the advertisement executions whenever the consumer engagement dropped.

Purchase: 

As the consumers decide which brands to choose and what it’s worth, advertising aims to move them out of the decision process and push for the purchase by reinforcing the value of the brand compared with its competition.

Advertisers can insert such value by emphasizing convenience and information about where to buy the product, how to buy the product and reassuring the value through warranties and guarantees. Many marketers also emphasize on rapid return policies and purchase incentives.

AI can completely change the purchase process through dynamic pricing, which encompasses real-time price adjustments on the basis of information such as demand and other consumer-behavior variables, seasonality, and competitor activities.

Post-Purchase: 

Aftersales services can be improved through intelligent systems using AI technologies and machine learning techniques. Marketers and advertisers can hire dedicated developers to design intelligent virtual agents or chatbots that can reinforce the value and performance of a brand among consumers.

Marketers can leverage an intelligent technique known as Propensity modeling to identify the most valuable customers on the basis of lifetime value, likelihood of reengagement, propensity to churn, and other key performance measures of interest. Then advertisers can personalize their communication with these customers on the basis of these data.

Conclusion:

AI has shifted the focus of advertisers and marketers towards the customer-first strategies and enhanced the heuristics of customer engagement. Machine learning and IoT(Internet of Things) has already changed the way customer interact with the brands and this transition has come at a time when advertisers and marketers are looking for new ways to tap into the customer mindset and buyer’s persona.

All Images Credit: Freepik

Best machine learning algorithms you should know

Machine learning is a key technology tool businesses use to build tools that enhance their operations. To do that, they take advantage of machine learning algorithms that come in different shapes and sizes, servicing different purposes and working on different data sets. Choosing the right algorithm for the job is what makes machine learning and deep learning projects successful. That’s why being aware of all the different types of machine learning algorithms is so important – that’s how you get better results and build more advanced solutions.

Here’s an overview of the best machine learning algorithms you should know before starting your project.

What is meant by machine learning algorithms?

First things first, what is machine learning and how do algorithms fit into the picture? A machine learning (ML) algorithm is a process or set of procedures that allow a model to adapt to the data with a specific objective set as the goal.

An ML algorithm specifies how the data is transformed from the input to output, helping the model to learn the appropriate mapping from input to output. That model specifies the mapping functions and holds the parameters in place, while the machine learning algorithm updates the parameters to help the model match its goal.

What are the algorithms used in machine learning?

Algorithms can model problems in many different ways. The easiest way to differentiate between different ML algorithms is by comparing them by learning styles that they can adapt. Generally, machine learning algorithms can adapt to several learning styles that help to solve different problems.

Here are four learning styles in machine learning you need to know:

1 Supervised learning

In supervised learning, the input data serves as training data and comes with a known label or result – for example, the price at a time or spam/not-spam.

In this variant, the training process is critical for preparing a model that makes predictions and then is corrected when the predictions are wrong. The training process continues until the model achieves the appropriate level of accuracy. Classification and regression are examples of problems for this learning type.


2 Unsupervised learning

In unsupervised learning, input data isn’t labeled and doesn’t come with a known result. Data scientists prepare models by deducing the structures in the input data to extract general rules or reduce redundancy through mathematical processes. Unsupervised learning addresses problems such as association rule learning, dimensionality reduction, and clustering.

3 Semi-supervised learning

In this learning style, the input data is a mixture of labeled and unlabeled examples. The prediction problem is known, but the model needs to learn the structures for organizing data and making predictions on its own. This learning style is used to address problems such as regression and classification.

4 Reinforcement learning

One of three basic machine learning paradigms together with supervised learning and unsupervised learning, reinforcement learning (RL) is an area of machine learning that focuses on the ways in which software agents should take actions to maximize a specified notion of cumulative reward in a given environment.

The best machine learning algorithms you should know

1 Linear Regression

Linear regression is an algorithm that correlates between two variables in the data set, examining the input and output sets to show a relationship between them. For example, the algorithm can show how changing one of the input variables affects the other variable. The relationship is represented by plotting a line on the graph.

Linear regression is one of the most popular algorithms in machine learning because it’s transparent and requires no tuning to work. Practical applications of this algorithm are risk assessment or sales forecasting solutions.

2 Logistic regression

Logistic regression is a type of constrained Linear Regression with a non-linearity application after you apply weights. Note that this algorithm is used for classification, not regression. The algorithm restricts the outputs close to +/- classes (and 1 and 0 in the case of sigmoid) and can be trained with Gradient Descent or L-BFGS.

Logistic regression is used in Natural Language Processing (NLP) applications, where it often appears under the name of Maximum Entropy Classifier.

3 Principal component analysis (PCA or LDA)

Principal component analysis is an unsupervised method that helps data scientists to understand better the global properties of a data set that consists of vectors. It analyzes the covariance matrix of data points to learn which dimensions/data points have high variance among themselves and low covariance with others. The algorithm helps data scientists to get data points with reduced dimensions.

4 K-means clustering

K- means clustering is a type of unsupervised clustering algorithm that sorts data sets through defined clusters. It offers results in the form of groups based on internal patterns.

For example, you can use a K-means algorithm for sorting web results for the word “cat,” and it will show all the results in the form of groups. The main advantage of this algorithm is its accuracy as it provides data groupings faster than other algorithms.


5 Decision trees

A decision tree is made of various branches that represent the outcome of many decisions. This algorithm collects and graphs data in multiple branches to predict response variables on the basis of past decisions. It comes in handy for mapping our decisions and presents results visually to communicate findings easily.

Decision trees work best for smaller data sets and relatively low-stake decisions – otherwise, the long-tail visuals can be hard to decipher. The key advantage of this algorithm is that it allows showing multiple outcomes and tests without having to involve data scientists – it’s easy to use.

6 Random forests

A random forest consists of a great number of individual decision trees where they all operate as an ensemble. An individual tree in the random forest generates a class prediction – the class which receives the highest number of votes becomes the model’s prediction. Having many relatively uncorrelated models (trees) operating as a committee easily outperforms individual constituent models.

The low correlation between these models is the strength of this approach because it allows producing ensemble predictions that are far more accurate than individual predictions. Note that decisions trees protect each other from individual errors. While some trees may generate false predictions, others will generate the right ones – as a group; they will be able to move in the right direction.

7 Support Vector Machine

Support Vector Machines (SVMs) are linear models similar to linear or logistic regression we’ve discussed earlier. However, there’s one difference – they have a different margin-based loss function, which can be optimized by using methods such as L-BFGS or SGD. SVMs internally analyze data sets into classes, which is helpful for future classifications.

The main idea behind SVM is separating data into classes and maximizing the margins of entering future data into classes. This type of algorithm works best for training data. However, it can also serve as a tool for processing nonlinear data. The financial sector makes use of Support Vector Machines thanks to its accuracy in classifying both current and future data sets.

8 Apriori

The Apriori algorithm is used a lot in market analysis. It’s based on the principle of Apriori and checks for positive and negative correlations between products after analyzing values in data sets.

For example, if two values often correlate in a data set, the algorithm will conclude that A will often lead to B, referring to the information in data sets. For example, if customers often buy product A and product B together, this relation will hold a high percentage and help companies like Google or Amazon to predict product searches and purchases.

9 Naive Bayes Classifier

This handy classification technique is based on Bayes’ Theorem, which assumes independence among predictors. The algorithm will assume that the presence of a specific feature in a class is not related to the presence of any other feature in the same class.

For example, a fruit may be considered a banana if it’s yellow, curved, and about 15 cm long. These features depend on each other, and on the existence of hooter features, they all independently contribute to the probability that this fruit is a banana. That’s why the algorithm bears the name “Naive.”

The algorithm offers a model that is easy to build and helpful in handling very large data sets. It can outperform the most sophisticated classification methods.

10 K-Nearest Neighbors (KNN)

This is one of the simplest algorithm types used in machine learning for classification and regression. KNN algorithms classify new data points on the basis of similarity measures, such as the distance function. They perform classification by using a majority vote of the data points’ neighbors. They then assign data to the class, which has the nearest neighbors. Together with increasing the number of nearest neighbors (the value of k), the accuracy may increase as well.

11 Ordinary Least Squares Regression (OLSR)

Ordinary Least Squares Regression (OLSR) is a generalized linear modeling technique data scientists use for estimating unknown parameters that are part of a linear regression model. OLSR describes the relationship between a dependent variable and one or more of its independent variables.

The algorithm is applied in diverse fields such as economics, finance, medicine, and social sciences. Companies use it in machine learning and predictive analytics to dynamically predict specific outcomes on the basis of variables that change dynamically.

We hope that this machine learning algorithms list helps you pick the right tools of the trade for your next machine learning project. If you’d like to learn more about Machine Learning, Data Science and Web Development, visit the Sunscrapers company blog.

Interview: Data Science im Einzelhandel

Interview mit Dr. Andreas Warntjen über den Weg zum daten-getriebenen Unternehmen – Data Science im Einzelhandel

Zur Einführung der Person:

Dr. Andreas Warntjen arbeitet seit Juli 2016 bei der Thalia Bücher GmbH, aktuell als Senior Manager Advanced and Predictive Analytics. Davor hat Herr Dr. Warntjen viele Jahre als Sozialwissenschaftler an ausländischen Universitäten geforscht. Er hat selbst langjährige Erfahrung in der statistischen Datenanalyse mit Stata, SPSS und R und arbeitet im Moment mit der in-memory Datenbank SAP HANA sowie Python und SAP’s Automated Predictive Library (APL).


Data Science Blog: Herr Dr. Warntjen, welche Bedeutung hat die Data Science für Sie und Ihren Bereich bei Thalia? Und wie ordnen Sie die verwandten Begriffe wie Predictive Analytics und Advanced Analytics im Kontext der geschäftlichen Entscheidungsfindung ein?

Data Science spielt bei Thalia in unterschiedlichsten Bereichen eine zunehmend größer werdende Rolle. Neben den klassischen Themen wie Betrugserkennung und Absatzprognosen ist für Thalia als Buchhändler Text Mining von zentraler Bedeutung. Das größte Potential liegt aus meiner Sicht darin, besser auf die Wünsche unserer  Kunden eingehen zu können.

Bei Thalia werden in schneller Taktung Innovationen eingeführt. Sei es die Filialabholung, bei der online bestellte Bücher innerhalb von 2 Stunden in einer Buchhandlung abgeholt werden können. Oder das Beratungs- und Bezahl-Tablet für die Mitarbeiter vor Ort. Oder Innovationen im Webshop. Bei der Beurteilung, ob diese Neuerungen tatsächlich Kundenwünsche effektiv und effizient erfüllen, kann Advanced Analytics helfen. Im Gegensatz zur klassischen Business Intelligence – die weiterhin eine wichtige Rolle bei der Entscheidungsfindung im Unternehmen spielen wird – berücksichtigt Advanced Analytics stärker die Vielfalt des Kundenverhaltens und der unterschiedlichen Situationen in den Filialen. Verfahren wie etwa multivariate Regressionsanalyse, Entscheidungsbäume und statistische Hypothesentest können die in Unternehmen etablierte Analyse von deskriptiven Statistiken – etwa der Vergleich von Umsatzzahlen zwischen Pilot- und Vergleichsfilialen mit Pivot-Tabellen – ergänzen.

Predictive Analytics kann helfen verschiedenste Geschäftsprozesse individuell für Kunden zu gestalten. Generell können auf Grundlage von automatischen, in Echtzeit erstellten Vorhersagen Prozesse im Unternehmen optimiert werden. Außerdem kann Predictive Analytics Mitarbeiter bei wiederkehrenden Tätigkeiten unterstützen, beispielsweise in der Disposition.

Data Science Blog: Welche Fähigkeiten benötigen gute Data Scientists denn wirklich zur Geschäftsoptimierung? Wie wichtig ist das Domänenwissen?

Die wichtigsten Eigenschaften eines Data Scientist sind große Neugierde, eine sehr analytische Denkweise und eine exzellente Kommunikationsfähigkeit. Um mit Data Science erfolgreich Geschäftsprozesse zu optimieren, benötigt man ein breites Wissensspektrum: vom Geschäftsprozess über das IT-Datenmodell und das Know-how zur Entwicklung von Vorhersagemodellen bis hin zur Prozessintegration. Das ist nur im Team machbar. Domänenwissen spielt dabei eine wichtige Rolle, weshalb es für den Data Scientist essentiell ist sich mit den Prozessverantwortlichen und Business Analysten auszutauschen.

Data Science Blog: Sie bearbeiten Anwendungsfälle für den Handel. Können sich Branchen die Anwendungsfälle gegenseitig abschauen oder sollte jede Branche auf sich selbst fokussiert bleiben?

Es gibt sowohl Anwendungsfälle, die für den Einzelhandel und andere Branchen gleichermaßen relevant sind, als auch Themen, die für Thalia als Buchhändler besonders wichtig sind.

Die Individualisierung im eCommerce ist ein branchenübergreifendes Thema. Analytisches CRM, etwa das zielsichere Ausspielen von Kampagnen oder eine passgenaue Kundensegmentierung, ist für eine Versicherung oder Bank genauso wichtig wie für den Baumarkt oder den Buchhändler. Die Warenkorbanalyse mit statistischen Algorithmen ist ein klassisches Data Mining-Thema, das für den Einzelhandel generell interessant ist.

Natürlich muss man sich vorab über die Besonderheiten des jeweiligen Geschäftsumfeldes Gedanken machen, aber prinzipiell kann man von Unternehmen oder Branchen lernen, die Advanced und Predictive Analytics schon seit Jahren oder Jahrzehnten nutzen. Die passende IT-Infrastruktur und das entsprechende Interesse vom Fachbereich vorausgesetzt, eignen sich diese Anwendungsfälle damit besonders für den Einstieg in Advanced und Predictive Analytics – auch für Mittelständler.

Das Kerngeschäft des Buchhändlers  Thalia ist es, Kunden mit für sie interessanten Geschichten zusammen zu bringen. Die Geschichten selber bestehen aus Text. Die Produktbeschreibungen („Klappentexte“) und -besprechungen liegen in Textform vor. Und Kundenfeedback – sei es auf Thalia.de oder in sozialen Medien – erreicht uns als Text. Erkenntnisse aus Texten abzuleiten (Text Mining) ist deshalb für Thalia wichtiger als für andere Einzelhändler.

Data Science Blog: Welche Algorithmen und Tools verwenden Sie für Ihre Anwendungsfälle? Womit machen Sie eher gute, womit eher schlechte Erfahrungen?

Die Palette bei Thalia reicht von A wie Automated Machine Learning bis Z wie Zeitreihenanalyse. Ich selber arbeite aktuell mit verschiedenen Klassifikationsalgorithmen (z.B., regularisierte logistische Regression,  Random Forest, XGB, Naive Bayes, SAP’s Automated Predictive Library). Im Bereich Text Mining beschäftigen wir uns im Moment unter anderem mit Topic Models und Word2Vec.

Sowohl Algorithmus als auch die Software muss zum Verwendungszweck passen. Bei der Auswahl des Algorithmus gibt es häufig einen Trade-off zwischen Interpretierbarkeit und Prognosegüte. Das muss zusammen mit der Fachabteilung je nach Anwendungsfall abgewogen werden.

Mit flexibler Open Source-Software wie etwa R oder Python lassen sich schnell Proof-of-Concept-Projekte verwirklichen. Für die Integration in bestehende Prozesse sind manchmal kommerzielle Software-Lösungen besser.

Data Science Blog: Soviel zum kurz- und mittelfristigen Start in die Datennutzung. Wie sieht es für die langfristige Verankerung von Advanced/Predictive Analytics im Unternehmen aus? Was muss hier im Rahmen der IT-Infrastruktur bedacht und verankert werden?

Ohne Daten keine Datenanalyse. Je flexibler man auf unterschiedliche Daten im Unternehmen zugreifen kann, desto höher die Innovationsgeschwindigkeit durch Advanced/Predictive Analytics. „Datensilos“ abzubauen bzw. zu vermeiden ist also ein sehr wichtiges Thema. Hohe Datenqualität und die umfassende Dokumentation von Daten sind auch essentiell. Das gilt natürlich nicht nur für Advanced und Predictive Analytics sondern auch für Business Intelligence.

Die langfristige Verankerung von Advanced und Predictive Analytics im Unternehmen verlangt den Aufbau und die kontinuierliche Weiterentwicklung von Infrastruktur in Form von Hardware, Software, Kompetenzen und Wissen, sowie Organisationsformen und Prozessen. Wertschöpfung durch Advanced bzw. Predictive Analytics erfordert das konstruktive Zusammenspiel von Domänenexpertise aus der Fachabteilung, Wissen über Datenstrukturen und -modellen  aus der IT-Abteilung bzw. BI/BW-Systemen und tiefem statistischem Know-how. Nur durch die Zusammenarbeit verschiedener Unternehmensbereiche entstehen Erfolge für das gesamte Unternehmen.

Data Science Blog: Auch organisatorisch sollte langfristig sicherlich einiges bedacht werden. Wann sollten Projekte in den jeweiligen Fachbereichen direkt umgesetzt werden? Wann vielleicht besser in einer zentralen Daten-Abteilung?

Das hängt von einer Reihe von Faktoren ab. Bei hochgradig spezialisiertem Know-how, von dem unterschiedliche Fachbereiche profitieren können, kann es Synergie-Effekte geben, wenn dies zentral organisiert ist. Eine zentrale Einheit kann vielleicht auch Innovationen breiter in ein Unternehmen tragen. Wenn bestimmte Anwendungsszenarien von Advanced/Predictive Analytics für eine Fachabteilung hingegen eine zentrale Rolle spielen oder sie sich ein einem sehr schnelllebigen Umfeld bewegt, dann wäre eine fachliche und organisatorische Verankerung im Fachbereich wichtig.

Visual Question Answering with Keras – Part 2: Making Computers Intelligent to answer from images

Making Computers Intelligent to answer from images

This is my second blog on Visual Question Answering, in the last blog, I have introduced to VQA, available datasets and some of the real-life applications of VQA. If you have not gone through then I would highly recommend you to go through it. Click here for more details about it.

In this blog post, I will walk through the implementation of VQA in Keras.

You can download the dataset from here: https://visualqa.org/index.html. All my experiments were performed with VQA v2 and I have used a very tiny subset of entire dataset i.e all samples for training and testing from the validation set.

Table of contents:

  1. Preprocessing Data
  2. Process overview for VQA
  3. Data Preprocessing – Images
  4. Data Preprocessing through the spaCy library- Questions
  5. Model Architecture
  6. Defining model parameters
  7. Evaluating the model
  8. Final Thought
  9. References

NOTE: The purpose of this blog is not to get the state-of-art performance on VQA. But the idea is to get familiar with the concept. All my experiments were performed with the validation set only.

Full code on my Github here.


1. Preprocessing Data:

If you have downloaded the dataset then the question and answers (called as annotations) are in JSON format. I have provided the code to extract the questions, annotations and other useful information in my Github repository. All extracted information is stored in .txt file format. After executing code the preprocessing directory will have the following structure.

All text files will be used for training.


2. Process overview for VQA:

As we have discussed in previous post visual question answering is broken down into 2 broad-spectrum i.e. vision and text.  I will represent the Neural Network approach to this problem using the Convolutional Neural Network (for image data) and Recurrent Neural Network(for text data). 

If you are not familiar with RNN (more precisely LSTM) then I would highly recommend you to go through Colah’s blog and Andrej Karpathy blog. The concepts discussed in this blogs are extensively used in my post.

The main idea is to get features for images from CNN and features for the text from RNN and finally combine them to generate the answer by passing them through some fully connected layers. The below figure shows the same idea.


I have used VGG-16 to extract the features from the image and LSTM layers to extract the features from questions and combining them to get the answer.

3. Data Preprocessing – Images:

Images are nothing but one of the input to our model. But as you already may know that before feeding images to the model we need to convert into the fixed-size vector.

So we need to convert every image into a fixed-size vector then it can be fed to the neural network. For this, we will use the VGG-16 pretrained model. VGG-16 model architecture is trained on millions on the Imagenet dataset to classify the image into one of 1000 classes. Here our task is not to classify the image but to get the bottleneck features from the second last layer.

Hence after removing the softmax layer, we get a 4096-dimensional vector representation (bottleneck features) for each image.

Image Source: https://www.cs.toronto.edu/~frossard/post/vgg16/


For the VQA dataset, the images are from the COCO dataset and each image has unique id associated with it. All these images are passed through the VGG-16 architecture and their vector representation is stored in the “.mat” file along with id. So in actual, we need not have to implement VGG-16 architecture instead we just do look up into file with the id of the image at hand and we will get a 4096-dimensional vector representation for the image.

4. Data Preprocessing through the spaCy library- Questions:

spaCy is a free, open-source library for advanced Natural Language Processing (NLP) in Python. As we have converted images into a fixed 4096-dimensional vector we also need to convert questions into a fixed-size vector representation. For installing spaCy click here

You might know that for training word embeddings in Keras we have a layer called an Embedding layer which takes a word and embeds it into a higher dimensional vector representation. But by using the spaCy library we do not have to train the get the vector representation in higher dimensions.


This model is actually trained on billions of tokens of the large corpus. So we just need to call the vector method of spaCy class and will get vector representation for word.

After fitting, the vector method on tokens of each question will get the 300-dimensional fixed representation for each word.

5. Model Architecture:

In our problem the input consists of two parts i.e an image vector, and a question, we cannot use the Sequential API of the Keras library. For this reason, we use the Functional API which allows us to create multiple models and finally merge models.

The below picture shows the high-level architecture idea of submodules of neural network.

After concatenating the 2 different models the summary will look like the following.

The below plot helps us to visualize neural network architecture and to understand the two types of input:


6. Defining model parameters:

The hyperparameters that we are going to use for our model is defined as follows:

If you know what this parameter means then you can play around it and can get better results.

Time Taken: I used the GPU on https://colab.research.google.com and hence it took me approximately 2 hours to train the model for 5 epochs. However, if you train it on a PC without GPU, it could take more time depending on the configuration of your machine.

7. Evaluating the model:

Since I have used the very small dataset for performing these experiments I am not able to get very good accuracy. The below code will calculate the accuracy of the model.


Since I have trained a model multiple times with different parameters you will not get the same accuracy as me. If you want you can directly download mode.h5 file from my google drive.


8. Final Thoughts:

One of the interesting thing about VQA is that it a completely new field. So there is absolutely no end to what you can do to solve this problem. Below are some tips while replicating the code.

  1. Start with a very small subset of data: When you start implementing I suggest you start with a very small amount of data. Because once you are ready with the whole setup then you can scale it any time.
  2. Understand the code: Understanding code line by line is very much helpful to match your theoretical knowledge. So for that, I suggest you can take very few samples(maybe 20 or less) and run a small chunk (2 to 3 lines) of code to get the functionality of each part.
  3. Be patient: One of the mistakes that I did while starting with this project was to do everything at one go. If you get some error while replicating code spend 4 to 5 days harder on that. Even after that if you won’t able to solve, I would suggest you resume after a break of 1 or 2 days. 

VQA is the intersection of NLP and CV and hopefully, this project will give you a better understanding (more precisely practically) with most of the deep learning concepts.

If you want to improve the performance of the model below are few tips you can try:

  1. Use larger datasets
  2. Try Building more complex models like Attention, etc
  3. Try using other pre-trained word embeddings like Glove 
  4. Try using a different architecture 
  5. Do more hyperparameter tuning

The list is endless and it goes on.

In the blog, I have not provided the complete code you can get it from my Github repository.

9. References:

  1. https://blog.floydhub.com/asking-questions-to-images-with-deep-learning/
  2. https://tryolabs.com/blog/2018/03/01/introduction-to-visual-question-answering/
  3. https://github.com/sominwadhwa/vqamd_floyd

DATANOMIQ MeetUp: Interactive Data Exploration and GUI’s in JupyterNotebooks

After our first successful collaboration Meetup with Mister Spex, we straightly continue with our next partner: VW Digital Labs!

Join us on Wednesday, October 9 for our DATANOMIQ Data Science Meetup at VW Digital Labs and get inspired.

When:
Wednesday, October 9, time TBA

Where:
VW Digital Labs
Stralauer Allee 7, 10245 Berlin


AGENDA
18:30 doors open
19:00 Interactive Data Exploration and GUI’s in JupyterNotebooks – Christopher Kipp.
– using ipywidgets to get basic UI components and connet them
– qgrid to make Dataframes interactive (sortable, filterable, …)
– building interactive visualisations with bqplot

19:20 Q&A

10 minute break

19:40 second presentation
20:00 Q&A

20:15 networking


FREE ENTRY, snacks and drinks sponsored by VW digital labs.

Make sure to get your ticket: https://www.eventbrite.de/e/datanomiq-meetup-interactive-data-exploration-and-guis-in-jupyternotebook-tickets-72931655545

Entrance only with registration.


Join our MeetUp group: https://www.meetup.com/de-DE/DATANOMIQ-Data-Science-Berlin/

Zertifikatsstudium „Data Science and Big Data“ 2020 an der TU Dortmund

Jetzt bewerben!

Komplexe Daten aufbereiten und analysieren, um daraus zukünftige Entwicklungen abzulesen: das lernen Sie im berufsbegleitenden Zertifikatsstudium „Data Science and Big Data“ an der TU Dortmund.

Die Zielgruppe sind Fachkräfte, die sich in ihrer Berufspraxis mit Fragestellungen zum Thema Datenanalyse und Big Data befassen, jedoch nun tiefergehende Kenntnisse in dem Themenfeld erhalten möchten. Von der Analyse über das Management bis zur zielgerichteten Darstellung der Ergebnisse lernen die Teilnehmenden dabei Methoden der Disziplinen Statistik, Informatik und Journalistik kennen.

Renommierte Wissenschaftlerinnen und Wissenschaftler vermitteln den Teilnehmerinnen und Teilnehmern die neuesten datenwissenschaftlichen Erkenntnisse und zeigen, wie dieses Wissen praxisnah im eigenen Big-Data Projekt umgesetzt werden kann.

Die nächste Studiengruppe startet im Februar 2020, der Bewerbungsschluss ist am 4. November 2019. Die Anzahl der verfügbaren Plätze ist begrenzt, eine rechtzeitige Bewerbung lohnt sich daher.

Nähere Informationen finden Sie unter: http://www.zhb.tu-dortmund.de/datascience

Dortmunder R-Kurse | Neue Termine im Herbst 2019

Erweitern Sie Ihre Fähigkeiten in der Anwendung der Open Source Statistiksoftware R: In der Tagesseminarreihe „Dortmunder R-Kurse“ an der Technischen Universität Dortmund geben erfahrene Wissenschaftler der Fakultät Statistik ihre Expertise an Sie weiter.

Sie erwerben dadurch Qualifikationen zur selbstständigen Analyse eigener Daten sowie Schlüsselkompetenzen im Umgang mit Big Data. Die Kurse richten sich an Anwenderinnen und Anwender jeder Fachrichtung aus Industrie und Forschungseinrichtungen, die ihre Daten mit R auswerten möchten.

Das Angebot umfasst Kurse für Einsteiger und Fortgeschrittene, wo Sie Ihre Kenntnisse in R erlernen und vertiefen können.

  • R Basiskurs
    Inhalte: Grundlagen zur ersten Datenanalyse
    Termine: 5. & 6. November 2019
  • R Vertiefungskurs
    Inhalt: Effiziente Analysen mit R
    Termine: 21. & 22. November 2019
  • Weitere Inhouse Themen auf Anfrage: Machine Learning in R, Shiny Apps mit R

Weitere Informationen zu den R-Kursen finden Sie unter:
http://dortmunder-r-kurse.de/