Posts

Process Analytics – Data Analysis for Process Audit & Improvement

Process Mining: Innovative data analysis for process optimization and audit

Step-by-Step: New ways to detect compliance violations with Process Analytics

In the course of the advancing digitization, an enormous upheaval of everyday work is currently taking place to ensure the complete recording of all steps in IT systems. In addition, companies are increasingly confronted with increasingly demanding regulatory requirements on their IT systems.


Read this article in German:
“Process Mining: Innovative Analyse von Datenspuren für Audit und Forensik “


The unstoppable trend towards a connected world will further increase the possibilities of process transparency, but many processes in the company area are already covered by one or more IT systems. Each employee, as well as any automated process, leaves many data traces in IT backend systems, from which processes can be replicated retroactively or in real time. These include both obvious processes, such as the entry of a recorded purchase order or invoice, as well as partially hidden processes, such as the modification of certain entries or deletion of these business objects.

1 Understanding Process Analytics

Process Analytics is a data-driven methodology of the actual process analysis, which originates in forensics. In the wake of the increasing importance of computer crime, it became necessary to identify and analyze the data traces that potential criminals left behind in IT systems in order to reconstruct the event as much as possible.

With the trend towards Big Data Analytics, Process Analytics has not only received new data bases, but has also been further developed as an analytical method. In addition, the visualization enables the analyst or the report recipient to have a deeper understanding of even more complex business processes.

While conventional process analysis primarily involves employee interviews and monitoring of the employees at the desk in order to determine actual processes, Process Analytics is a leading method, which is purely fact-based and thus objectively approaching the processes. It is not the employees who are asked, but the IT systems, which not only store all the business objects recorded in a table-oriented manner, but also all process activities. Every IT system for enterprise purposes log all relevant activities of the whole business process, in the background and invisible to the users, such as orders, invoices or customer orders, with a time stamp.

2 The right choice of the processes to analyze

Today almost every company works with at least one ERP system. As other systems are often used, it is clear which processes can not be analyzed: Those processes, which are still carried out exclusively on paper and in the minds of the employees, which are typical decision-making processes at the strategic level and not logged in IT systems.

Operational processes, however, are generally recorded almost seamlessly in IT systems. Furthermore, almost all operational decisions are recorded by status flags in datasets.

The operational processes, which can be reconstructed and analyzed with Process Mining very well and which are of equal interest from the point of view of compliance, include for example:

– Procurement

– Logistics / Transport

– Sales / Ordering

– Warranty / Claim Management

– Human Resource Management

Process Analytics enables the greatest possible transparency across all business processes, regardless of the sector and the department. Typical case IDs are, for example, sales order number, procurement order number, customer or material numbers.

3 Selection of relevant IT systems

In principle, every IT system used in the company should be examined with regard to the relevance for the process to be analyzed. As a rule, only the ERP system (SAP ERP or others) is relevant for the analysis of the purchasing processes. However, for other process areas there might be other IT systems interesting too, for example separate accounting systems, a CRM or a MES system, which must then also be included.

Occasionally, external data should also be integrated if they provide important process information from externally stored data sources – for example, data from logistics partners.

4 Data Preparation

Before the start of the data-driven process analysis, the data directly or indirectly indicating process activities must be identified, extracted and processed in the data sources. The data are stored in database tables and server logs and are collected via a data warehousing procedure and converted into a process protocol or – also called – event log.

The event log is usually a very large and wide table which, in addition to the actual process activities, also contains parameters which can be used to filter cases and activities. The benefit of this filter option is, for example, to show only process flows where special product groups, prices, quantities, volumes, departments or employee groups are involved.

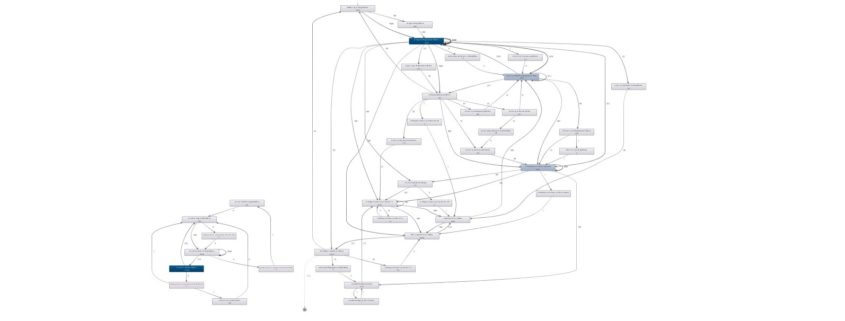
5 Analysis Execution

The actual inspection is done visually and thus intuitively with an interactive process flow diagram, which represents the actual processes as they could be extracted from the IT systems. The event log generated by the data preparation is loaded into a data visualization software (e.g. Celonis PM Software), which displays this log by using the case IDs and time stamps and transforms this information in a graphical process network. The process flows are therefore not modeled by human “process thinkers”, as is the case with the target processes, but show the real process flows given by the IT systems. Process Mining means, that our enterprise databases “talk” about their view of the process.

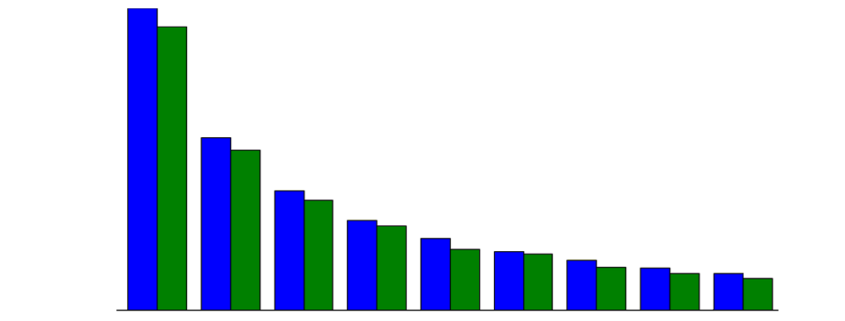
The process flows are visualized and statistically evaluated so that concrete statements can be made about the process performance and risk estimations relevant to compliance.

6 Deviation from target processes

The possibility of intuitive filtering of the process presentation also enables an analysis of all deviation of our real process from the desired target process sequences.

The deviation of the actual processes from the target processes is usually underestimated even by IT-affine managers – with Process Analytics all deviations and the general process complexity can now be investigated.

6 Detection of process control violations

The implementation of process controls is an integral part of a professional internal control system (ICS), but the actual observance of these controls is often not proven. Process Analytics allows circumventing the dual control principle or the detection of functional separation conflicts. In addition, the deliberate removal of internal control mechanisms by executives or the incorrect configuration of the IT systems are clearly visible.

7 Detection of previously unknown behavioral patterns

After checking compliance with existing controls, Process Analytics continues to be used to recognize previously unknown patterns in process networks, which point to risks or even concrete fraud cases and are not detected by any control due to their previously unknown nature. In particular, the complexity of everyday process interlacing, which is often underestimated as already mentioned, only reveals fraud scenarios that would previously not have been conceivable.

8 Reporting – also possible in real time

As a highly effective audit analysis, Process Analytics is already an iterative test at intervals of three to twelve months. After the initial implementation, compliance violations, weak or even ineffective controls, and even cases of fraud, are detected reliably. The findings can be used in the aftermath to stop the weaknesses. A further implementation of the analysis after a waiting period makes it possible to assess the effectiveness of the measures taken.

In some application scenarios, the seamless integration of the process analysis with the visual dashboard to the IT system landscape is recommended so that processes can be monitored in near real-time. This connection can also be supplemented by notification systems, so that decision makers and auditors are automatically informed about the latest process bottlenecks or violations via SMS or e-mail.

Fazit

Process Analytics is, in the course of the digitalization, the highly effective methodology from the area of ​​Big Data Analysis for detecting compliance-relevant events throughout the company and also providing visual support for forensic data analysis. Since this is a method, and not a software, an expansion of the IT system landscape, especially for entry, is not absolutely necessary, but can be carried out by internal or external employees at regular intervals.

Privacy, Security and Ethics in Process Mining – Article Series

When I moved to the Netherlands 12 years ago and started grocery shopping at one of the local supermarket chains, Albert Heijn, I initially resisted getting their Bonus card (a loyalty card for discounts), because I did not want the company to track my purchases. I felt that using this information would help them to manipulate me by arranging or advertising products in a way that would make me buy more than I wanted to. It simply felt wrong.

Read this article in German:
Datenschutz, Sicherheit und Ethik beim Process Mining – Artikelserie

The truth is that no data analysis technique is intrinsically good or bad. It is always in the hands of the people using the technology to make it productive and constructive. For example, while supermarkets could use the information tracked through the loyalty cards of their customers to make sure that we have to take the longest route through the store to get our typical items (passing by as many other products as possible), they can also use this information to make the shopping experience more pleasant, and to offer more products that we like.

Most companies have started to use data analysis techniques to analyze their data in one way or the other. These data analyses can bring enormous opportunities for the companies and for their customers, but with the increased use of data science the question of ethics and responsible use also grows more dominant. Initiatives like the Responsible Data Science seminar series [1] take on this topic by raising awareness and encouraging researchers to develop algorithms that have concepts like fairness, accuracy, confidentiality, and transparency built in (see Wil van der Aalst’s presentation on Responsible Data Science at Process Mining Camp 2016).

Process Mining can provide you with amazing insights about your processes, and fuel your improvement initiatives with inspiration and enthusiasm, if you approach it in the right way. But how can you ensure that you use process mining responsibly? What should you pay attention to when you introduce process mining in your own organization?

In this article series, we provide you four guidelines that you can follow to prepare your process mining analysis in a responsible way:

Part 1 of 4: Clarify the Goal of the Analysis

Part 2 of 4: Responsible Handling of Data

Part 3 of 4: Consider Anonymization

Part 4 of 4: Establish a collaborative Culture

Acknowledgements

We would like to thank Frank van Geffen and Léonard Studer, who initiated the first discussions in the workgroup around responsible process mining in 2015. Furthermore, we would like to thank Moe Wynn, Felix Mannhardt and Wil van der Aalst for their feedback on earlier versions of this article.

Benford-Analyse

Das Benfordsche Gesetz beschreibt eine Verteilung der Ziffernstrukturen von Zahlen in empirischen Datensätzen. Dieses Gesetz, welches kein striktes Naturgesetz ist, sondern eher ein Erklärungsversuch in der Natur und in der Gesellschaft vorkommende Zahlenmuster vorherzusagen.

Das Benfordsche Gesetz beruht auf der Tatsache, dass die Ziffern in einem Zahlensystem hierarchisch aufeinander aufbauen: Es beginnt mit der 1, dann folgt die 2, dann die 3 usw. In Kombination mit bestimmten Gesetzen der Natur (der natürliche Wachstumsprozess, dabei möglichst energiesparend wachsen/überleben) oder Ökonomie (so günstig wie möglich einkaufen) ist gemäß des Benfordschen Gesetz zu erwarten, dass die Ziffer 1 häufiger vorkommt als die 2, die wiederum häufiger vorkommt als die 3. Die Ziffer 9 braucht demnach den längsten Weg und kommt entsprechend verhältnismäßig seltener vor.

Dieses Phönomen hilft uns bei echten Zufallszahlen nicht weiter, denn dann sind alle Ziffern nicht aufeinander aufbauend, sondern mehr oder weniger gleichberechtigt in ihrem Auftrauen. Bei der klassischen und axiomatischen Wahrscheinlichkeit kommen wir damit also nicht ans Ziel.

Die Benford-Analyse ist im Grunde eine Ausreißeranalyse: Wir vergleichen Ziffernmuster in Datenbeständen mit der Erwartungshaltung des Benfordschen Gesetzes. Weicht das Muster von dieser Erwartung ab, haben wir Diskussionsbedarf.

Moderne Zahlensysteme sind Stellenwert-Zahlensysteme. Neben den Dual-, Oktal- und Hexadezimalzahlensystemen, mit denen sich eigentlich nur Informatiker befassen, wird unser Alltag vom Dezimalzahlensystem geprägt. In diesem Zahlensystem hat jede Stelle die Basis 10 (“dezi”) und einen Exponenten entsprechend des Stellenwertes, multipliziert mit der Ziffer d. Es ist eine Exponentialfunktion, die den Wert der Ziffern in bestimmter Reihenfolge ermittelt:

Z =\sum_{i=-n}^{m}d_{i}\cdot10^{i}

Die Benford-Analyse wird meistens nur für die erste Ziffer (also höchster Stellenwert!) durchgeführt. Dies werden wir gleich einmal beispielhaft umsetzen.

Die Wahrscheinlichkeit des Auftretens der ersten “anführenden” Ziffer d ist ein Logarithmus zur Basis B. Da wir im alltäglichen Leben – wie gesagt – nur im Dezimalzahlensystem arbeiten, ist für uns B = 10.

p(d)=\log_{B}\left( 1 +\frac{1}{d} \right)

Im Standard-Python lässt sich diese Formel leicht mit einer Schleife umsetzen:

Benford-Algorithmus in Python mit NumPy und Pandas

Nachfolgend setzen wir eine Benford-Analyse als Minimalbeispiel in NumPy und Pandas um.

Nun möchten wir eine Tabelle erstellen, mit zwei Spalten, eine für die Ziffer (Digit), die andere für die relative Häufigkeit der Ziffer (Benford Law). Dazu nutzen wir das DataFrame aus dem Pandas-Paket. Das DataFrame erstellen wir aus den zwei zuvor erstellten NumPy-Arrays.

Man könnte sicherlich auch den natürlichen Index des DataFrames nutzen, indem wir diesen nur um jeweils 1 erhöhen, aber das verwirrt später nur und tun wir uns jetzt daher lieber nicht an…

Das Dataframe-Objekt kann direkt plotten (das läuft über die matplotlib, die wir aber nicht direkt einbinden müssen):benfordsches_gesetz_dezimalzahlen_ziffern

Diese neun Balken zeigen die Verteilung der Ziffernhäufigkeit nach dem Benfordschen Gesetz, diese Verteilung ist unsere Erwartungshaltung an andere nummerische Datenbestände, wenn diese einem natürlichen Wachstum unterliegen.

Analyse der Verteilung der ersten Ziffer in Zahlungsdaten

Jetzt brauchen wir Daten mit nummerischen Beträgen, die wir nach Benford testen möchten. Für dieses Beispiel nehme ich aus einem ein SAP-Testdatensatz die Spalte ‘DMBTR’ der Tabelle ‘BSEG’ (SAP FI). Die Spalte ‘DMBTR’ steht für “Betrag in Hauswährung’, die ‘BSEG’ ist die Tabelle für die buchhalterischen Belegsegmente.
Die Datei mit den Testdaten ist über diesen Link zum Download verfügbar (Klick) und enthält 40.000 Beträge.

Wir laden den Inhalt der Datei via NumPy.LoadTxt() und machen aus dem resultierenden NumPy-Array wieder ein Pandas.DataFrame und holen uns die jeweils erste Ziffer für alle Einträge als Liste zurück.

Die Einträge der ersten Ziffer in firstDigits nehmen wir uns dann vor und gruppieren diese über die Ziffer und ihrer Anzahl relativ zur Gesamtanzahl an Einträgen.

Wenn wir die Werte der relativen Anzahl aufsummieren, landen wir bei 94% statt 100%. Dies liegt daran, dass wir die Ziffer 0 ausgelassen haben, diese jedoch tatsächlich vorkommt, jedoch nur bei Beträgen kleiner 1.00. Daher lassen wir die Ziffer 0 außenvor. Wer jedoch mehr als nur die erste Ziffer prüfen möchte, wird die Ziffer 0 wieder mit in die Betrachtung nehmen wollen. Nur zur Probe nocheinmal mit der Ziffer 0, so kommen wir auf die 100% der aufsummierten relativen Häufigkeiten:

Nun erstellen wir ein weiteres Pandas.DataFrame, mit zwei Spalten: Die Ziffern (Digit) und die tatsächliche Häufigkeit in der Gesamtpopulation (Real Distribution):

Abgleich der Ziffernhäufigkeit mit der Erwartung

Nun bringen wir die theoretische Verteilung der Ziffern, also nach dem zuvor genannten Logarithmus, und die tatsächliche Verteilung der ersten Ziffern in unseren Zahlungsdaten in einem Plot zusammen:

In dem Plot wird deutlich, dass die Verteilung der führenden Ziffer in unseren Zahlungsdaten in ziemlich genau unserer Erwartung nach dem Benfordschen Gesetz entspricht. Es sind keine außerordentlichen Ausreißer erkennbar. Das wäre auch absolut nicht zu erwarten gewesen, denn der Datensatz ist mit 40.000 Einträgen umfassend genug, um dieses Muster gut abbilden zu können und von einer Manipulation dieser Beträge im SAP ist ebenfalls nicht auszugehen.

benford-analyse-python-fuer-sap-bseg-dmbtr

Gegenüberstellung: Computer-generierte Zufallszahlen

Jetzt wollen wir nochmal kurz darauf zurück kommen, dass das Benfordsche Gesetz für Zufallszahlen nicht unwendbar ist. Bei echten Zufallszahlen bin ich mir da auch sehr sicher. Echte Zufallszahlen ergeben sich beispielweise beim Lotto, wenn die Bälle mit Einzel-Ziffern durch eine Drehkugel hüpfen. Die Lottozahl-Ermittlung erfolgt durch die Zusammenstellung von jeweils gleichberechtigt erzeugten Ziffern.
Doch wie ist dies bei vom Computer generierten Zufallszahlen? Immerhin heißt es in der Informatik, dass ein Computer im Grunde keine Zufallszahlen erzeugen kann, sondern diese via Takt und Zeit erzeugt und dann durchmischt. Wir “faken” unsere Zahlungsdaten nun einfach mal via Zufallszahlen. Hierzu erstellen wir in NumPy ein Array mit 2000 Einträgen einer Zufallszahl (NumPy.Random.rand(), erzeugt floats 0.xxxxxxxx) und multiplizieren diese mit einem zufälligen Integer (Random.randint()) zwischen 0 und 1000.

Erzeugen wir die obigen Datenstrukturen erneut, zeigt sich, dass die Verteilung der Zufallszahlen ganz anders aussieht: (vier unterschiedliche Durchläufe)

benford-analyse-python-numpy-pseudo-zufallszahlen

Anwendung in der Praxis

Data Scientists machen sich das Benfordsche Gesetz zu Nutze, um Auffälligkeiten in Zahlen aufzuspüren. In der Wirtschaftsprüfung und Forensik ist diese Analyse-Methode recht beliebt, um sich einen Eindruck von nummerischen Daten zu verschaffen, insbesondere von Finanztransaktionen. Die Auffälligkeit durch Abweichung vom Benfordchen Gesetz entsteht z. B. dadurch, dass Menschen eine unbewusste Vorliebe für bestimmte Ziffern oder Zahlen haben. Greifen Menschen also in “natürliche” Daten massenhaft (z. B. durch Copy&Paste) ein, ist es wahrscheinlich, dass sie damit auch vom Muster des Benfordschen Gesetzes abweichen. Weicht das Muster in Zahlungsströmen vom Bendfordsche Erwartungsmuster für bestimmte Ziffern signifikant ab, könnte dies auf Fälle von unnatürlichen Eingriffen hindeuten.

Die Benford-Analyse wird auch gerne eingesetzt, um Datenfälschungen in wissenschaftlichen Arbeiten oder Bilanzfälschungen aufzudecken. Die Benford-Analyse ist dabei jedoch kein Beweis, sondern liefert nur die Indizien, die Detailanalysen nach sich ziehen können/müssen.