5 Applications for Location-Based Data in 2020

Location-based data enables giving people relevant information based on where they are at any given moment. Here are five location data applications to look for in 2020 and beyond. 

1. Increasing Sales and Reducing Frustration

One 2019 report indicated that 89% of the marketers who used geo data saw increased sales within their customer bases. Sometimes, the ideal way to boost sales is to convert what would be a frustration into something positive. 

A French campaign associated with the Actimel yogurt brand achieved this by sending targeted, encouraging messages to drivers who used the Waze navigation app and appeared to have made a wrong turn or got caught in traffic. 

For example, a driver might get a message that said, “Instead of getting mad and honking your horn, pump up the jams! #StayStrong.” The three-month campaign saw a 140% increase in ad recall. 

More recently, home furnishing brand IKEA launched a campaign in Dubai where people can get free stuff for making a long trip to a store. The freebies get more valuable as a person’s commute time increases. The catch is that participants have to activate location settings on their phones and enable Google Maps. Driving five minutes to a store got a person a free veggie hot dog, and they’d get a complimentary table for traveling 49 minutes. 

2. Offering Tailored Ad Targeting in Medical Offices

Pharmaceutical companies are starting to rely on companies that send targeted ads to patients connected to the Wi-Fi in doctors’ offices. One such provider is Semcasting. A recent effort involved sending ads to cardiology offices for a type of drug that lowers cholesterol levels in the blood. 

The company has taken a similar approach for an over-the-counter pediatric drug and a medication to relieve migraine headaches, among others. Such initiatives cause a 10% boost in the halo effect, plus a 1.5% uptick in sales. The first perk relates to the favoritism that people feel towards other products a company makes once they like one of them.

However, location data applications related to health care arguably require special attention regarding privacy. Patients may feel uneasy if they believe that companies are watching them and know they need a particular kind of medical treatment. 

3. Facilitating the Deployment of the 5G Network

The 5G network is coming soon, and network operators are working hard to roll it out. Statistics indicate that the 5G infrastructure investment will total $275 billion over seven years. Geodata can help network brands decide where to deploy 5G connectivity first.

Moreover, once a company offers 5G in an area, marketing teams can use location data to determine which neighborhoods to target when contacting potential customers. Most companies that currently have 5G within their product lineups have carefully chosen which areas are at the top of the list to receive 5G, and that practice will continue throughout 2020. 

It’s easy to envision a scenario whereby people can send error reports to 5G providers by using location data. For example, a company could say that having location data collection enabled on a 5G-powered smartphone allows a technician to determine if there’s a persistent problem with coverage.

Since the 5G network is still, it’s impossible to predict all the ways that a telecommunications operator might use location data to make their installations maximally profitable. However, the potential is there for forward-thinking brands to seize. 

4. Helping People Know About the Events in Their Areas

SoundHound, Inc. and Wcities recently announced a partnership that will rely on location-based data to keep people in the loop about upcoming local events. People can use a conversational intelligence platform that has information about more than 20,000 cities around the world. 

Users also don’t need to mention their locations in voice queries. They could say, for example, “Which bands are playing downtown tonight?” or “Can you give me some events happening on the east side tomorrow?” They can also ask something associated with a longer timespan, such as “Are there any wine festivals happening this month?”

People can say follow-up commands, too. They might ask what the weather forecast is after hearing about an outdoor event they want to attend. The system also supports booking an Uber, letting people get to the happening without hassles. 

5. Using Location-Based Data for Matchmaking

In honor of Valentine’s Day 2020, students from more than two dozen U.S colleges signed up for a matchmaking opportunity. It, at least in part, uses their location data to work. 

Participants answer school-specific questions, and their responses help them find a friend or something more. The platform uses algorithms to connect people with like-minded individuals. 

However, the company that provides the service can also give a breakdown of which residence halls have the most people taking part, or whether people generally live off-campus. This example is not the first time a university used location data by any means, but it’s different from the usual approach. 

Location Data Applications Abound

These five examples show there are no limits to how a company might use location data. However, they must do so with care, protecting user privacy while maintaining a high level of data quality. 

5 Things You Should Know About Data Mining

The majority of people spend about twenty-four hours online every week. In that time they give out enough information for big data to know a lot about them. Having people collecting and compiling your data might seem scary but it might have been helpful for you in the past.


If you have ever been surprised to find an ad targeted toward something you were talking about earlier or an invention made based on something you were googling, then you already know that data mining can be helpful. Advanced education in data mining can be an awesome resource, so it may pay to have a personal tutor skilled in the area to help you understand. 


It is understandable to be unsure of a system that collects all of the information online so that they can learn more about you. Luckily, so much data is put out every day it is unlikely data mining is focusing on any of your important information. Here are a few statistics you should know about mining.


1. Data Mining Is Used In Crime Scenes

Using a variation of earthquake prediction software and data, the Los Angeles police department and researchers were able to predict crime within five hundred feet. As they learn how to compile and understand more data patterns, crime detecting will become more accurate.


Using their data the Los Angeles police department was able to stop thief activity by thirty-three percent. They were also able to predict violent crime by about twenty-one percent. Those are not perfect numbers, but they are better than before and will get even more impressive as time goes on. 


The fact that data mining is able to pick up on crime statistics and compile all of that data to give an accurate picture of where crime is likely to occur is amazing. It gives a place to look and is able to help stop crime as it starts.


2. Data Mining Helps With Sales

A great story about data mining in sales is the example of Walmart putting beer near the diapers. The story claims that through measuring statistics and mining data it was found that when men purchase diapers they are also likely to buy a pack of beer. Walmart collected that data and put it to good use by putting the beer next to the diapers.


The amount of truth in that story/example is debatable, but it has made data mining popular in most retail stores. Finding which products are often bought together can give insight into where to put products in a store. This practice has increased sales in both items immensely just because people tend to purchase items near one another more than they would if they had to walk to get the second item. 


Putting a lot of stock in the data-gathering teams that big stores build does not always work. There have been plenty of times when data teams failed and sales plummeted. Often, the benefits outweigh the potential failure, however, and many stores now use data mining to make a lot of big decisions about their sales.


3. It’s Helping With Predicting Disease 


In 2009 Google began work to be able to predict the winter flu. Google went through the fifty million most searched words and then compared them with what the CDC was finding during the 2003-2008 flu seasons. With that information google was able to help predict the next winter flu outbreak even down to the states it hit the hardest. 


Since 2009, data mining has gotten much better at predicting disease. Since the internet is a newer invention it is still growing and data mining is still getting better. Hopefully, in the future, we will be able to predict disease breakouts quickly and accurately. 


With new data mining techniques and research in the medical field, there is hope that doctors will be able to narrow down problems in the heart. As the information grows and more data is entered the medical field gets closer to solving problems through data. It is something that is going to help cure diseases more quickly and find the root of a problem.


4. Some Data Mining Gets Ignored

Interestingly, very little of the data that companies collect from you is actually used. “Big data Companies” do not use about eighty-eight percent of the data they have. It is incredibly difficult to use all of the millions of bits of data that go through big data companies every day.


The more people that are used for data mining and the more data companies are actually able to filter through, the better the online experience will be. It might be a bit frightening to think of someone going through what you are doing online, but no one is touching any of the information that you keep private. Big data is using the information you put out into the world and using that data to come to conclusions and make the world a better place.


There is so much information being put onto the internet at all times. Twenty-four hours a week is the average amount of time a single person spends on the internet, but there are plenty of people who spend more time than that. All of that information takes a lot of people to sift through and there are not enough people in the data mining industry to currently actually go through the majority of the data being put online.


5. Too Many Data Mining Jobs

Interestingly, the data industry is booming. In general, there are an amazing amount of careers opening on the internet every day. The industry is growing so quickly that there are not enough people to fill the jobs that are being created.


The lack of talent in the industry means there is plenty of room for new people who want to go into the data mining industry. It was predicted that by 2018 there would be a shortage of 140,000 with deep analytical skills. With the lack of jobs that are being discussed, it is amazing that there is such a shortage in the data industry. 


If big data is only able to wade through less than half of the data being collected then we are wasting a resource. The more people who go into an analytics or computer career the more information we will be able to collect and utilize. There are currently more jobs than there are people in the data mining field and that needs to be corrected.


To Conclude

The data mining industry is making great strides. Big data is trying to use the information they collect to sell more things to you but also to improve the world. Also, there is something very convenient about your computer knowing the type of things you want to buy and showing you them immediately. 


Data mining has been able to help predict crime in Los Angeles and lower crime rates. It has also helped companies know what items are commonly purchased together so that stores can be organized more efficiently. Data mining has even been able to predict the outbreak of disease down to the state.


Even with so much data being ignored and so many jobs left empty, data mining is doing incredible things. The entire internet is constantly growing and the data mining is growing right along with it. As the data mining industry climbs and more people find their careers mining data the more we will learn and the more facts we will find.


Artikelserie: BI Tools im Vergleich – Tableau

Dies ist ein Artikel der Artikel-Serie “BI Tools im Vergleich – Einführung und Motivation“. Solltet ihr gerade erst eingestiegen sein, dann schaut euch ruhig vorher einmal die einführenden Worte und die Ausführungen zur Datenbasis an. Power BI machte den Auftakt und ihr findet den Artikel hier.

Lizenzmodell

Tableau stellt seinen Kunden zu allererst vor die Wahl, wo und von wem die Infrastruktur betrieben werden soll. Einen preislichen Vorteil hat der Kunde bei der Wahl einer selbstverwaltenden Lösung unter Nutzung von Tableau Server. Die Alternative ist eine Cloud-Lösung, bereitgestellt und verwaltet von Tableau. Bei dieser Variante wird Tableau Server durch Tableau Online ersetzt, wobei jede dieser Optionen die gleichen Funktionalitäten mit sich bringen. Bereits das Lizenzmodell definiert unterschiedliche Rollen an Usern, welche in drei verschiedene Lizenztypen unterteilt und unterschiedlich bepreist sind (siehe Grafik). So kann der User die Rolle eines Creators, Explorers oder Viewers einnehmen.
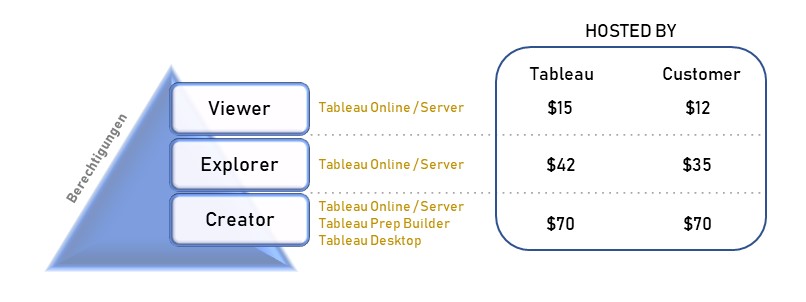
Der Creator ist befähigt, alle Funktionen von Tableau zu nutzen, sofern ein Unternehmen die angebotenen Add-ons hinzukauft. Die Lizenz Explorer ermöglicht es dem User, durch den Creator vordefinierte Datasets in Eigenregie zu analysieren und zu visualisieren. Demnach obliegt dem Creator, und somit einer kleinen Personengruppe, die Datenbereitstellung, womit eine Single Source of Truth garantiert werden soll. Der Viewer hat nur die Möglichkeit Berichte zu konsumieren, zu teilen und herunterzuladen. Wobei in Bezug auf Letzteres der Viewer limitiert ist, da dieser nicht die kompletten zugrundeliegenden Daten herunterladen kann. Lediglich eine Aggregation, auf welcher die Visualisierung beruht, kann heruntergeladen werden. Ein Vergleich zeigt die wesentlichen Berechtigungen je Lizenz.

Der Einstieg bei Tableau ist für Organisationen nicht unter 106 Lizenzen (100 Viewer, 5 Explorer, 1 Creator) möglich, und Kosten von mindestens $1445 im Monat müssen einkalkuliert werden.

Wie bereits erwähnt, existieren Leistungserweiterungen, sogennante Add-ons. Die selbstverwaltende Alternative unter Nutzung von Tableau Server (hosted by customer) kann um das Tableau Data Management Add‑on und das Server Management Add‑on erweitert werden. Hauptsächlich zur Serveradministration, Datenverwaltung und -bereitstellung konzipiert sind die Features in vielen Fällen entbehrlich. Für die zweite Alternative (hosted by Tableau) kann der Kunde ebenfalls das Tableau Data Management Add‑on sowie sogenannte Resource Blocks dazu kaufen. Letzteres lässt bereits im Namen einen kapazitätsabhängigen Kostenfaktor vermuten, welcher zur Skalierung dient. Die beiden Add‑ons wiederum erhöhen die Kosten einer jeden Lizenz, was erhebliche Kostensteigerungen mit sich bringen kann. Das Data Management Add‑on soll als Beispiel die Kostenrelevanz verdeutlichen. Es gelten $5,50 je Lizenz für beide Hosting Varianten. Ein Unternehmen bezieht 600 Lizenzen (50 Creator, 150 Explorer und 400 Viewer) und hosted Tableau Server auf einer selbstgewählten Infrastruktur. Beim Zukauf des Add‑ons erhöht sich die einzelne Viewer-Lizenz bei einem Basispreis von $12 um 46%. Eine nicht unrelevante Größe bei der Vergabe neuer Viewer-Lizenzen, womit sich ein jedes Unternehmen mit Wachstumsambitionen auseinandersetzen sollte. Die Gesamtkosten würden nach geschilderter Verteilung der Lizenzen um 24% steigen (Anmerkung: eventuelle Rabatte sind nicht mit einbezogen). Die Tatsache, dass die Zuschläge für alle Lizenzen gelten, kann zumindest kritisch hinterfragt werden.

Ein weiterer, anfangs oft unterschätzter Kostenfaktor ist die Anzahl der Explorer-Lizenzen. Das Verhältnis der Explorer-Lizenzen an der Gesamtanzahl wächst in vielen Fällen mittelfristig nach der Einführungsphase stark an. Häufig wird Tableau als eine neue State of the Art Reporting Lösung mit schönen bunten Bildern betrachtet und dessen eigentliche Stärke, die Generierung von neuen Erkenntnissen mittels Data Discovery, wird unterschätzt. Hier kommt die Explorer Lizenz ins Spiel, welche ca. das Dreifache einer Viewer Lizenz kostet und den User befähigt, tiefer in die Daten einzusteigen.

Nichtdestotrotz kann man behaupten, dass das Lizenzmodell sehr transparent ist. Tableau selbst wirbt damit, dass keine versteckten Kosten auf den Kunden zukommen. Das Lizenzmodell ist aber nicht nur auf die Endkunden ausgerichtet, sondern bietet mit Tableau Server auch ein besonders auf Partner ausgerichtetes Konzept an. Serviceanbieter können so Lizenzen erwerben und in das eigene Angebot zu selbst gewählten Konditionen aufnehmen. Eine Server Instanz reicht aus, da das Produkt auch aus technischer Sicht mit sogenannten Sites auf verschiedene Stakeholder ausgerichtet werden kann.

Community & Features von anderen Entwicklern

Die Bedeutung einer breiten Community soll hier noch einmal hervorgehoben werden. Für Nutzer ist der Austausch über Probleme und Herausforderungen sowie technischer und organisatorischer Art äußerst wichtig, und auch der Softwarehersteller profitiert davon erheblich. Nicht nur, dass der Support teilweise an die eigenen Nutzer abgegeben wird, auch kann der Anbieter bestehende Features zielgerichteter optimieren und neue Features der Nachfrage anpassen. Somit steht die Tableau Community der Power BI Community in nichts nach. Zu den meisten Themen wird man schnell fündig in diversen Foren wie auch auf der Tableau Webseite. Es existiert die klassische Community Plattform, aber auch eine Tableau Besonderheit: Tableau Public. Es handelt sich hierbei um eine kostenlose Möglichkeit eine abgespeckte Version von Tableau zu nutzen und Inhalte auf der gleichnamigen Cloud zu veröffentlichen. Ergänzend sind etliche Lernvideos auf den einschlägigen Seiten fast zu jedem Thema zu finden und komplettieren das Support-Angebot.

Zusätzlich bietet Tableau sogenannte Admin-Tools aus eigenem Hause an, welche als Plug ins eingebunden werden können. Tableau unterscheidet dabei zwischen Community Supported Tools (z.B. TabMon) und Tableau Supported Tools (z.B. Tabcmd).

Ebenfalls bietet Tableau seit der Version 2018.2 dritten Entwicklern eine sogenannte Extensions API an und ermöglicht diesen damit, auf Basis der Tableau-Produkte eigene Produkte zu entwickeln. Erst kürzlich wurde mit Sandboxed Extensions in der Version 2019.4 ein wesentlicher Schritt hin zu einer höheren Datensicherheit gemacht, so dass es zukünftig zwei Gruppen von Erweiterungen geben wird. Die erste und neue Gruppe Sandboxed Extensions beinhaltet alle Erweiterungen, bei denen die Daten das eigene Netzwerk bzw. die Cloud nicht verlassen. Alle übrigen Erweiterungen werden in der zweiten Gruppe Network-Enabled Extensions zusammengefasst. Diese kommunizieren wie gehabt mit der Außenwelt, um den jeweiligen Service bereitzustellen.

Grundsätzlich ist Tableau noch zurückhaltend, wenn es um Erweiterungen des eigenen Produktportfolios geht. Deshalb ist die Liste mit insgesamt 37 Erweiterungen von 19 Anbietern noch recht überschaubar.

Daten laden & transformieren

Bevor der Aufbau der Visualisierungen beginnen kann, müssen die Daten fehlerfrei in Logik und in Homogenität in das Tool geladen werden. Zur Umsetzung dieser Anforderungen bietet sich ein ETL Tool an, und mit der Einführung von Tableau Prep Builder im April 2018 gibt der Softwareentwickler dem Anwender ein entsprechendes Tool an die Hand. Die Umsetzung ist sehr gut gelungen und die Bedienung ist sogar Analysten ohne Kenntnisse von Programmiersprachen möglich. Natürlich verfügen die zur Visualisierung gedachten Tools im Produktsortiment (Tableau Desktop, Server und Online) ebenfalls über (gleiche) Werkzeuge zur Datenmanipulierung. Jedoch verfügt Tableau Prep Builder dank seiner erweiterten Visualisierungen zur Transformation und Zusammenführung von Daten über hervorragende Werkzeuge zur Überprüfung und Analyse der Datengrundlage sowie der eigenen Arbeit.

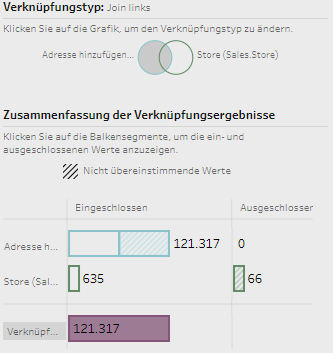
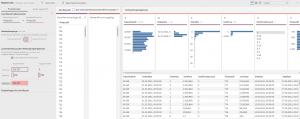
Als Positivbeispiel ist die Visualisierung zu den JOIN-Operationen hervorzuheben, welche dem Anwender auf einen Blick zeigt, wie viele Datensätze vom JOIN betroffen sind und letztendlich auch, wie viele Datensätze in die Output-Tabelle eingeschlossen werden (siehe Grafik).

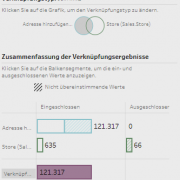
Zur Datenzusammenführung dienen klassische JOIN- und UNION-Befehle und die Logik entspricht den SQL-Befehlen. Das Ziel dabei ist die Generierung einer Extract-Datei und somit einer zweidimensionalen Tabelle für den Bau von Visualisierungen.

Exkurs – Joins in Power BI:

Erst bei der Visualisierung führt Power BI (im Hintergrund) die Daten durch Joins verschiedener Tabellen zusammen, sofern man vorher ein Datenmodell fehlerfrei definiert hat und die Daten nicht bereits mittels Power Query zusammengeführt hat.

Alternativ können auch diverse Datenquellen in das Visualisierungstool geladen und entsprechend des Power BI-Ansatzes Daten zusammengeführt werden. Dieses sogenannte Data Blending rückt seit der Einführung von Tableau Prep Builder immer mehr in den Hintergrund und Tableau führt die User auch hin zu einer weiteren Komponente: Tableau Prep Conductor. Es ist Bestandteil des bereits erwähnten, kostenpflichtigen Tableau Data Management Add-ons und ergänzt die eingeschränkte Möglichkeit, in Tableau Prep Builder automatisierte Aktualisierungen zu planen.

Kalkulationen können, wie auch bei Power BI, teilweise über ein Userinterface (UI) getätigt werden. Jedoch bietet das UI weniger Möglichkeiten, die wirklich komplizierten Berechnungen vorzunehmen, und der User wird schneller mit der von Tableau entwickelten Sprache konfrontiert. Drei Kategorien von Berechnungen werden unterschieden:

  • Einfache Berechnungen
  • Detailgenauigkeits-Ausdrücke (Level of Detail, LOD)
  • Tabellenberechnungen

Es gibt zwei wesentliche Fragestellungen bei der Auswahl der Berechnungsmethode.

1. Was soll berechnet werden? => Detailgenauigkeit?

Diese Frage klingt auf den ersten Blick simpel, kann aber komplexe Ausmaße annehmen. Tableau gibt hierzu aber einen guten Leitfaden für den Start an die Hand.

2. Wann soll berechnet werden?

Die Wahl der Berechnungsmethode hängt auch davon ab, wann welche Berechnung von der Software durchgeführt wird. Die Reihenfolge der Operationen zeigt die folgende Grafik.

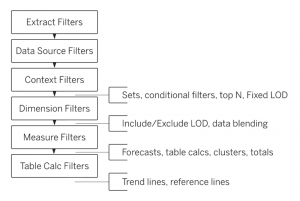
Man braucht einiges an Übung, bis man eine gewisse Selbstsicherheit erlangt hat. Deshalb ist ein strukturiertes Vorgehen für komplexe Vorhaben ratsam.

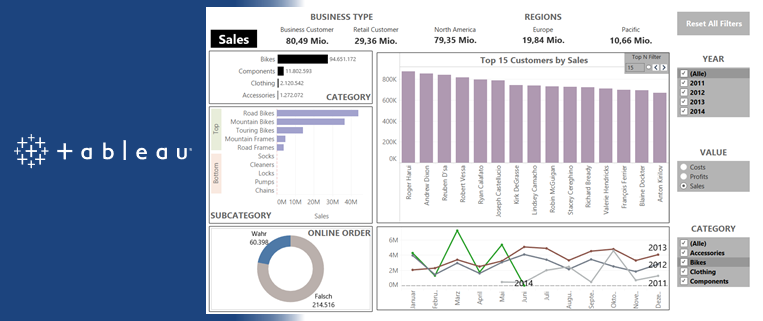
Daten laden & transformieren: AdventureWorks2017Dataset

Wie bereits im ersten Artikel beschrieben, ist es nicht sehr sinnvoll, ein komplettes Datenmodell in ein BI-Tool zu laden, insbesondere wenn man nur wenige Informationen aus diesem benötigt. Ein für diese Zwecke angepasster View in der Datenbasis wäre aus vielerlei Hinsicht näher an einem Best Practice-Vorgehen. Nicht immer hat man die Möglichkeit, Best Practice im Unternehmen zu leben => siehe Artikel 1 der Serie.

Erst durch die Nutzung von Tableau Prep wurde die komplexe Struktur der Daten deutlich. In Power BI fiel bei der Bereitstellung der Tabellen nicht auf, dass die Adressdaten zu den [Store Contact] nicht in der Tabelle [Adress] zu finden sind. Erst durch die Nutzung von Tableau Prep und einer Analyse zu den Joins, zeigte das Fehlen zuvor genannter Adressen für Stores auf. Weiterhin zeigte die Analyse des Joins von Handelswaren und dazugehöriger Lieferanten auch eine m:n Beziehung auf und somit eine Vervielfachung der Datensätze der output Tabelle.

Kurzum: Tableau Prep ist ein empfehlenswertes Tool, um die Datenbasis schnell zu durchdringen und aufwendige Datenbereitstellungen vorzunehmen.

Daten visualisieren

Erwartungsgemäß sind im Vergleich zwischen Tableau und Power BI einige Visualisierungen leichter und andere dagegen schwerer aufzubauen. Grundsätzlich bieten beide Tools einige vorprogrammierte Visualisierungsobjekte an, welche ohne großen Aufwand erstellt werden können. Interessant wird es beim Vergleich der Detailgenauigkeit der Visualisierungen, wobei es nebensächlich ist, ob es sich dabei um ein Balken- oder Liniendiagramm handelt.

Hands on! Dazu lädt Tableau ein, und das ist auch der beste Weg, um sich mit der Software vertraut zu machen. Für einen einfacheren Start sollte man sich mit zwei wesentlichen Konzepten vertraut machen:

Reihenfolge der Operationen

Yep! Wir hatten das Thema bereits. Ein Blick auf die Grafik beim Basteln einzelner Visualisierungen kann helfen! Jeder Creator und Explorer sollte sich vorher mit der Reihenfolge von Operationen vertraut machen. Das Konzept ist nicht selbsterklärend und Fehler fallen nicht sofort auf. Schaut einmal HIER rein! Tableau hat sich eine Stunde Zeit genommen, um das Konzept anhand von Beispielen zu erklären.

Starre Anordnung von Elementen

Visualisierungen werden erst in einem extra Arbeitsblatt entworfen und können mit anderen Arbeitsblättern in einem Dashboard verbaut werden. Die Anordnung der Elemente auf dem Dashboard kann frei erfolgen und/oder Elemente werden in einer Objekthierarchie abgelegt. Letzteres eignet sich gut für den Bau von Vorlagen und ist somit eine Stärke von Tableau. Das Vorgehen dabei ist nicht trivial, das heißt ein saloppes Reinschmeißen von Visualisierungen führt definitiv nicht zum Ziel.
Tim erklärt ziemlich gut, wie man vorgehen kann => HIER.

Tableau ist aus der Designperspektive limitiert, weshalb das Endergebnis, das Dashboard,  nicht selten sehr eckig und kantig aussieht. Einfache visuelle Anpassungen wie abgerundete Kanten von Arbeitsblättern/Containern sind nicht möglich. Designtechnisch hat Tableau daher noch Luft nach oben!

Fazit

Der Einstieg für kleine Unternehmen mit Tableau ist nur unter sehr hohem Kostenaufwand möglich, aufgrund von preisintensiven Lizenzen und einer Mindestabnahme an Lizenzen. Aber auch bei einem hohen Bedarf an Lizenzen befindet sich Tableau im höheren Preissegment. Jedoch beinhalten Tableaus Lizenzgebühren bereits Kosten, welche bei der Konkurrenz erst durch die Nutzung ersichtlich werden, da bei ihnen die Höhe der Kosten stärker von der beanspruchten Kapazität abhängig ist. Tableau bietet seinen Kunden damit eine hohe Transparenz über ein zwar preisintensives, aber sehr ausgereiftes Produktportfolio.

Tableau legt mit einer lokalen Option, welche die gleichen Funktionalitäten beinhaltet wie die cloudbasierte Alternative, ein Augenmerk auf Kunden mit strengen Data Governance-Richtlinien. Sandboxed Extensions sind ein weiteres Beispiel für das Bewusstsein für eine hohe Datensicherheit. Jedoch ist das Angebot an Extensions, also das Angebot dritter Entwickler, ausbaufähig. Eine breit aufgestellte Community bietet nicht nur dritten Entwicklern eine gute Geschäftsgrundlage, sondern auch Nutzern zu fast jedem Thema eine Hilfestellung.

Tableau Prep Builder => TOP!

Mit diesem Tool kann die Datengrundlage super einfach analysiert werden und Datenmanipulationen sind einfach durchzuführen. Die Syntax und die Verwendung von Berechnungen bedarf einiger Übung, aber wenn man die wesentlichen Konzepte verstanden hat, dann sind Berechnungen schnell erstellt.

Ein Dashboard kann zu 90 % in fast jedem Tool gleich aussehen. Der Weg dorthin ist oft ein anderer und je nach Anforderung bei einem Tool leichter als bei einem anderen. Tableau bietet ein komplexes Konzept, sodass auch die außergewöhnlichsten Anforderungen erfüllt werden können. Jedoch ist das zugrundliegende Design oft sehr kantig und nicht immer zeitgemäß.

Fortsetzung folgt… MicroStrategy

How Finance Organizations Are Dealing with The Growing Demand for Instant Response Times

The financial industry is one of the most innovative industries that has evolved at an incredibly fast-paced over the past decade. Finance is a complex industry that requires a delicate balance between optimal convenience and security. 

With security being the most important aspect, the role of AI has increased in importance and various financial organizations are taking strides to innovate unique solutions to meet the growing demand for faster and instant response rates. 

In a recent study, it was found that automation and digital intelligence save US banks over $1trillion on an annual basis. From a world perspective, more countries in different parts of the world are adopting AI tools to meet the growing demand for instant response time.

The client experience

Despite the fast rate of digital integration into various industries, clients still want to feel a personal connection to a brand experience. The advances in machine learning have allowed for a vast improvement in personalized services using customer data. This feature uses AI tools to better understand and respond to client needs. 

A feature of this nature allows financial organizations to develop improved products and increase speeds in response rates. The client not only experiences faster service but also gains access to products that are relevant to their needs and interested.

The improved customer experience has also improved by eliminating the need to go to the physical office of a financial institution to solve a problem. The incorporation of chatbots for customer service allows clients to easily solve queries remotely. 

A recent example is the Bank of America’s chatbot, known as Erica, who is accessible at all times of the day is currently used by a million people. This eliminates having to deal with human assistants meaning that it is easier to access solutions. Customer service is on the areas that allow financial institutions to thrive and the client is increasingly demanding optimal customer service. 

Improved security and fraud prevention 

More financial organizations are making use of biometric data to record customer data. Some financial institutions have decided to replace passwords, thus simplifying client verification. Despite the simplicity, it offers a higher level of security beyond a simple pin code. 

In the future, clients are anticipated to simply use their biometrics to access their funds at an ATM or the bank. Another aspect of improving response times to limit cybercrime and prevent fraud by easily identifying client patterns. The knowledge of client patterns allows clients to be contacted in the event of unusual activities. 

Disruption from startup innovation

The term disruption has transformed into a positive term in the past decade because disruptors have created technology that speeds up and streamlines payments, product maintenance for clients and increasing the value chain. 

Financial institutions are finding ways to work collaboratively with disruptors and innovative FinTech companies to create improved technology-driven solutions. The culture of disruption has allowed financial institutions to deliver more innovative money management solutions and simple avenues to process transactions with minimal delays. 

Disruptors generally evolve at a rapid pace and are also becoming institutions that are becoming standalone financial service providers. The expanded competition only creates room for a wide range of institutions to choose from dedicated to solving client problems. 

Using robotics to eliminate the risk

The growing alliance between financial services and technology companies focused on AI allows the financial industry to have a better understanding of consumer patterns to develop products relevant to them. 

The joy of incorporating AI tools means that the client does not have to resort to interacting with a bank teller to solve an issue. The integration of AI tools is a good way to ensure that tasks are performed with minimal human error and eliminate hurdles that arise due to inaccuracies. 

NLP AI Technology has also worked towards assisting financial institutions make informed decisions by developing different useful apps. For example, there are apps that use NLP to gather data on influencers, marketers and blog posts, that data is then used to advise financiers on how to invest. There is also other software that helps digitize financial documentation processes using NLP and that is just a few examples amongst quite a few.

Taking advantage of the sharing economy 

A recent innovation in finance has been the recognition of the power of a shared economy which has been realized in industries such as transport and hospitality. The client is always looking for fast means to meet their needs and the cheapest possible options. 

The rise of digital currencies and the decentralized model have shown banks that people respond to a system that allows for decentralized asset sharing. 

With the rise of cryptocurrency, financial institutions have also started exploring the potential of employing blockchain to create a system that presents a public ledger and improve internal operation within an organization to deliver at high speed. 

Moving infrastructure to the cloud

Financial institutions are growing more and more to use the cloud to manage their operations and this allows for easier management. Financial institutions realize the importance of automating processes such as data management, CRM, accounting and even HR. 

Using analytical tools allows for the fast-tracking of data gathering and delivering solutions to clients. This allows functions like client payment, statement generation, credit checks and more to become automated and more accurate. 

Once again, the issue of cybersecurity is forefronted in machines ‘taking over’ and the concern stems from the fact that the software is being sourced from third parties and requirements in the industry are highly sophisticated. 

The rapid growth of data-driven solutions has placed pressure on financial institutions to work with trustworthy service providers or develop inhouse data management systems to avoid third-party interactions. 

Conclusion

The language of convenience is one that is universal; everyone wants everything to work faster, be delivered to their doorstep and accommodate their needs. The financial industry is no exception to these expectations from customers. Finance organizations are taking the leap into incorporating AI tools to partly manage operations because it simplifies monitoring, reporting and processing large volumes of data. 

The sophistication of analytical tools ensures that issues are resolved before they become larger issues that are beyond an organization’s control. It is certainly exciting to see how financial industries and organizations will transform in 2020 to incorporate tech tools to streamline security and operations. 

Stop processing the same mistakes! Four steps to business & IT alignment

Digitization. Agility. Tech-driven. Just three strategy buzzwords that promise IT transformation and business alignment, but often fade out into merely superficial change. In fact, aligning business and IT still vexes many organizations because company leaders often forget that transformation is not a move from A to B, or even from A to Z––it’s a move from a fixed starting point, to a state of continual change.


Read this article in German:

Mit den richtigen Prozessen zum Erfolg: vier Schritte zum Business-IT Alignment


Within this state of perpetual flux, adaptive technology is necessary, not only to keep up with industry developments but also with the expansion of technology-enabled customer experiences. After all, alignment assumes that business and technology are separate entities, when in fact they are inextricably linked!

Metrics that matter: From information technology to business technology

Information technology is continuing to challenge the way companies organize their business processes, communicate with customers and potential customers, and deliver services. Although there is no single dominant reorganization strategy, common company structures lean towards decentralizing IT, shifting it closer to end-users and melding the knowledge-base with business strategy. Business-IT alignment is more than ever vital for market impact and growth.

This tactic means as business goals pivot, IT can more readily respond with permanent solutions to support and maintain enterprise momentum. In turn, technological advances and improvements are hardwired into current and future strategies and initiatives. As working ecosystems replace strict organizational structures, the traditional question “Which department do you work in?” has been replaced by, “How do you work?”

But how does IT prove its value and win the trust of the C-suite? Well, according to Gartner, almost 20% of companies have already invested in tools capable of monitoring business-relevant metrics, with this number predicted to reach 60% by 2021. The problem is many infrastructure and operations (I&O) leaders don’t know where to begin when initiating an IT monitoring strategy.

Reach beyond the everyday: Four challenges to alignment

With this, CIOs are under mounting pressure to address digital needs that grow and transform, as well as to renovate the operational environment with new functions. They also must still demonstrate how IT is meeting a given business strategy. So looking forward, no matter how big or small your business is, technology can deliver tangible and intangible benefits (like speed and performance) to hit revenue and operational targets efficiently, and meet your customers’ expectations of innovation.

Put simply, having a good technological infrastructure enriches the culture, efficiency, and relationships of your business.

Business and IT alignment: The rate of change

This continuous strategic loop means enterprises function better, make more profit, and see better ROI because they achieve their goals with less effort. And while there may be no standard way to align successfully, an organization where IT and business strategy are in lock-step can further improve agility and operational efficiencies. This battle of the ‘effs’, efficiency vs. effectiveness, has never been so critical to business survival.

In fact, successful companies are those that dive deeper; such is the importance of this synergy. Amazon and Apple are prime examples—technology and technological innovation is embedded and aligned within their operational structure. In several cases, they created the integral technology and business strategies themselves!

Convergence and Integration

These types of aligned companies have also increased the efficiency of technology investments and significantly reduced the financial and operational risks associated with business and technical change.

However, if this rate of change and business agility is as fast as we continually say, we need to be talking about convergence and integration, not just alignment. In other words, let’s do the research and learn, but empower next-level thinking so we can focus on the co-creation of “true value” and respond quickly to customers and users.

Granular strategies

Without this granular strategy, companies may spend too much on technology without ever solving the business challenges they face, simply due to differing departmental objectives, cultures, and incentives. Simply put, business-IT alignment integrates technology with the strategy, mission, and goals of an organization. For example:

  • Faster time-to-market
  • Increased profitability
  • Better customer experience
  • Improved collaboration
  • Greater industry and IT agility
  • Strategic technological transformation

Hot topic

View webinar recording Empowering Collaboration Between Business and IT, with Fabio Gammerino, Signavio Pre-Sales Consultant.

The power of process: Four steps to better business-IT alignment

While it may seem intuitive, many organizations struggle to achieve the elusive goal of business-IT alignment. This is not only because alignment is a cumbersome and lengthy process, but because the overall process is made up of many smaller sub-processes. Each of these sub-processes lacks a definitive start and endpoint. Instead, each one comprises some “learn and do” cycles that incrementally advance the overall goal.

These cycles aren’t simple fixes, and this explains why issues still exist in the modern digital world. But by establishing a common language, building internal business relationships, ensuring transparency, and developing precise corporate plans of action, the bridge between the two stabilizes.

Four steps to best position your business-IT alignment strategy:

  1. Plan: Translate business objectives into measurable IT services, so resources are effectively allocated to maximize turnover and ROI – This step requires ongoing communication between business and IT leaders.
  2. Model: IT designs infrastructure to increase business value and optimize operations – IT must understand business needs and ensure that they are implementing systems critical to business services.
  3. Manage: Service is delivered based on company objectives and expectations – IT must act as a single point-of-service request, and prioritize those requests based on pre-defined priorities.
  4. Measure: Improvement of cross-organization visibility and service level commitments – While metrics are essential, it is crucial that IT ensures a business context to what they are measuring, and keeps a clear relationship between the measured parameter and business goals.

Signavio Says

Temporarily rotating IT employees within business operations is a top strategy in reaching business-IT alignment because it circulates company knowledge. This cross-pollination encourages better relationships between the IT department and other silos and broadens skill-sets, especially for entry-level employees. Better knowledge depth gives the organization more flexibility with well-rounded employees who can fill various roles as demand arises.

Get in touch

Discover how Signavio can lead your business to IT transformation and operational excellence with the  Signavio Business Transformation Suite. Try it for yourself by registering now for a free 30-day trial.

Wie künstliche Intelligenz hilft, Krankheiten zu bekämpfen

Die Herausforderungen im Gesundheitswesen sind gewaltig. Die Kosten steigen, das Geld ist knapp und die Margen sinken. Gleichzeitig fehlt es an Pflegepersonal, die vorhandenen Fachkräfte sind überarbeitet. Kliniken müssen effizient wirtschaften, um Patienten die bestmögliche Versorgung zu gewährleisten – und gleichzeitig Datensicherheits- und Compliance-Anforderungen bei der Verarbeitung der anfallenden Daten sicherstellen.

Der Einsatz von künstlicher Intelligenz (KI) kann dabei helfen, dieses Dilemma zu lösen. Algorithmen werden immer besser in dem, was sie tun – und sie arbeiten exakt, schnell und günstig. KI unterstützt in der Medizin und Forschung dabei, Patienten besser zu versorgen, indem beispielsweise Krankheiten früher erkannt werden können. Mit ihrer Hilfe könnten unter anderem die Gesundheitsausgaben in Europa in den kommenden zehn Jahren um einen dreistelligen Milliardenbetrag gesenkt werden, so das Ergebnis der PwC-Studie „Sherlock in Health – How artificial intelligence may improve quality and efficiency, whilst reducing healthcare costs in Europe“. Des Weiteren haben die meisten Patienten keine Berührungsängste: 54 Prozent wären demnach schon heute bereit, sich auf KI und Robotik in der Medizin einzulassen.

KI, ML und DL als medizinische Unterstützung

Algorithmen können in der Medizin auf unterschiedliche Weisen genutzt werden. KI beschäftigt sich mit Methoden, bei denen Computertechnologien es ermöglichen, menschliches Verhalten zu imitieren. Im Rahmen der medizinischen Bildgebung kann KI beispielsweise schnell Anomalien identifizieren, die für das menschliche Auge zu winzig erscheinen – oder große Datenmengen durchforsten. Ein Computertomograph erzeugt bis zu 640 Schnittbilder bei einem einzigen Scan. Wenn ein Radiologe sie ansehen und bewerten müsste, wäre das mit einem sehr hohen Zeitaufwand verbunden. Eine spezielle KI-Applikation kann die Bilder dagegen schnell analysieren und diejenigen markieren, welche Anomalien aufweisen. Die Radiologen können sich damit auf ihre Hauptaufgaben konzentrieren – Diagnose und Heilung. 

Ein weiteres Anwendungsgebiet von künstlicher Intelligenz innerhalb der Medizin ist der Einsatz von Intelligent Agents (IA), zum Beispiel für die Überwachung von Vitalwerten von Patienten oder als Kontrollmechanismus für die Arbeit des Pflegepersonals, der Ärzte oder Apotheker. Die Anwendungen überprüfen dann automatisch, ob die verschriebenen Medikamente und Therapien zum Krankheitsbild und zu den Werten des Patienten passen. 

Anwendungen aus dem Teilbereich der KI „Maschinelles Lernen (ML)“ lernen eigenständig dazu, je mehr Daten erfasst werden. Chirurgen können ML beispielsweise als Unterstützung verwenden, um den richtigen orthopädischen Eingriff nach einer Sportverletzung vorzubereiten. Die Technologie analysiert Patientendaten und kann die Unterschiede bei Knieverletzungen unterschiedlicher Sportarten sichtbar machen. So stehen dem Arzt detaillierte Informationen zur Verfügung, auf deren Basis er die Behandlung fortsetzt.

Deep Learning (DL) wiederum gilt als Teilbereich von ML und geht noch einen Schritt weiter, indem die Algorithmen nicht nur in der Lage sind, selbständig dazuzulernen, sondern sich auch kontinuierlich zu verbessern. So werden große Datenmengen verarbeitet, aus denen Wissenschaftler mögliche neue Erkenntnisse für Behandlungserfolge gewinnen können. Mit Hilfe von DL lassen sich beispielsweise bisher unbekannte Verbindungen zwischen bestimmten demografischen oder genetischen Indikatoren und unterschiedlichen Krankheiten aufdecken. Ebenso gibt es DL-Algorithmen, die mithilfe großer Datenmengen so trainiert werden, dass sie kleinste Veränderungen in der Zellstruktur erkennen können, die beispielsweise zu Brustkrebs führen. Die Fehlerquote bei der Brustkrebserkennung kann damit um bis zu 85 Prozent sinken, so eine Untersuchung von NVIDIA.

Komplexe KI-Projekte benötigen eine passende IT-Infrastruktur

Damit KI, ML und DL im Gesundheitswesen effektiv eingesetzt werden können, gibt es einige Grundvoraussetzungen. Zunächst einmal sind große Datenbestände notwendig. Diese werden genutzt, um die Algorithmen zu trainieren, damit sie akkurat und autonom arbeiten sowie Muster erkennen und genaue Vorhersagen treffen können. Dabei gilt es so viele Daten wie möglich zu berücksichtigen, unabhängig ob sie über verschiedene Systeme verteilt sind, aus unterschiedlichen Quellen stammen oder von mehreren unterschiedlichen Sensoren gesammelt wurden. Jedoch sollten sie eine hohe Datenqualität aufweisen. Darüber hinaus kann es sich um verschiedene Typen von Daten handeln (strukturiert, semi-strukturiert, unstrukturiert), die sich dynamisch entwickeln und verändern. 

Damit Daten überall dort verfügbar sind, wo sie gebraucht werden, gilt es Datensilos aufzulösen und miteinander zu verknüpfen. KI-Projekte stellen somit hohe Anforderungen an die IT-Infrastruktur hinsichtlich Datenverfügbarkeit und Datenqualität, Skalierbarkeit, Informationssicherheit sowie Genauigkeit mit hohen Ansprüchen an die Performance. Eine solch komplexe KI-Umgebung selbst zu planen, zu implementieren und zu unterhalten stellt viele Unternehmen vor große Herausforderungen. Es gibt jedoch schon umfassende Lösungen am Markt. Beispielsweise bietet NetApp zusammen mit NVIDIA und Cisco eine Lösung für die genannten Herausforderungen: ONTAP AI. Diese Architektur vereinfacht das komplette Datenmanagement: Informationen werden über das System sicher erfasst, weitergeleitet und verarbeitet, zum Training verwendet und analysiert.

ONTAP AI basiert auf einer verifizierten Architektur, die NVIDIA DGX-1 GPU‘s mit NetApp All Flash FAS Storage und Cisco Netzwerken zusammenführt und die Effizienz Ihrer KI-/DL-Umgebungen steigert. Herzstück von ONTAP AI ist die NVIDIA DGX-1, ein vollständig integriertes und sofort einsatzbereites Hardware- und Softwaresystem, das speziell für DL entwickelt wurde. Die DGX Plattform nutzt den Deep-Learning-Software-Stack der NVIDIA GPU Cloud, der für maximale GPU-beschleunigte DL-Performance optimiert wurde. Mit dem schnellen All-Flash-Storage und den weltweit ersten End-to-End NVMe-Technologien sorgen NetApp All Flash FAS Systeme für einen kontinuierlichen Datenfluss. So wird sichergestellt, dass die DGX-GPUs optimal mit Daten zur Verarbeitung versorgt werden und somit ein Flaschenhals hinsichtlich Datenbereitstellung durch die Storage-Systeme vermieden wird. 

Schnelle Diagnose

ONTAP AI kommt beispielsweise bei „BacillAi“ zum Einsatz, einem System zur Behandlung von Tuberkulose der Technologieberatungsfirma Cambridge Consultants. Tuberkulose ist die zweithäufigste Todesursache in Entwicklungsländern, da die Krankheit mit einer aufwendigen Diagnose verbunden ist: Zellen einer Speichelprobe müssen unter dem Mikroskop gezählt werden. Doch dafür gibt es nur wenig ausgebildetes medizinisches Personal. BacillAi vereinfacht diesen Schritt – und liefert zudem genauere und schnellere Ergebnisse. Ein Smartphone nimmt die Bilder der Speichelprobe von einem Standardmikroskop auf. Der DL-Algorithmus identifiziert Tuberkulose-Zellen, zählt sie und bestimmt das Stadium der Krankheit. Die Diagnose erhält der medizinische Mitarbeiter über eine App – somit ist das Ergebnis der Untersuchung zudem digitalisiert.

Fazit 

Künstliche Intelligenz kann das Gesundheitswesen revolutionieren. Unternehmen müssen dafür große Datenmengen aus unterschiedlichen Quellen erfassen, vorbereiten, verschieben, auf sie zugreifen und sie schützen. Damit KI, ML und DL-Projekte erfolgreich sind, brauchen Unternehmen aber eine effiziente Daten-Pipeline und eine Architektur, die eine hohe Performance, Sicherheit und Skalierbarkeit ermöglicht.

Weiter Informationen zum Thema finden Sie HIER.

NetApp INSIGHT™ 2020

Erleben Sie mit uns gemeinsam die NetApp INSIGHT™ 2020 am 24. und 25. März 2020 in Berlin! Wir zeigen Ihnen, wie Sie mit Ihrer eigenen Data Fabric Ihre hybride Multi-Cloud-Umgebung aufbauen können. Und das Beste? Sie hören nicht nur unsere Experten über die Data Fabric sprechen – Sie lernen, wie Sie Ihre eigene Data Fabric aufbauen können.

Verändern Sie Ihre Welt mit Daten.

Erfahren Sie gemeinsam mit anderen NetApp Kunden und Partnern, wie Sie mit Hilfe von Daten Innovation vorantreiben und so den Einsatz von KI und Ihre Applikationsentwicklung beschleunigen können. Tauschen Sie sich mit Gleichgesinnten aus und entdecken Sie neue Möglichkeiten, wie alle Unternehmensbereiche von der Leistungsfähigkeit der Cloud profitieren können. Lernen Sie NetApp Technologie in der Praxis kennen. Gewinnen Sie in interaktiven Breakout-Sessions tiefgehende Einblicke. Und auch der Spaß kommt dabei nicht zu kurz. 

Jetzt kostenlos registrieren


Die Tickets für unsere regionalen INSIGHT Veranstaltungen in EMEA sind in diesem Jahr kostenfrei. Wir bitten Sie jedoch, Ihre Anreise und Unterkunft individuell zu organisieren. Weitere Informationen finden Sie unter insight.netapp.com.

Herzliche Grüße,

Ihr NetApp INSIGHT Berlin Team

Scaling Up Your Process Management

Any new business faces questions: have we found the right product/market fit? Does the business model work? Have we got enough money to keep the doors open? Typically, new businesses are focused on staying afloat, meaning anything that isn’t immediately relevant to that goal is left until later—whenever that might be!   


Read this article in German:

Machen Sie mehr aus Ihrem Prozessmanagement


However, most businesses soon realize that staying afloat means finding the most efficient way to deliver their products or services to customers. As a result, the way a business functions starts to move into focus, with managers and staff looking to achieve the same outcome, in the same way, over and over. The quickest route to this? Establishing efficient processes. 

Once a business has clarified the responsibilities of all staff, and identified their business process framework, they are better able to minimize waste and errors, avoid misunderstandings, reduce the number of questions asked during the day-to-day business, and generally operate more smoothly and at a greater pace.

Expanding your business with process management

Of course, no new business wants to remain new for long—becoming firmly established is the immediate goal, with a focus on expansion to follow, leading to new markets, new customers, and increased profitability. Effectively outlining processes takes on even more importance when companies seek to expand. Take recruitment and onboarding, for example. 

Ad hoc employment processes may work for a start-up, but a small business looking to take the next step needs to introduce new staff members frequently and ensure they have the right information to get started immediately. The solution is a documented, scalable, and repeatable process that can be carried out as many times as needed, no matter the location or the role being filled. 

When new staff are employed, they’ll need to know how their new workplace actually functions. Once again, a clear process framework means all the daily processes needed are accessible to all staff, no matter where the employee is based. As the business grows, more and more people will come on board, each with their own skills, and very likely their own ideas and suggestions about how the business could be improved… 

Collaborative process management

Capturing the wisdom of the crowd is also a crucial factor in a successful business—ensuring all employees have a chance to contribute to improving the way the company operates. In a business with an effective process modeling framework, this means providing all staff with the capability to design and model processes themselves. 

Traditionally, business process modeling is a task for the management or particular experts, but this is an increasingly outdated view. Nobody wants to pass up the valuable knowledge of individuals; after all, the more knowledge there is available about a process, the more efficiently the processes can be modeled and optimized. Using a single source of process truth for the entire organization means companies can promote collaborative and transparent working environments, leading to happier staff, more efficient work, and better overall outcomes for the business. 

Collaborative process management helps to grow organizations avoid cumbersome, time-consuming email chains, or sifting through folders for the latest version of documents, as well as any number of other hand brakes on growth. 

Instead, process content can be created and shared by anyone, any time, helping drive a company’s digital and cloud strategies, enhance investigations and process optimization efforts, and support next-gen business transformation initiatives. In short, this radical transparency can serve as the jumping-off point for the next stage of a company’s growth. 

Want to find out more about professional process management? Read our White Paper 7-Step Guide to Effective Business Transformation!

Machen Sie mehr aus Ihrem Prozessmanagement

Jedes neue Unternehmen steht vor den Fragen: Haben wir das richtige Produkt/den richtigen Marktansatz?  Funktioniert das Geschäftsmodell? Haben wir genug Liquidität? In der Regel konzentrieren sich neu gegründete Unternehmen auf das Überleben und verschieben alles, was für dieses Ziel zunächst nicht unmittelbar relevant ist, auf einen späteren Zeitpunkt.  


Read this article in English:

Scaling up your Process Management 


Die meisten Unternehmen stellen jedoch schnell fest, dass ihr Überleben vor allem davon abhängt, ob sie ihren Kunden innovative Produkte und effiziente Dienstleistungen anbieten können. Infolgedessen rückt die Arbeitsweise des Unternehmens in den Fokus, denn Manager und Mitarbeiter möchten auf effiziente Weise gute Ergebnisse erzielen. Der schnellste Weg zum Ziel: Effiziente Prozesse. 

Das Festlegen von Rollen und Verantwortlichkeiten führt dazu, dass Arbeitsabläufe im Unternehmen optimiert werden und Mitarbeiter ihre Aufgaben reibungsloser und schneller erledigen können.

Unternehmenswachstum mit Prozessmanagement

Jedes Unternehmen will sich schnell am Markt etablieren, das eigene Wachstum vorantreiben und neue Kunden gewinnen. Auch mit diesem Ziel vor Augen ist es nicht immer leicht, effiziente Prozesse zu gestalten. Nehmen Sie zum Beispiel die Rekrutierung und das Onboarding neuer Mitarbeiter. 

Einstellungsprozesse auf Ad-hoc-Basis können für ein Start-up funktionieren, nicht aber unbedingt für ein wachstumsorientiertes, mittelständisches Unternehmen. Hier müssen immer mehr Mitarbeiter in kürzerer Zeit eingearbeitet werden. Abteilungsleiter müssen sicherstellen, dass sie über die richtigen Informationen für ihre Arbeit verfügen. Die Lösung ist ein dokumentierter, skalierbarer und wiederholbarer Prozess, der unabhängig vom Standort oder der zu besetzenden Funktion beliebig oft ausgeführt werden kann. 

Wenn neue Mitarbeiter eingestellt werden, müssen sie wissen, wie sie ihre Aufgaben künftig erledigen müssen. Auch hier führt ein klar definierter Prozess dazu, dass die notwendigen Abläufe, Rollen und Dokumente bekannt und zugänglich sind – und das alles über Standortgrenzen hinweg. Unternehmenswachstum bedeutet auch, dass sich immer mehr Personen mit ihren Fähigkeiten und Ideen einbringen.


Kollaboratives Prozessmanagement

Führungskräfte sollten auf das kollektive Know-how ihrer Mitarbeiter setzen und ihnen die Möglichkeit zu geben, zur Verbesserung der Arbeitsweise des Unternehmens beizutragen. In einem Unternehmen mit einem effektiven Rahmen zur Prozessmodellierung bedeutet dies, dass alle Mitarbeiter Prozesse selbst entwerfen und modellieren können. 

Dass die Modellierung von Geschäftsprozessen in den Aufgabenbereich des Managements oder bestimmter Experten gehört, –ist eine überholte Sichtweise. Niemand möchte auf das wertvolle Wissen des Einzelnen verzichten: Denn je mehr Erkenntnisse über einen Prozess vorliegen, desto effizienter lassen sich die Prozesse modellieren und optimieren. Unternehmen, die auf die Nutzung einer gemeinsamen Informationsquelle für ihre Prozesse setzen, können eine kollaborative und transparente Arbeitsumgebung aufbauen. Dies führt nicht nur zu zufriedenen Mitarbeitern, sondern auch zu effizienteren Arbeitsabläufen und besseren Unternehmensergebnissen. 

Das kollaborative Prozessmanagement hilft wachsenden Unternehmen dabei, ineffiziente Abläufe, wie zeitaufwändigen E-Mail-Verkehr oder das Suchen nach der neuesten Dokumentenversion und andere Wachstumsbremsen zu vermeiden. 

Stattdessen können Prozessinhalte jederzeit von allen Mitarbeitern erstellt und freigegeben werden. Auf diese Weise werden die digitalen und cloudbasierten Strategien eines Unternehmens vorangetrieben, Analysen verbessert, Prozesse optimiert und Business-Transformation-Initiativen unterstützt. Kurz gesagt: Eine derartige Prozesstransparenz kann als Basis für die nächste Wachstumsphase eines Unternehmens genutzt werden. 

Sie möchten gern weitere Informationen über eine erfolgreiche Unternehmenstransformation erhalten? Gern stellen wir Ihnen unser Whitepaper In 7 Schritten zur Unternehmenstransformation kostenlos zur Verfügung.

Process Paradise by the Dashboard Light

The right questions drive business success. Questions like, “How can I make sure my product is the best of its kind?” “How can I get the edge over my competitors?” and “How can I keep growing my organization?” Modern businesses take their questions further, focusing on the details of how they actually function. At this level, the questions become, “How can I make my business as efficient as possible?” “How can I improve the way my company does business?” and even, “Why aren’t my company’s processes working as they should?”


Read this article in German:

Mit Dashboards zur Prozessoptimierung


To discover the answers to these questions (and many others!), more and more businesses are turning to process mining. Process mining helps organizations unlock hidden value by automatically collecting information on process models from across the different IT systems operating within a business. This allows for continuous monitoring of an organization’s end-to-end process landscape, meaning managers and staff gain specific operational insights into potential risks—as well as ongoing improvement opportunities.

However, process mining is not a silver bullet that turns data into insights at the push of a button. Process mining software is simply a tool that produces information, which then must be analyzed and acted upon by real people. For this to happen, the information produced must be available to decision-makers in an understandable format.

For most process mining tools, the emphasis remains on the sophistication of analysis capabilities, with the resulting data needing to be interpreted by a select group of experts or specialists within an organization. This necessarily creates a delay between the data being produced, the analysis completed, and actions taken in response.

Process mining software that supports a more collaborative approach by reducing the need for specific expertise can help bridge this gap. Only if hypotheses, analysis, and discoveries are shared, discussed, and agreed upon with a wide range of people can really meaningful insights be generated.

Of course, process mining software is currently capable of generating standardized reports and readouts, but in a business environment where the pace of change is constantly increasing, this may not be sufficient for very much longer. For truly effective process mining, the secret to success will be anticipating challenges and opportunities, then dealing with them as they arise in real time.

Dashboards of the future

To think about how process mining could improve, let’s consider an analog example. Technology evolves to make things easier—think of the difference between keeping track of expenditure using a written ledger vs. an electronic spreadsheet. Now imagine the spreadsheet could tell you exactly when you needed to read it, and where to start, as well as alerting you to errors and omissions before you were even aware you’d made them.

Advances in process mining make this sort of enhanced assistance possible for businesses seeking to improve the way they work. With the right process mining software, companies can build tailored operational cockpits that unite real-time operational data with process management. This allows for the usual continuous monitoring of individual processes and outcomes, but it also offers even clearer insights into an organization’s overall process health.

Combining process mining with an organization’s existing process models in the right way turns these models from static representations of the way a particular process operates, into dynamic dashboards that inform, guide and warn managers and staff about problems in real time. And remember, dynamic doesn’t have to mean distracting—the right process mining software cuts into your processes to reveal an all-new analytical layer of process transparency, making things easier to understand, not harder.

As a result, business transformation initiatives and other improvement plans and can be adapted and restructured on the go, while decision-makers can create automated messages to immediately be advised of problems and guided to where the issues are occurring, allowing corrective action to be completed faster than ever. This rapid evaluation and response across any process inefficiencies will help organizations save time and money by improving wasted cycle times, locating bottlenecks, and uncovering non-compliance across their entire process landscape.

Dynamic dashboards with Signavio

To see for yourself how the most modern and advanced process mining software can help you reveal actionable insights into the way your business works, give Signavio Process Intelligence a try. With Signavio’s Live Insights, all your process information can be visualized in one place, represented through a traffic light system. Simply decide which processes and which activities within them you want to monitor or understand, place the indicators, choose the thresholds, and let Signavio Process Intelligence connect your process models to the data.

Banish multiple tabs and confusing layouts, amaze your colleagues and managers with fact-based insights to support your business transformation, and reduce the time it takes to deliver value from your process management initiatives. To find out more about Signavio Process Intelligence, or sign up for a free 30-day trial, visit www.signavio.com/try.

Process mining is a powerful analysis tool, giving you the visibility, quantifiable numbers, and information you need to improve your business processes. Would you like to read more? With this guide to managing successful process mining initiatives, you will learn that how to get started, how to get the right people on board, and the right project approach.