Data Science Security Hacks

It would blow your mind if you had exposure to all the information available on the internet. The science behind it is very demanding. It could explain why there is such an explosion of intelligent systems. People come in with different skill sets, including math, data analysis, statistics, and programming, to name a few.

They all use very orthodox methods in their approach to data science. But, we have people with hacker mindsets who think out of the box. You will find them using security hacks to circumvent the scientific approach to data science. Our article will explore some of the methods they use, and why you may need an SSL certificate.

Understanding Data Science

Data science is the use of different tools, machine learning principles and algorithms to shift through raw data to discover any hidden patterns. The scientist will use the information to make predictions and decisions through the use of prescriptive analytics, machine learning, and predictive analytics. They collect data from multiple sources and organize it before translating it into results.

The scientists come to their conclusions by looking at a problem from all viewpoints and asking the right questions. Many companies are using these services to make sound business decisions. You will find the use of data science in areas such as risk and fraud detection, healthcare, advertising, and even gaming.

Data Science Security Hacks

  • Data Protection 

Data is everything to a data scientist. However, they are always at threat of losing it due to a rise in cybersecurity threats. Online hackers are getting more daring and sophisticated and are continually coming up with new ways to access people’s information. It is, therefore, critical to protecting one’s privacy and security while on the internet.

Phishing attacks and malware are genuine threats to the digital space. SSL certificates provide data security because it protects the user from unwanted third party tampering. You can find many types of SSL certificates like single domain, Code Signing certificate, multi-domain SSL, etc.

  • Having the Mindset of a Hacker

A typical scientific mindset is to build models, train, plot graphs, and analyze the different attributes to come up with a solution. The mindset of a hacker is very different from that of a scientist. They focus more on finding Solutions using simple methods.

While the data scientists use so many various components to a problem, the hacker works at eliminating complexity to come up with a solution. The hacker mindset is, therefore, freer, because the confines of the scientific mind do not bound them.

  • Data Cleaning Techniques

There are tons of raw data that data scientists have to work with. Once they collect it, it has to go through the process of cleaning. It is a very complex process because scientists will be working with unstructured data. It is, however, a critical component of data science because scientists will have to extract what they need.

They are then able to process the data and structure it into usable data that will yield the required outcome. One of the ways of achieving the best results might be to use the most straightforward models available. The sophisticated tools do not always give the desired results. Even if they do, they may make the process more tedious and time-consuming than necessary.

  • The Learning Never Ends

In the field of data science, look at it more like a journey, and not a process to get to a destination. They must, therefore, always learn because the domain is vast, and there is new information coming in every day. It is in the process of learning that they can come up with more intelligent models for use within the field. They keep abreast of the latest innovations and technologies, which they can use in their daily problem-solving processes.

The online platform has so much information for anyone interested in developing their skill sets. You do not need to go to a classroom to stay up-to-date with what is happening. You can get information online. The data scientists also share their knowledge in different forums or platforms, thereby providing invaluable resources to fellow practitioners.

  • Knowledge of Domains

One of the critical steps data scientists take is to understand precisely what it is they are working with. If, for example, they are working in the agricultural field, they have to follow the industry to understand any data they collect. It would be unreasonable to expect the scientist to give useful insights and analysis without understanding the industry.

Domain knowledge is, therefore, a critical element of data science. With proper understanding, we can expect a better output from the scientists. Those in the industry can then apply the findings within their relevant areas for better productivity.

  • Cheat Sheets Hacks

Data Science is not a simple field, and you get to learn so much every day. Unless you have one of those super memories, it will be hard to remember everything. That is why data scientists have cheat sheets. There are many such cheat sheets online for anyone who needs one.

Final Thoughts

Data science continues to gain relevance in different fields, and it will continue to grow due to the demand from various industries. It is already very critical in areas such as health care, fraud detection, and agriculture, to name a few. The most vital data security hack for a data scientist is the Installation of an SSL certificate. It will protect from hackers while on the internet. It would be a pity to lose all the data to cybercriminals because of a hack that is simple to install and inexpensive.

Simple RNN

Prerequisites for understanding RNN at a more mathematical level

Writing the A gentle introduction to the tiresome part of understanding RNN Article Series on recurrent neural network (RNN) is nothing like a creative or ingenious idea. It is quite an ordinary topic. But still I am going to write my own new article on this ordinary topic because I have been frustrated by lack of sufficient explanations on RNN for slow learners like me.

I think many of readers of articles on this website at least know that RNN is a type of neural network used for AI tasks, such as time series prediction, machine translation, and voice recognition. But if you do not understand how RNNs work, especially during its back propagation, this blog series is for you.

After reading this articles series, I think you will be able to understand RNN in more mathematical and abstract ways. But in case some of the readers are allergic or intolerant to mathematics, I tried to use as little mathematics as possible.

Ideal prerequisite knowledge:

  • Some understanding on densely connected layers (or fully connected layers, multilayer perception) and how their forward/back propagation work.
  •  Some understanding on structure of Convolutional Neural Network.

*In this article “Densely Connected Layers” is written as “DCL,” and “Convolutional Neural Network” as “CNN.”

1, Difficulty of Understanding RNN
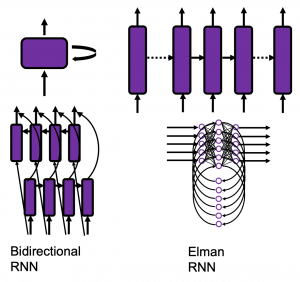
I bet a part of difficulty of understanding RNN comes from the variety of its structures. If you search “recurrent neural network” on Google Image or something, you will see what I mean. But that cannot be helped because RNN enables a variety of tasks.

Another major difficulty of understanding RNN is understanding its back propagation algorithm. I think some of you found it hard to understand chain rules in calculating back propagation of densely connected layers, where you have to make the most of linear algebra. And I have to say backprop of RNN, especially LSTM, is a monster of chain rules. I am planing to upload not only a blog post on RNN backprop, but also a presentation slides with animations to make it more understandable, in some external links.

In order to avoid such confusions, I am going to introduce a very simplified type of RNN, which I call a “simple RNN.” The RNN displayed as the head image of this article is a simple RNN.

2, How Neurons are Connected
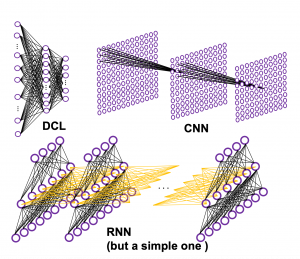
How to connect neurons and how to activate them is what neural networks are all about. Structures of those neurons are easy to grasp as long as that is about DCL or CNN. But when it comes to the structure of RNN, many study materials try to avoid showing that RNNs are also connections of neurons, as well as DCL or CNN(*If you are not sure how neurons are connected in CNN, this link should be helpful. Draw a random digit in the square at the corner.). In fact the structure of RNN is also the same, and as long as it is a simple RNN, and it is not hard to visualize its structure.

Even though RNN is also connections of neurons, usually most RNN charts are simplified, using blackboxes. In case of simple RNN, most study material would display it as the chart below.

But that also cannot be helped because fancier RNN have more complicated connections of neurons, and there are no longer advantages of displaying RNN as connections of neurons, and you would need to understand RNN in more abstract way, I mean, as you see in most of textbooks.

I am going to explain details of simple RNN in the next article of this series.

3, Neural Networks as Mappings

If you still think that neural networks are something like magical spider webs or models of brain tissues, forget that. They are just ordinary mappings.

If you have been allergic to mathematics in your life, you might have never heard of the word “mapping.” If so, at least please keep it in mind that the equation y=f(x), which most people would have seen in compulsory education, is a part of mapping. If you get a value x, you get a value y corresponding to the x.

But in case of deep learning, x is a vector or a tensor, and it is denoted in bold like \boldsymbol{x} . If you have never studied linear algebra , imagine that a vector is a column of Excel data (only one column), a matrix is a sheet of Excel data (with some rows and columns), and a tensor is some sheets of Excel data (each sheet does not necessarily contain only one column.)
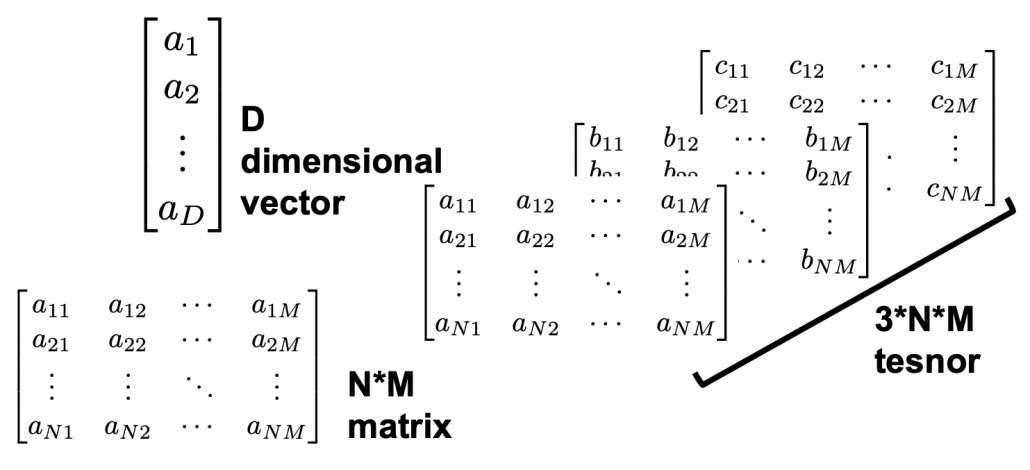
CNNs are mainly used for image processing, so their inputs are usually image data. Image data are in many cases (3, hight, width) tensors because usually an image has red, blue, green channels, and the image in each channel can be expressed as a height*width matrix (the “height” and the “width” are number of pixels, so they are discrete numbers).

The convolutional part of CNN (which I call “feature extraction part”) maps the tensors to a vector, and the last part is usually DCL, which works as classifier/regressor. At the end of the feature extraction part, you get a vector. I call it a “semantic vector” because the vector has information of “meaning” of the input image. In this link you can see maps of pictures plotted depending on the semantic vector. You can see that even if the pictures are not necessarily close pixelwise, they are close in terms of the “meanings” of the images.

In the example of a dog/cat classifier introduced by François Chollet, the developer of Keras, the CNN maps (3, 150, 150) tensors to 2-dimensional vectors, (1, 0) or (0, 1) for (dog, cat).

Wrapping up the points above, at least you should keep two points in mind: first, DCL is a classifier or a regressor, and CNN is a feature extractor used for image processing. And another important thing is, feature extraction parts of CNNs map images to vectors which are more related to the “meaning” of the image.

Importantly, I would like you to understand RNN this way. An RNN is also just a mapping.

*I recommend you to at least take a look at the beautiful pictures in this link. These pictures give you some insight into how CNN perceive images.

4, Problems of DCL and CNN, and needs for RNN

Taking an example of RNN task should be helpful for this topic. Probably machine translation is the most famous application of RNN, and it is also a good example of showing why DCL and CNN are not proper for some tasks. Its algorithms is out of the scope of this article series, but it would give you a good insight of some features of RNN. I prepared three sentences in German, English, and Japanese, which have the same meaning. Assume that each sentence is divided into some parts as shown below and that each vector corresponds to each part. In machine translation we want to convert a set of the vectors into another set of vectors.

Then let’s see why DCL and CNN are not proper for such task.

  • The input size is fixed: In case of the dog/cat classifier I have mentioned, even though the sizes of the input images varies, they were first molded into (3, 150, 150) tensors. But in machine translation, usually the length of the input is supposed to be flexible.
  • The order of inputs does not mater: In case of the dog/cat classifier the last section, even if the input is “cat,” “cat,” “dog” or “dog,” “cat,” “cat” there’s no difference. And in case of DCL, the network is symmetric, so even if you shuffle inputs, as long as you shuffle all of the input data in the same way, the DCL give out the same outcome . And if you have learned at least one foreign language, it is easy to imagine that the orders of vectors in sequence data matter in machine translation.

*It is said English language has phrase structure grammar, on the other hand Japanese language has dependency grammar. In English, the orders of words are important, but in Japanese as long as the particles and conjugations are correct, the orders of words are very flexible. In my impression, German grammar is between them. As long as you put the verb at the second position and the cases of the words are correct, the orders are also relatively flexible.

5, Sequence Data

We can say DCL and CNN are not useful when you want to process sequence data. Sequence data are a type of data which are lists of vectors. And importantly, the orders of the vectors matter. The number of vectors in sequence data is usually called time steps. A simple example of sequence data is meteorological data measured at a spot every ten minutes, for instance temperature, air pressure, wind velocity, humidity. In this case the data is recorded as 4-dimensional vector every ten minutes.

But this “time step” does not necessarily mean “time.” In case of natural language processing (including machine translation), which you I mentioned in the last section, the numberings of each vector denoting each part of sentences are “time steps.”

And RNNs are mappings from a sequence data to another sequence data.

In case of the machine translation above, the each sentence in German, English, and German is expressed as sequence data \boldsymbol{G}=(\boldsymbol{g}_1,\dots ,\boldsymbol{g}_{12}), \boldsymbol{E}=(\boldsymbol{e}_1,\dots ,\boldsymbol{e}_{11}), \boldsymbol{J}=(\boldsymbol{j}_1,\dots ,\boldsymbol{j}_{14}), and machine translation is nothing but mappings between these sequence data.


*At least I found a paper on the RNN’s capability of universal approximation on many-to-one RNN task. But I have not found any papers on universal approximation of many-to-many RNN tasks. Please let me know if you find any clue on whether such approximation is possible. I am desperate to know that. 

6, Types of RNN Tasks

RNN tasks can be classified into some types depending on the lengths of input/output sequences (the “length” means the times steps of input/output sequence data).

If you want to predict the temperature in 24 hours, based on several time series data points in the last 96 hours, the task is many-to-one. If you sample data every ten minutes, the input size is 96*6=574 (the input data is a list of 574 vectors), and the output size is 1 (which is a value of temperature). Another example of many-to-one task is sentiment classification. If you want to judge whether a post on SNS is positive or negative, the input size is very flexible (the length of the post varies.) But the output size is one, which is (1, 0) or (0, 1), which denotes (positive, negative).
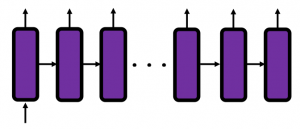
*The charts in this section are simplified model of RNN used for each task. Please keep it in mind that they are not 100% correct, but I tried to make them as exact as possible compared to those in other study materials.

Music/text generation can be one-to-many tasks. If you give the first sound/word you can generate a phrase.
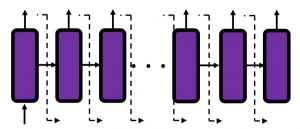
Next, let’s look at many-to-many tasks. Machine translation and voice recognition are likely to be major examples of many-to-many tasks, but here name entity recognition seems to be a proper choice. Name entity recognition is task of finding proper noun in a sentence . For example if you got two sentences “He said, ‘Teddy bears on sale!’ ” and ‘He said, “Teddy Roosevelt was a great president!” ‘ judging whether the “Teddy” is a proper noun or a normal noun is name entity recognition.
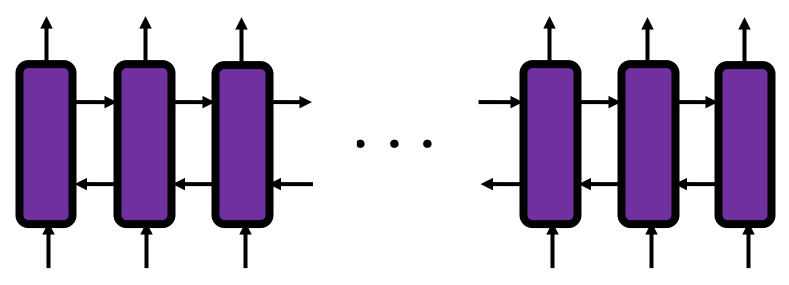
Machine translation and voice recognition, which are more popular, are also many-to-many tasks, but they use more sophisticated models. In case of machine translation, the inputs are sentences in the original language, and the outputs are sentences in another language. When it comes to voice recognition, the input is data of air pressure at several time steps, and the output is the recognized word or sentence. Again, these are out of the scope of this article but I would like to introduce the models briefly.

Machine translation uses a type of RNN named sequence-to-sequence model (which is often called seq2seq model). This model is also very important for other natural language processes tasks in general, such as text summarization. A seq2seq model is divided into the encoder part and the decoder part. The encoder gives out a hidden state vector and it used as the input of the decoder part. And decoder part generates texts, using the output of the last time step as the input of next time step.
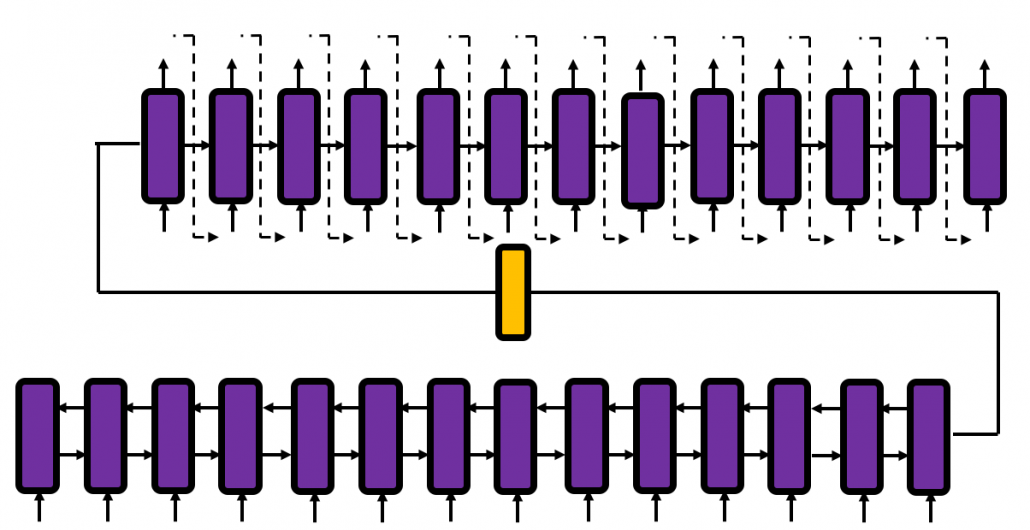
Voice recognition is also a famous application of RNN, but it also needs a special type of RNN.
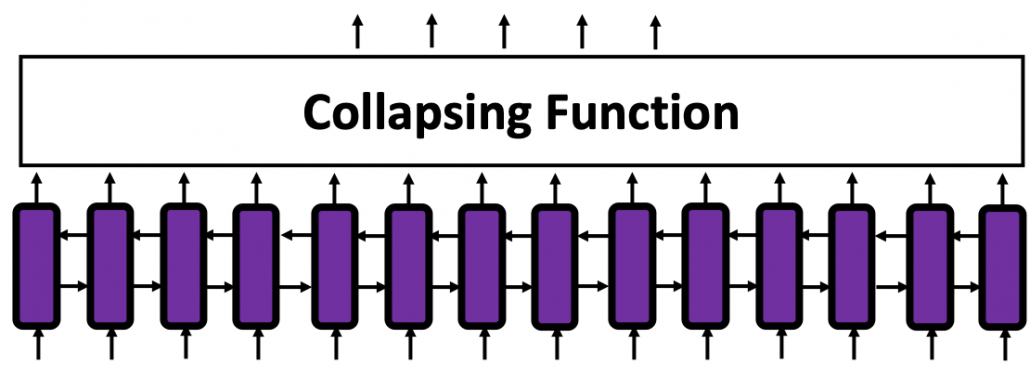
*To be honest, I don’t know what is the state-of-the-art voice recognition algorithm. The example in this article is a combination of RNN and a collapsing function made using Connectionist Temporal Classification (CTC). In this model, the output of RNN is much longer than the recorded words or sentences, so a collapsing function reduces the output into next output with normal length.

You might have noticed that RNNs in the charts above are connected in both directions. Depending on the RNN tasks you need such bidirectional RNNs.  I think it is also easy to imagine that such networks are necessary. Again, machine translation is a good example.

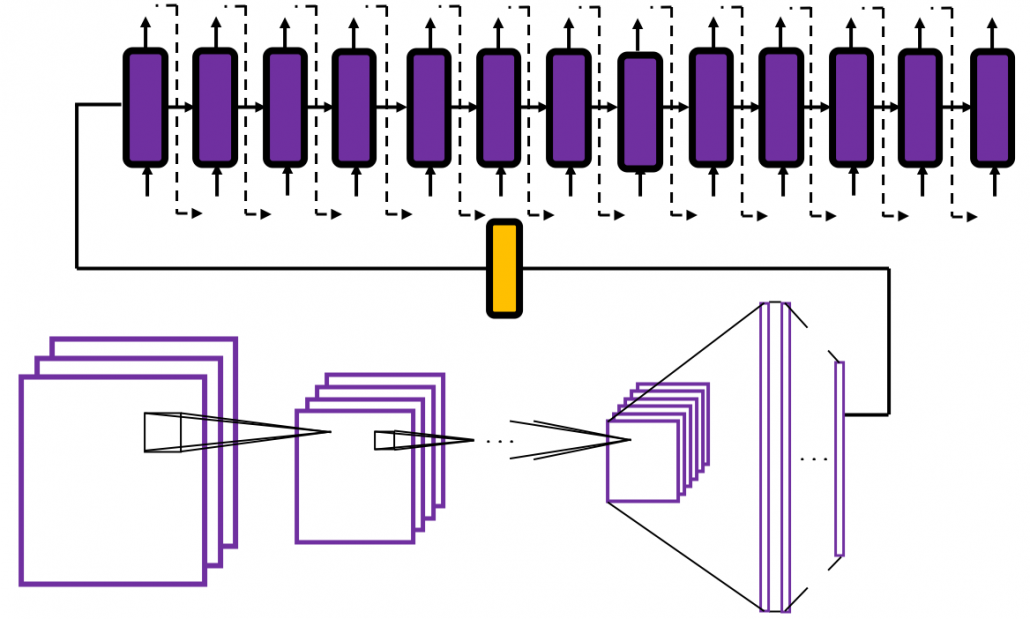
And interestingly, image captioning, which enables a computer to describe a picture, is one-to-many-task. As the output is a sentence, it is easy to imagine that the output is “many.” If it is a one-to-many task, the input is supposed to be a vector.

Where does the input come from? I mentioned that the last some layers in of CNN are closely connected to how CNNs extract meanings of pictures. Surprisingly such vectors, which I call a “semantic vectors” is the inputs of image captioning task (after some transformations, depending on the network models).
I think this articles includes major things you need to know as prerequisites when you want to understand RNN at more mathematical level. In the next article, I would like to explain the structure of a simple RNN, and how it forward propagate.

* I make study materials on machine learning, sponsored by DATANOMIQ. I do my best to make my content as straightforward but as precise as possible. I include all of my reference sources. If you notice any mistakes in my materials, please let me know (email: yasuto.tamura@datanomiq.de). And if you have any advice for making my materials more understandable to learners, I would appreciate hearing it.

Interview: Operationalisierung von Data Science

Interview mit Herrn Dr. Frank Block von Roche Diagnostics über Operationalisierung von Data Science

Herr Dr. Frank Block ist Head of IT Data Science bei Roche Diagnostics mit Sitz in der Schweiz. Zuvor war er Chief Data Scientist bei der Ricardo AG nachdem er für andere Unternehmen die Datenanalytik verantwortet hatte und auch 20 Jahre mit mehreren eigenen Data Science Consulting Startups am Markt war. Heute tragen ca. 50 Mitarbeiter bei Roche Diagnostics zu Data Science Projekten bei, die in sein Aktivitätsportfolio fallen: 

Data Science Blog: Herr Dr. Block, Sie sind Leiter der IT Data Science bei Roche Diagnostics? Warum das „IT“ im Namen dieser Abteilung?

Roche ist ein großes Unternehmen mit einer großen Anzahl von Data Scientists in ganz verschiedenen Bereichen mit jeweils sehr verschiedenen Zielsetzungen und Themen, die sie bearbeiten. Ich selber befinde mich mit meinem Team im Bereich „Diagnostics“, d.h. der Teil von Roche, in dem Produkte auf den Markt gebracht werden, die die korrekte Diagnose von Krankheiten und Krankheitsrisiken ermöglichen. Innerhalb von Roche Diagnostics gibt es wiederum verschiedene Bereiche, die Data Science für ihre Zwecke nutzen. Mit meinem Team sind wir in der globalen IT-Organisation angesiedelt und kümmern uns dort insbesondere um Anwendungen von Data Science für die Optimierung der internen Wertschöpfungskette.

Data Science Blog: Sie sind längst über die ersten Data Science Experimente hinaus. Die Operationalisierung von Analysen bzw. analytischen Applikationen ist für Sie besonders wichtig. Welche Rolle spielt das Datenmanagement dabei? Und wo liegen die Knackpunkte?

Ja, richtig. Die Zeiten, in denen sich Data Science erlauben konnte „auf Vorrat“ an interessanten Themen zu arbeiten, weil sie eben super interessant sind, aber ohne jemals konkrete Wertschöpfung zu liefern, sind definitiv und ganz allgemein vorbei. Wir sind seit einigen Jahren dabei, den Übergang von Data Science Experimenten (wir nennen es auch gerne „proof-of-value“) in die Produktion voranzutreiben und zu optimieren. Ein ganz essentielles Element dabei stellen die Daten dar; diese werden oft auch als der „Treibstoff“ für Data Science basierte Prozesse bezeichnet. Der große Unterschied kommt jedoch daher, dass oft statt „Benzin“ nur „Rohöl“ zur Verfügung steht, das zunächst einmal aufwändig behandelt und vorprozessiert werden muss, bevor es derart veredelt ist, dass es für Data Science Anwendungen geeignet ist. In diesem Veredelungsprozess wird heute noch sehr viel Zeit aufgewendet. Je besser die Datenplattformen des Unternehmens, umso größer die Produktivität von Data Science (und vielen anderen Abnehmern dieser Daten im Unternehmen). Ein anderes zentrales Thema stellt der Übergang von Data Science Experiment zu Operationalisierung dar. Hier muss dafür gesorgt werden, dass eine reibungslose Übergabe von Data Science an das IT-Entwicklungsteam erfolgt. Die Teamzusammensetzung verändert sich an dieser Stelle und bei uns tritt der Data Scientist von einer anfänglich führenden Rolle in eine Beraterrolle ein, wenn das System in die produktive Entwicklung geht. Auch die Unterstützung der Operationalisierung durch eine durchgehende Data Science Plattform kann an dieser Stelle helfen.

Data Science Blog: Es heißt häufig, dass Data Scientists kaum zu finden sind. Ist Recruiting für Sie tatsächlich noch ein Thema?

Generell schon, obwohl mir scheint, dass dies nicht unser größtes Problem ist. Glücklicherweise übt Roche eine große Anziehung auf Talente aus, weil im Zentrum unseres Denkens und Handelns der Patient steht und wir somit durch unsere Arbeit einen sehr erstrebenswerten Zweck verfolgen. Ein zweiter Aspekt beim Aufbau eines Data Science Teams ist übrigens das Halten der Talente im Team oder Unternehmen. Data Scientists suchen vor allem spannenden und abwechselnden Herausforderungen. Und hier sind wir gut bedient, da die Palette an Data Science Anwendungen derart breit ist, dass es den Kollegen im Team niemals langweilig wird.

Data Science Blog: Sie haben bereits einige Analysen erfolgreich produktiv gebracht. Welche Herausforderungen mussten dabei überwunden werden? Und welche haben Sie heute noch vor sich?

Wir konnten bereits eine wachsende Zahl an Data Science Experimenten in die Produktion überführen und sind sehr stolz darauf, da dies der beste Weg ist, nachhaltig Geschäftsmehrwert zu generieren. Die gleichzeitige Einbettung von Data Science in IT und Business ist uns bislang gut gelungen, wir werden aber noch weiter daran arbeiten, denn je näher wir mit unseren Kollegen in den Geschäftsabteilungen arbeiten, umso besser wird sichergestellt, das Data Science sich auf die wirklich relevanten Themen fokussiert. Wir sehen auch guten Fortschritt aus der Datenperspektive, wo zunehmend Daten über „Silos“ hinweg integriert werden und so einfacher nutzbar sind.

Data Science Blog: Data Driven Thinking wird heute sowohl von Mitarbeitern in den Fachbereichen als auch vom Management verlangt. Sind wir schon so weit? Wie könnten wir diese Denkweise im Unternehmen fördern?

Ich glaube wir stecken mitten im Wandel, Data-Driven Decisions sind im Kommen, aber das braucht auch seine Zeit. Indem wir zeigen, welches Potenzial ganz konkrete Daten und Advanced Analytics basierte Entscheidungsprozesse innehaben, helfen wir, diesen Wandel voranzutreiben. Spezifische Weiterbildungsangebote stellen eine andere Komponente dar, die diesen Transformationszrozess unterstützt. Ich bin überzeugt, dass wenn wir in 10-20 Jahren zurückblicken, wir uns fragen, wie wir überhaupt ohne Data-Driven Thinking leben konnten…

As Businesses Struggle With ML, Automation Offers a Solution

In recent years, machine learning technology and the business solutions it enables has developed into a big business in and of itself. According to the industry analysts at IDC, spending on ML and AI technology is set to grow to almost $98 billion per year by 2023. In practical terms, that figure represents a business environment where ML technology has become a key priority for companies of every kind.

That doesn’t mean that the path to adopting ML technology is easy for businesses. Far from it. In fact, survey data seems to indicate that businesses are still struggling to get their machine learning efforts up and running. According to one such survey, it currently takes the average business as many as 90 days to deploy a single machine learning model. For 20% of businesses, that number is even higher.

From the data, it seems clear that something is missing in the methodologies that most companies rely on to make meaningful use of machine learning in their business workflows. A closer look at the situation reveals that the vast majority of data workers (analysts, data scientists, etc.) spend an inordinate amount of time on infrastructure work – and not on creating and refining machine learning models.

Streamlining the ML Adoption Process

To fix that problem, businesses need to turn to another growing area of technology: automation. By leveraging the latest in automation technology, it’s now possible to build an automated machine learning pipeline (AutoML pipeline) that cuts down on the repetitive tasks that slow down ML deployments and lets data workers get back to the work they were hired to do. With the right customized solution in place, a business’s ML team can:

  • Reduce the time spent on data collection, cleaning, and ingestion
  • Minimize human errors in the development of ML models
  • Decentralize the ML development process to create an ML-as-a-service model with increased accessibility for all business stakeholders

In short, an AutoML pipeline turns the high-effort functions of the ML development process into quick, self-adjusting steps handled exclusively by machines. In some use cases, an AutoML pipeline can even allow non-technical stakeholders to self-create ML solutions tailored to specific business use cases with no expert help required. In that way, it can cut ML costs, shorten deployment time, and allow data scientists to focus on tackling more complex modelling work to develop custom ML solutions that are still outside the scope of available automation techniques.

The Parts of an AutoML Pipeline

Although the frameworks and tools used to create an AutoML pipeline can vary, they all contain elements that conform to the following areas:

  • Data Preprocessing – Taking available business data from a variety of sources, cleaning it, standardizing it, and conducting missing value imputation
  • Feature Engineering – Identifying features in the raw data set to create hypotheses for the model to base predictions on
  • Model Selection – Choosing the right ML approach or hyperparameters to produce the desired predictions
  • Tuning Hyperparameters – Determining which hyperparameters help the model achieve optimal performance

As anyone familiar with ML development can tell you, the steps in the above process tend to represent the majority of the labour and time-intensive work that goes into creating a model that’s ready for real-world business use. It is also in those steps where the lion’s share of business ML budgets get consumed, and where most of the typical delays occur.

The Limitations and Considerations for Using AutoML

Given the scope of the work that can now become part of an AutoML pipeline, it’s tempting to imagine it as a panacea – something that will allow a business to reduce its reliance on data scientists going forward. Right now, though, the technology can’t do that. At this stage, AutoML technology is still best used as a tool to augment the productivity of business data teams, not to supplant them altogether.

To that end, there are some considerations that businesses using AutoML will need to keep in mind to make sure they get reliable, repeatable, and value-generating results, including:

  • Transparency – Businesses must establish proper vetting procedures to make sure they understand the models created by their AutoML pipeline, so they can explain why it’s making the choices or predictions it’s making. In some industries, such as in medicine or finance, this could even fall under relevant regulatory requirements.
  • Extensibility – Making sure the AutoML framework may be expanded and modified to suit changing business needs or to tackle new challenges as they arise.
  • Monitoring and Maintenance – Since today’s AutoML technology isn’t a set-it-and-forget-it proposition, it’s important to establish processes for the monitoring and maintenance of the deployment so it can continue to produce useful and reliable ML models.

The Bottom Line

As it stands today, the convergence of automation and machine learning holds the promise of delivering ML models at scale for businesses, which would greatly speed up the adoption of the technology and lower barriers to entry for those who have yet to embrace it. On the whole, that’s great news both for the businesses that will benefit from increased access to ML technology, as well as for the legions of data professionals tasked with making it all work.

It’s important to note, of course, that complete end-to-end ML automation with no human intervention is still a long way off. While businesses should absolutely explore building an automated machine learning pipeline to speed up development time in their data operations, they shouldn’t lose sight of the fact that they still need plenty of high-skilled data scientists and analysts on their teams. It’s those specialists that can make appropriate and productive use of the technology. Without them, an AutoML pipeline would accomplish little more than telling the business what it wants to hear.

The good news is that the AutoML tools that exist right now are sufficient to alleviate many of the real-world problems businesses face in their road to ML adoption. As they become more commonplace, there’s little doubt that the lead time to deploy machine learning models is going to shrink correspondingly – and that businesses will enjoy higher ROI and enhanced outcomes as a result.

Data Analytics & Artificial Intelligence Trends in 2020

Artificial intelligence has infiltrated all aspects of our lives and brought significant improvements.

Although the first thing that comes to most people’s minds when they think about AI are humanoid robots or intelligent machines from sci-fi flicks, this technology has had the most impressive advancements in the field of data science.

Big data analytics is what has already transformed the way we do business as it provides an unprecedented insight into a vast amount of unstructured, semi-structured, and structured data by analyzing, processing, and interpreting it.

Data and AI specialists and researchers are likely to have a field day in 2020, so here are some of the most important trends in this industry.

1. Predictive Analytics

As its name suggests, this trend will be all about using gargantuan data sets in order to predict outcomes and results.

This practice is slated to become one of the biggest trends in 2020 because it will help businesses improve their processes tremendously. It will find its place in optimizing customer support, pricing, supply chain, recruitment, and retail sales, to name just a few.

For example, Amazon has already been leveraging predictive analytics for its dynamic pricing model. Namely, the online retail giant uses this technology to analyze the demand for a particular product, competitors’ prices, and a number of other parameters in order to adjust its price.

According to stats, Amazon changes prices 2.5 million times a day so that a particular product’s cost fluctuates and changes every 10 minutes, which requires an extremely predictive analytics algorithm.

2. Improved Cybersecurity

In a world of advanced technologies where IoT and remotely controlled devices having top-notch protection is of critical importance.

Numerous businesses and individuals have fallen victim to ruthless criminals who can steal sensitive data or wipe out entire bank accounts. Even some big and powerful companies suffered huge financial and reputation blows due to cyber attacks they were subjected to.

This kind of crime is particularly harsh for small and medium businesses. Stats say that 60% of SMBs are forced to close down after being hit by such an attack.

AI again takes advantage of its immense potential for analyzing and processing data from different sources quickly and accurately. That’s why it’s capable of assisting cybersecurity specialists in predicting and preventing attacks.

In case that an attack emerges, the response time is significantly shorter, so that the worst-case scenario can be avoided.

When we’re talking about avoiding security risks, AI can improve enterprise risk management, too, by providing guidance and assisting risk management professionals.

3. Digital Workers

In 2020, an army of digital workers will transform the traditional workspace and take productivity to a whole new level.

Virtual assistants and chatbots are some examples of already existing digital workers, but it will be even more of them. According to research, this trend is one the rise, as it’s expected that AI software and robots will increase by 50% by 2022.

Robots will take over even some small tasks in the office. The point is to streamline the entire business process, and that can be achieved by training robots to perform small and simple tasks like human employees. The only difference will be that digital workers will do that faster and without any mistakes.

4. Hybrid Workforce

Many people worry that AI and automation will steal their jobs and render them unemployed.

Even the stats are bleak – AI will eliminate 1.8 million jobs. But, on the other hand, it will create 2.3 million new jobs.

So, our future is actually AI and humans working together, and that’s what will become the business normalcy in 2020.

Robotic process automation and different office digital workers will be in charge of tedious and repetitive tasks, while more sophisticated issues that require critical thinking and creativity will be human workers’ responsibility.

One of the most important things about creating this hybrid workforce is for businesses to openly discuss it with their employees and explain how these new technologies will be used. A regular workforce has to know that they will be working alongside machines whose job will be to speed up the processes and cut costs.

5. Process Intelligence

This AI trend will allow businesses to gain insight into their processes by using all the information contained in their system and creating an overall, real-time, and accurate visual model of all the processes.

What’s great about it is that it’s possible to see these processes from different perspectives – across departments, functions, staff, and locations.

With such a visual model, it’s possible to properly analyze these processes, identify potential bottlenecks, and eliminate them before they even begin to emerge.

Besides, as this is AI and data analytics at their best, this technology will also facilitate decision-making by predicting the future results of tech investments.

Needless to say, Process Intelligence will become an enterprise standard very soon, thanks to its ability to provide a better understanding and effective management of end-to-end processes.

As you can see, in 2020, these two advanced technologies will continue to evolve and transform the business landscape and change it for the better.

Six properties of modern Business Intelligence

Regardless of the industry in which you operate, you need information systems that evaluate your business data in order to provide you with a basis for decision-making. These systems are commonly referred to as so-called business intelligence (BI). In fact, most BI systems suffer from deficiencies that can be eliminated. In addition, modern BI can partially automate decisions and enable comprehensive analyzes with a high degree of flexibility in use.


Read this article in German:
“Sechs Eigenschaften einer modernen Business Intelligence“


Let us discuss the six characteristics that distinguish modern business intelligence, which mean taking technical tricks into account in detail, but always in the context of a great vision for your own company BI:

1. Uniform database of high quality

Every managing director certainly knows the situation that his managers do not agree on how many costs and revenues actually arise in detail and what the margins per category look like. And if they do, this information is often only available months too late.

Every company has to make hundreds or even thousands of decisions at the operational level every day, which can be made much more well-founded if there is good information and thus increase sales and save costs. However, there are many source systems from the company’s internal IT system landscape as well as other external data sources. The gathering and consolidation of information often takes up entire groups of employees and offers plenty of room for human error.

A system that provides at least the most relevant data for business management at the right time and in good quality in a trusted data zone as a single source of truth (SPOT). SPOT is the core of modern business intelligence.

In addition, other data on BI may also be made available which can be useful for qualified analysts and data scientists. For all decision-makers, the particularly trustworthy zone is the one through which all decision-makers across the company can synchronize.

2. Flexible use by different stakeholders

Even if all employees across the company should be able to access central, trustworthy data, with a clever architecture this does not exclude that each department receives its own views of this data. Many BI systems fail due to company-wide inacceptance because certain departments or technically defined employee groups are largely excluded from BI.

Modern BI systems enable views and the necessary data integration for all stakeholders in the company who rely on information and benefit equally from the SPOT approach.

3. Efficient ways to expand (time to market)

The core users of a BI system are particularly dissatisfied when the expansion or partial redesign of the information system requires too much of patience. Historically grown, incorrectly designed and not particularly adaptable BI systems often employ a whole team of IT staff and tickets with requests for change requests.

Good BI is a service for stakeholders with a short time to market. The correct design, selection of software and the implementation of data flows / models ensures significantly shorter development and implementation times for improvements and new features.

Furthermore, it is not only the technology that is decisive, but also the choice of organizational form, including the design of roles and responsibilities – from the technical system connection to data preparation, pre-analysis and support for the end users.

4. Integrated skills for Data Science and AI

Business intelligence and data science are often viewed and managed separately from each other. Firstly, because data scientists are often unmotivated to work with – from their point of view – boring data models and prepared data. On the other hand, because BI is usually already established as a traditional system in the company, despite the many problems that BI still has today.

Data science, often referred to as advanced analytics, deals with deep immersion in data using exploratory statistics and methods of data mining (unsupervised machine learning) as well as predictive analytics (supervised machine learning). Deep learning is a sub-area of ​​machine learning and is used for data mining or predictive analytics. Machine learning is a sub-area of ​​artificial intelligence (AI).

In the future, BI and data science or AI will continue to grow together, because at the latest after going live, the prediction models flow back into business intelligence. BI will probably develop into ABI (Artificial Business Intelligence). However, many companies are already using data mining and predictive analytics in the company, using uniform or different platforms with or without BI integration.

Modern BI systems also offer data scientists a platform to access high-quality and more granular raw data.

5. Sufficiently high performance

Most readers of these six points will probably have had experience with slow BI before. It takes several minutes to load a daily report to be used in many classic BI systems. If loading a dashboard can be combined with a little coffee break, it may still be acceptable for certain reports from time to time. At the latest, however, with frequent use, long loading times and unreliable reports are no longer acceptable.

One reason for poor performance is the hardware, which can be almost linearly scaled to higher data volumes and more analysis complexity using cloud systems. The use of cloud also enables the modular separation of storage and computing power from data and applications and is therefore generally recommended, but not necessarily the right choice for all companies.

In fact, performance is not only dependent on the hardware, the right choice of software and the right choice of design for data models and data flows also play a crucial role. Because while hardware can be changed or upgraded relatively easily, changing the architecture is associated with much more effort and BI competence. Unsuitable data models or data flows will certainly bring the latest hardware to its knees in its maximum configuration.

6. Cost-effective use and conclusion

Professional cloud systems that can be used for BI systems offer total cost calculators, such as Microsoft Azure, Amazon Web Services and Google Cloud. With these computers – with instruction from an experienced BI expert – not only can costs for the use of hardware be estimated, but ideas for cost optimization can also be calculated. Nevertheless, the cloud is still not the right solution for every company and classic calculations for on-premise solutions are necessary.

Incidentally, cost efficiency can also be increased with a good selection of the right software. Because proprietary solutions are tied to different license models and can only be compared using application scenarios. Apart from that, there are also good open source solutions that can be used largely free of charge and can be used for many applications without compromises.

However, it is wrong to assess the cost of a BI only according to its hardware and software costs. A significant part of cost efficiency is complementary to the aspects for the performance of the BI system, because suboptimal architectures work wastefully and require more expensive hardware than neatly coordinated architectures. The production of the central data supply in adequate quality can save many unnecessary processes of data preparation and many flexible analysis options also make redundant systems unnecessary and lead to indirect savings.

In any case, a BI for companies with many operational processes is always cheaper than no BI. However, if you take a closer look with BI expertise, cost efficiency is often possible.

Interview – There is no stand-alone strategy for AI, it must be part of the company-wide strategy

Ronny FehlingRonny Fehling is Partner and Associate Director for Artificial Intelligence as the Boston Consulting Group GAMMA. With more than 20 years of continually progressive experience in leading business and technology innovation, spearheading digital transformation, and aligning the corporate strategy with Artificial Intelligence he industry-leading organizations to grow their top-line and kick-start their digital transformation.


Ronny Fehling is furthermore speaker of the Predictive Analytics World for Industry 4.0 in May 2020.

Data Science Blog: Mr. Fehling, you are consulting companies and business leaders about AI and how to get started with it. AI as a definition is often misleading. How do you define AI?

This is a good question. I think there are two ways to answer this:

From a technical definition, I often see expressions about “simulation of human intelligence” and “acting like a human”. I find using these terms more often misleading rather than helpful. I studied AI back when it wasn’t yet “cool” and still middle of the AI winter. And yes, we have much more compute power and access to data, but we also think about data in a very different way. For me, I typically distinguish between machine learning, which uses algorithms and statistical methods to identify patterns in data, and AI, which for me attempts to interpret the data in a given context. So machine learning can help me identify and analyze frequency patterns in text and even predict the next word I will type based on my history. AI will help me identify ‘what’ I’m writing about – even if I don’t explicitly name it. It can tell me that when I’m asking “I’m looking for a place to stay” that I might want to see a list of hotels around me. In other words: machine learning can detect correlations and similar patterns, AI uses machine learning to generate insights.

I always wondered why top executives are so frequently asking about the definition of AI because at first it seemed to me not as relevant to the discussion on how to align AI with their corporate strategy. However, I started to realize that their question is ultimately about “What is AI and what can it do for me?”.

For me, AI can do three things really good, which humans cannot really do and previous approaches couldn’t cope with:

  1. Finding similar patterns in historical data. Imagine 20 years of data like maintenance or repair documents of a manufacturing plant. Although they describe work done on a multitude of products due to a multitude of possible problems, AI can use this to look for a very similar situation based on a current problem description. This can be used to identify a common root cause as well as a common solution approach, saving valuable time for the operation.
  2. Finding correlations across time or processes. This is often used in predictive maintenance use cases. Here, the AI tries to see what similar events happen typically at some time before a failure happen. This way, it can alert the operator much earlier about an impending failure, say due to a change in the vibration pattern of the machine.
  3. Finding an optimal solution path based on many constraints. There are many problems in the business world, where choosing the optimal path based on complex situations is critical. Let’s say that suddenly a severe weather warning at an airport forces an airline to have to change their scheduling because of a reduced airport capacity. Delays for some aircraft can cause disruptions because passengers or personnel not being able to connect anymore. Knowing which aircraft to delay, which to cancel, which to switch while causing the minimal amount of disruption to passengers, crew, maintenance and ground-crew is something AI can help with.

The key now is to link these fundamental capabilities with the business context of the company and how it can ultimately help transform.

Data Science Blog: Companies are still starting with their own company-wide data strategy. And now they are talking about AI strategies. Is that something which should be handled separately?

In my experience – both based on having seen the implementations of several corporate data strategies as well as my upbringing at Oracle – the data strategy and AI strategy are co-dependent and cannot be separated. Very often I hear from clients that they think they first need to bring their data in order before doing AI project. And yes, without good data access, AI cannot really work. In fact, most of the time spent on AI is spent on processing, cleansing, understanding and contextualizing the data. However, you cannot really know what data will be needed in which form without knowing what you want to use it for. This is why strategies that handle data and AI separately mostly fail and generate huge costs.

Data Science Blog: What are the important steps for developing a good data strategy? Is there something like a general approach?

In my eyes, the AI strategy defines the data strategy step by step as more use cases are implemented. Rather than focusing too quickly at how to get all corporate data into a data lake, it will be much more important to start creating a use-case, technology and data governance. This governance has to be established once the AI strategy is starting to mature to enable the scale up and productization. At the beginning is to find the (very few) use-cases that can serve as light house projects to demonstrate (1) value impact, (2) a way to go from MVP to Pilot, and (3) how to address the data challenge. This will then more naturally identify the elements of governance, data access and technology that are required.

Data Science Blog: What are the most common questions from business leaders to you regarding AI? Why do they hesitate to get started?

By far it the most common question I get is: how do I get started? The hesitations often come from multiple sources like: “We don’t have the talent in house to do AI”, “Our data is not good enough”, “We don’t know which use-case to start with”, “It’s not easy for us to embrace agile and failure culture because our products are mission critical”, “We don’t know how much value this can bring us”.

Data Science Blog: Most managers prefer to start small and with lower risk. They seem to postpone bigger ideas to a later stage, at least some milestones should be reached. Is that a good idea or should they think bigger?

AI is often associated (rightfully so) with a new way of working – agile and embracing failures. Similarly, there is also the perception of significant cost to starting with AI (talent, technology, data). These perceptions often lead managers wanting to start with several smaller ambition use-cases where failure isn’t that grave. Once they have proven itself somehow, they would then move on to bigger projects. The problem with this strategy is on the one side that you fragment your few precious AI resources on too many projects and at the same time you cannot really demonstrate an impact since the projects weren’t chosen based on their impact potential.

The AI pioneers typically were successful by “thinking big, starting small and scaling fast”. You start by assessing the value potential of a use-case, for example: my current OEE (Overall Equipment Efficiency) is at 65%. There is an addressable loss of 25% which would grow my top line by $X. With the help of AI experts, you then create a hypothesis of how you think you can reduce that loss. This might be by choosing one specific equipment and 50% of the addressable loss. This is now the measure against which you define your failure or non-failure criteria. Once you have proven an MVP that can solve this loss, you scale up by piloting it in real-life setting and then scaling it to all the equipment. At every step of this process, you have a failure criterion that is measured by the impact value.


Virtual Edition, 11-12 MAY, 2020

The premier machine learning
conference for industry 4.0

This year Predictive Analytics World for Industry 4.0 runs alongside Deep Learning World and Predictive Analytics World for Healthcare.

Simplify Vendor Onboarding with Automated Data Integration

Vendor onboarding is a key business process that involves collecting and processing large data volumes from one or multiple vendors. Business users need vendor information in a standardized format to use it for subsequent data processes. However, consolidating and standardizing data for each new vendor requires IT teams to write code for custom integration flows, which can be a time-consuming and challenging task.

In this blog post, we will talk about automated vendor onboarding and how it is far more efficient and quicker than manually updating integration flows.

Problems with Manual Integration for Vendor Onboarding

During the onboarding process, vendor data needs to be extracted, validated, standardized, transformed, and loaded into the target system for further processing. An integration task like this involves coding, updating, and debugging manual ETL pipelines that can take days and even weeks on end.

Every time a vendor comes on board, this process is repeated and executed to load the information for that vendor into the unified business system. Not just this, but because vendor data is often received from disparate sources in a variety of formats (CSV, Text, Excel), these ETL pipelines frequently break and require manual fixes.

All this effort is not suitable, particularly for large-scale businesses that onboard hundreds of vendors each month. Luckily, there is a faster alternative available that involves no code-writing.

Automated Data Integration

The manual onboarding process can be automated using purpose-built data integration tools.

To help you better understand the advantages, here is a step-by-step guide on how automated data integration for vendor onboarding works:

  1. Vendor data is retrieved from heterogeneous sources such as databases, FTP servers, and web APIs through built-in connectors available in the solution.
  2. The data from each file is validated by passing it through a set of predefined quality rules – this step helps in eliminating records with missing, duplicate, or incorrect data.
  3. Transformations are applied to convert input data into the desired output format or screen vendors based on business criteria. For example, if the vendor data is stored in Excel sheets and the business uses SQL Server for data storage, then the data has to be mapped to the relevant fields in the SQL Server database, which is the destination.
  4. The standardized, validated data is then loaded into a unified enterprise database that you can use as the source of information for business processes. In some cases, this can be a staging database where you can perform further filtering and aggregation to build a consolidated vendor database.
  5. This entire ETL pipeline (Step 1 through Step 4) can then be automated through event-based or time-based triggers in a workflow. For instance, you may want to run the pipeline once every day, or once a new file/data point is available in your FTP server.

Why Build a Consolidated Database for Vendors?

Once the ETL pipeline runs, you will end up with a consolidated database with complete vendor information. The main benefit of having a unified database is that it would have filtered information regarding vendors.

Most businesses have a strict process for screening vendors that follows a set of predefined rules. For example, you may want to reject vendors that have a poor credit history automatically. With manual data integration, you would need to perform this filtering by writing code. Automated data integration allows you to apply pre-built filters directly within your ETL pipeline to flag or remove vendors with a credit score lower than the specified threshold.

This is just one example; you can perform a wide range of tasks at this level in your ETL pipeline including vendor scoring (calculated based on multiple fields in your data), filtering (based on rules applied to your data), and data aggregation (to add measures to your data) to build a robust vendor database for decision-making and subsequent processes.

Conclusion

Automated vendor onboarding offers cost-and-time benefits to your organization. Making use of enterprise-grade data integration tools ensures a seamless business-to-vendor data exchange without the need for reworking and upgrading your ETL pipelines.

Interview – Predictive Maintenance and how it can unleash cost savings

Interview with Dr. Kai Goebel, Principal Scientist at PARC, a Xerox Company, about Predictive Maintenance and how it can unleash cost savings.

Dr. Kai Goebel is principal scientist as PARC with more than two decades experience in corporate and government research organizations. He is responsible for leading applied research on state awareness, prognostics and decision-making using data analytics, AI, hybrid methods and physics-base methods. He has also fielded numerous applications for Predictive Maintenance at General Electric, NASA, and PARC for uses as diverse as rocket launchpads, jet engines, and chemical plants.

Data Science Blog: Mr. Goebel, predictive maintenance is not just a hype since industrial companies are already trying to establish this use case of predictive analytics. What benefits do they really expect from it?

Predictive Maintenance is a good example for how value can be realized from analytics. The result of the analytics drives decisions about when to schedule maintenance in advance of an event that might cause unexpected shutdown of the process line. This is in contrast to an uninformed process where the decision is mostly reactive, that is, maintenance is scheduled because equipment has already failed. It is also in contrast to a time-based maintenance schedule. The benefits of Predictive Maintenance are immediately clear: one can avoid unexpected downtime, which can lead to substantial production loss. One can manage inventory better since lead times for equipment replacement can be managed well. One can also manage safety better since equipment health is understood and safety averse situations can potentially be avoided. Finally, maintenance operations will be inherently more efficient as they shift significant time from inspection to mitigation of.

Data Science Blog: What are the most critical success factors for implementing predictive maintenance?

Critical for success is to get the trust of the operator. To that end, it is imperative to understand the limitations of the analytics approach and to not make false performance promises. Often, success factors for implementation hinge on understanding the underlying process and the fault modes reasonably well. It is important to be able to recognize the difference between operational changes and abnormal conditions. It is equally important to recognize rare events reliably while keeping false positives in check.

Data Science Blog: What kind of algorithm does predictive maintenance work with? Do you differentiate between approaches based on classical machine learning and those based on deep learning?

Well, there is no one kind of algorithm that works for Predictive Mantenance everywhere. Instead, one should look at the plurality of all algorithms as tools in a toolbox. Then analyze the problem – how many examples for run-to-failure trajectories are there; what is the desired lead time to report on a problem; what is the acceptable false positive/false negative rate; what are the different fault modes; etc – and use the right kind of tool to do the job. Just because a particular approach (like the one you mentioned in your question) is all the hype right now does not mean it is the right tool for the problem. Sometimes, approaches from what you call “classical machine learning” actually work better. In fact, one should consider approaches even outside the machine learning domain, either as stand-alone approach as in a hybrid configuration. One may also have to invent new methods, for example to perform online learning of the dynamic changes that a system undergoes through its (long) life. In the end, a customer does not care about what approach one is using, only if it solves the problem.

Data Science Blog: There are several providers for predictive analytics software. Is it all about software tools? What makes the difference for having success?

Frequently, industrial partners lament that they have to spend a lot of effort in teaching a new software provider about the underlying industrial processes as well as the equipment and their fault modes. Others are tired of false promises that any kind of data (as long as you have massive amounts of it) can produce any kind of performance. If one does not physically sense a certain modality, no algorithmic magic can take place. In other words, it is not just all about the software. The difference for having success is understanding that there is no cookie cutter approach. And that realization means that one may have to role up the sleeves and to install new instrumentation.

Data Science Blog: What are coming trends? What do you think will be the main topic 2020 and 2021?

Predictive Maintenance is slowly evolving towards Prescriptive Maintenance. Here, one does not only seek to inform about an impending problem, but also what to do about it. Such an approach needs to integrate with the logistics element of an organization to find an optimal decision that trades off several objectives with regards to equipment uptime, process quality, repair shop loading, procurement lead time, maintainer availability, safety constraints, contractual obligations, etc.

Conversion Rate Optimization: Understanding the Sales Funnel

Are you capturing the attention of consumers or prospects with your content? Do they trust you enough to give you their contact information? Will they come back and buy from you again? Knowing how the sales funnel works and what you can do to improve it will take you down the road of success.

Business 101

As a business owner, your goal is to turn a prospect (meaning a prospective buyer) into a loyal customer. Nobody wants to lose a possible customer after putting a lot of effort into the attempt of establishing a relationship. Once you understand the different stages of the sales funnel, it will be easier to find cracks and holes within. The following sections unpack how sales funnel management can help you optimize your conversion rate and build a successful long-term relationship with your customers and website users.

The Sales Funnel

The sales funnel describes the path a customer takes on the way to buying a product or service. It visualizes the typical journey they go through and in which stage of the buying decision prospects are at the moment. As one of the core concepts in digital marketing, sales funnel management can help you to understand your audience and prevent them from dropping out before a sale is made. It is about giving every potential customer the treatment they are looking for. If you don’t understand your sales funnel, you can’t optimize it. What matters most when it comes to a sales funnel is website optimization.

Prospects move from the top of the funnel to the bottom as they become more familiar with what you have to offer. The sales funnel narrows as visitors move through it, and the number of people in your funnel will continue to decrease the closer you get to sealing the deal. It starts at the top with all the prospects who landed on your website one way or another, while the narrow bottom represents loyal customers.

The 4 Stages of the Sales Funnel

Moving people through the funnel can be a challenge. A stratagem to keep in mind is that your goal should be to solve the “problems” of your customers, or potentially make them aware of a problem they didn’t even know existed. Start by creating content that attracts your prospect’s attention, followed by offering an irresistible solution to the problem. All you have to do then is watch the magic happen.

Truthfully, that is easier said than done, but if you follow the four stages of a prospective customer’s mindset, you will reach your goal sooner than later. The different stages can be easily explained using the AIDA (Awareness, Interest, Decision, Action) strategy. To understand what moves a buying decision, we have to take a closer look at each stage and the approach it requires.

Awareness

To end up with a strong bond with your prospect, you have to gain attention first. Depending on how they found you (organic search results, recommendations, advertisements, or just pure luck), people will put different amounts of trust in your business. If you are lucky and all circumstances fall perfectly into place, a prospect turns into a customer immediately. More often though, the awareness stage does exactly what it sounds like; it creates awareness of your business and your products or services. At this point, all you are trying to do is lead prospects into the next stage, which will make them return for more.

Interest

Once a potential customer is aware of you, you need to build their interest. In this stage potential customers are interested in what you have to offer and are doing research or comparison. It is the perfect time to show off authority in your field and support them with helpful content that does not yet try to sell to them. Make sure your message stays consistent throughout the whole process and do not try to push too hard from the beginning. The interest stage should only lead them to be able to make an informed decision.

Decision

For the most part, the majority of people do not like making decisions and, therefore, getting a prospect to make a buying decision is not an easy feat. At this stage, you have to bring on your A-game and make them an offer they can’t refuse. Whether this means offering free premium shipping, a discount code, or a free month of your services is totally up to you; you just have to make sure that your potential customer wants to take advantage of it. Showcasing positive reviews or social proof is another powerful way that you can get people to take action.

 Action

Now your prospect turns into a customer. When he or she purchases your product or takes advantage of your service, that customer becomes part of your business’s ecosystem. But just because they reached the final stage of the sales funnel and the AIDA principle doesn’t mean your work is all said and done. Starting to build a long-term relationship with someone who already trusts your company is easier than starting the sales funnel all over again with a new prospect.

Sales Funnel Management

At this point, you should understand why sales funnel management is so important. Even the best prospects can get lost along the way if expectations aren’t met. It takes time to build a sales funnel that represents what your audience is looking for. The best way to optimize a sales funnel is to start with the results and work your way up. Another point of interest is the timing when people move from one point to the next within the funnel. This can help you find out where, when, and why you’re losing potential customers.

Too slow: New leads are nine times more likely to convert if someone follows up within the first five minutes. On the other hand, a lead is 21 times less likely to turn into a sale after 30 minutes have passed. To react within tight response times like that, you need to implement sales funnel management automation.

Too impatient: It can be tempting to dump a lead that isn’t converting right away and move on to the next. You should ask yourself the question if you are patient enough and if you are following up as much as you should. A marketing automation funnel also helps to stay in touch with the prospect over time.

Too fast: Instead of asking people to buy from you right away, you should cultivate them over time. If you adjust your sales approach to the different stages, you don’t just avoid chasing them away; you also find out what is working and what is a waste of your time.

How can you optimize your conversion rate?

There are countless ways you can improve your conversion rate and turn a “no, thank you” into a “yes, please.” In sales, a no often simply means “not until later” or “try again, I’m just not totally convinced yet.” Any time you encounter problems like that, you can use one or multiple of the following, mostly automated sales techniques, to reach your goals.

Target your Audience

To lead people into your sales funnel, you have to put the right content in front of your prospects. How and where you do that depends on your target audience. Be creative with your content, but make sure it mimics your offer and the call-to-action you are using. Customer relationship management (CRM) can help you track interactions with current and future customers.

Build a Landing Page

A landing page offers content that addresses a specific problem, ideally with a single call-to-action, and should steer your visitor towards becoming a customer. A/B testing your landing pages will help you figure out what your audience responds to best and what language, imagery, or layouts can help you improve conversion rates. Experienced hosting companies like 101domain can help you along the way. Additionally, you can use pay-per-click campaigns to drive traffic to your landing page and contact forms to gain subscribers to a mailing list.

Targeting Soft Conversions

When considering which page to use as a landing page, you can increase your conversion rate by bringing leads to an on-site resource to gain a “soft conversion.”

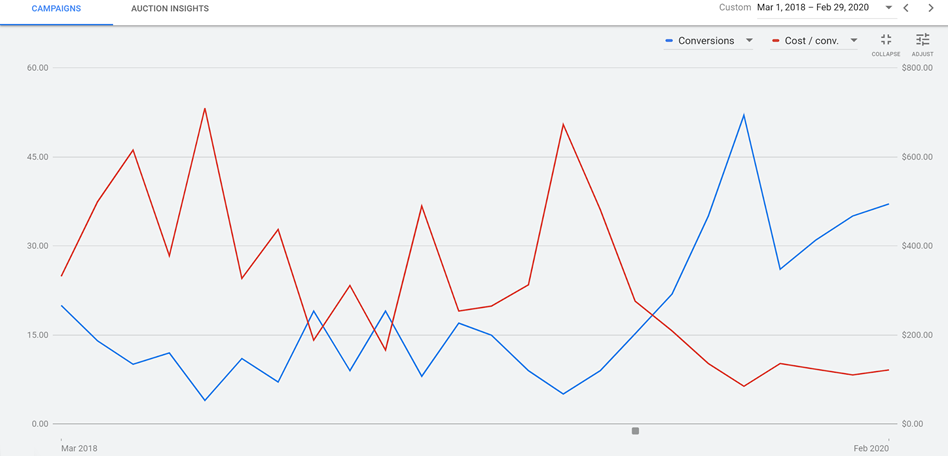
 To illustrate the importance of a good landing page and soft conversions, consider the following data:

RED: Cost per conversion BLUE: Number of conversions X-AXIS: Time (Screenshot supplied by Howard Ahmanson)

The initial strategy represented in this graph was to take visitors directly to a sales page. This resulted in a very low number of conversions, about a rate of 1%,, which in turn drove the cost per conversion way up. Later, the landing page was switched to an on-site resource, such as  a form fill of “get the free retirement planning guide.” This prompted a few soft conversions, or in other words email addresses. Upon doing this, the average number of conversions per month increased from about 10 to between 30 and 45, which in turn dropped the total cost per conversion from a median of about $400 to about $100. This is an approximately 300% increase in conversions at 50% of the cost.

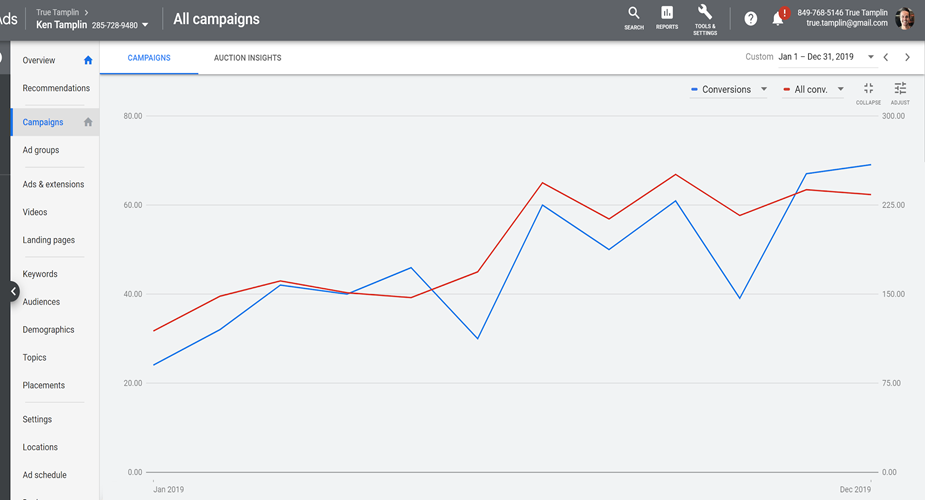
But how does increased conversions translate in terms of sales numbers? To see an example of this, consider the data from the Ken Tamplin Vocal Academy:

RED: Total conversion, including soft conversions
BLUE: Sales conversions
X-AXIS: Time

When running ads for Ken, the initial strategy was to bring prospects directly to a sales page. Later, this was switched out for a “Yes! I want Ken’s free lessons!” page.

This led to an increase in the number of soft conversions, which led to a tightly correlated increase in sales. There was an increase from around 30 conversions per month up to over 225, which is an increase of 750%.

Create an Email Drip Campaign

Email drip campaigns are used to send a pre-written set of emails to subscribers or customers over time. You can use those campaigns to educate the receiver as well as make them aware of sales or offers. Last but not least, don’t forget about existing customers. This technique is ideal for building up loyalty and making them feel like part of the family.