The importance of domain knowledge – A healthcare data science perspective

Data scientists have (and need) many skills. They are frequently either former academic researchers or software engineers, with knowledge and skills in statistics, programming, machine learning, and many other domains of mathematics and computer science. These skills are general and allow data scientists to offer valuable services to almost any field. However, data scientists in some cases find themselves in industries they have relatively little knowledge of.

This is especially true in the healthcare field. In healthcare, there is an enormous amount of important clinical knowledge that might be relevant to a data scientist. It is unreasonable to expect a data scientist to not only have all of the skills typically required of a data scientist, but to also have all of the knowledge a medical professional may have.

Why is domain knowledge necessary?

This lack of domain knowledge, while perfectly understandable, can be a major barrier to healthcare data scientists. For one thing, it’s difficult to come up with project ideas in a domain that you don’t know much about. It can also be difficult to determine the type of data that may be helpful for a project – if you want to build a model to predict a health outcome (for example, whether a patient has or is likely to develop a gastrointestinal bleed), you need to know what types of variables might be related to this outcome so you can make sure to gather the right data.

Knowing the domain is useful not only for figuring out projects and how to approach them, but also for having rules of thumb for sanity checks on the data. Knowing how data is captured (is it hand-entered? Is it from machines that can give false readings for any number of reasons?) can help a data scientist with data cleaning and from going too far down the wrong path. It can also inform what true outliers are and which values might just be due to measurement error.

Often the most challenging part of building a machine learning model is feature engineering. Understanding clinical variables and how they relate to a health outcome is extremely important for this. Is a long history of high blood pressure important for predicting heart problems, or is only very recent history? How long a time horizon is considered ‘long’ or ‘short’ in this context? What other variables might be related to this health outcome? Knowing the domain can help direct the data exploration and greatly speed (and enhance) the feature engineering process.

Once features are generated, knowing what relationships between variables are plausible helps for basic sanity checks. If you’re finding the best predictor of hospitalization is the patient’s eye color, this might indicate an issue with your code. Being able to glance at the outcome of a model and determine if they make sense goes a long way for quality assurance of any analytical work.

Finally, one of the biggest reasons a strong understanding of the data is important is because you have to interpret the results of analyses and modeling work. Knowing what results are important and which are trivial is important for the presentation and communication of results. An analysis that determines there is a strong relationship between age and mortality is probably well-known to clinicians, while weaker but more surprising associations may be of more use. It’s also important to know what results are actionable. An analysis that finds that patients who are elderly are likely to end up hospitalized is less useful for trying to determine the best way to reduce hospitalizations (at least, without further context).

How do you get domain knowledge?

In some industries, such as tech, it’s fairly easy and straightforward to see an end-user’s prospective. By simply viewing a website or piece of software from the user’s point of view, a data scientist can gain a lot of the needed context and background knowledge needed to understand where their data is coming from and how their model output is being used. In the healthcare industry, it’s more difficult. A data scientist can’t easily choose to go through med school or the experience of being treated for a chronic illness. This means there is no easy single answer to where to gain domain knowledge. However, there are many avenues available.

Reading literature and attending presentations can boost one’s domain knowledge. However, it’s often difficult to find resources that are penetrable for someone who is not already a clinician. To gain deep knowledge, one needs to be steeped in the topic. One important avenue to doing this is through the establishment of good relationships with clinicians. Clinicians can be powerful allies that can help point you in the right direction for understanding your data, and simply by chatting with them you can gain important insights. They can also help you visit the clinics or practices to interact with the people that perform the procedures or even watch the procedures being done. At Fresenius Medical Care, where I work, members of my team regularly visit clinics. I have in the last year visited one of our dialysis clinics, a nephrology practice, and a vascular care unit. These experiences have been invaluable to me in developing my knowledge of the treatment of chronic illnesses.

In conclusion, it is crucial for data scientists to acquire basic familiarity in the field they are working in and in being part of collaborative teams that include people who are technically knowledgeable in the field they work in. This said, acquiring even an essential understanding (such as “Medicine 101”) may go a long way for the data scientists in being able to become self-sufficient in essential feature selection and design.


Process Mining: Innovative Analyse von Datenspuren für Audit und Forensik

Step-by-Step:

Neue Möglichkeiten zur Aufdeckung von Compliance-Verstößen mit Process Analytics

Im Zuge der fortschreitenden Digitalisierung findet derzeit ein enormer Umbruch der alltäglichen Arbeit hin zur lückenlosen Erfassung aller Arbeitsschritte in IT-Systemen statt. Darüber hinaus sehen sich Unternehmen mit zunehmend verschärften Regulierungsanforderungen an ihre IT-Systeme konfrontiert.

Der unaufhaltsame Trend hin zur vernetzten Welt („Internet of Things“) wird die Möglichkeiten der Prozesstransparenz noch weiter vergrößern – jedoch werden bereits jetzt viele Prozesse im Unternehmensbereich über ein oder mehrere IT-Systeme erfasst. Jeder Mitarbeiter, aber auch jeder automatisiert ablaufende Prozess hinterlässt viele Datenspuren in IT-Backend-Systemen, aus denen Prozesse rückwirkend oder in Echtzeit nachgebildet werden können. Diese umfassen sowohl offensichtliche Prozesse, wie etwa den Eintrag einer erfassten Bestellung oder Rechnung, als auch teilweise verborgene Prozesse, wie beispielsweise die Änderung bestimmter Einträge oder Löschung dieser Geschäftsobjekte. 


english-flagRead this article in English:
“Process Analytics – Data Analysis for Process Audit & Improvement”


1 Das Verständnis von Process Analytics

Process Analytics ist eine datengetriebene Methodik der Ist-Prozessanalyse, die ihren Ursprung in der Forensik hat. Im Kern des dieser am Zweck orientierten Analyse steht das sogenannte Process Mining, eine auf die Rekonstruktion von Prozessen ausgerichtetes Data Mining. Im Zuge der steigenden Bedeutung der Computerkriminalität wurde es notwendig, die Datenspuren, die potenzielle Kriminelle in IT-Systemen hinterließen, zu identifizieren und zu analysieren, um das Geschehen so gut wie möglich zu rekonstruieren.

Mit dem Trend hin zu Big Data Analytics hat Process Analytics nicht nur neue Datengrundlagen erhalten, sondern ist als Analysemethode weiterentwickelt worden. Zudem ermöglicht die Visualisierung dem Analysten oder Berichtsempfänger ein tief gehendes Verständnis auch komplexerer Geschäftsprozesse.

Während in der konventionellen Prozessanalyse vor allem Mitarbeiterinterviews und Beobachtung der Mitarbeiter am Schreibtisch durchgeführt werden, um tatsächlich gelebte Prozesse zu ermitteln, ist Process Analytics eine führende Methode, die rein faktenbasiert und damit objektiv an die Prozesse herangeht. Befragt werden nicht die Mitarbeiter, sondern die IT-Systeme, die nicht nur alle erfassten Geschäftsobjekte tabellenorientiert abspeichern, sondern auch im Hintergrund – unsichtbar für die Anwender – jegliche Änderungsvorgänge z. B. an Bestellungen, Rechnungen oder Kundenaufträgen lückenlos mit einem Zeitstempel (oft Sekunden- oder Millisekunden-genau) protokollieren.

2 Die richtige Auswahl der zu betrachtenden Prozesse

Heute arbeitet nahezu jedes Unternehmen mit mindestens einem ERP-System. Da häufig noch weitere Systeme eingesetzt werden, lässt sich klar herausstellen, welche Prozesse nicht analysiert werden können: Solche Prozesse, die noch ausschließlich auf Papier und im Kopf der Mitarbeiter ablaufen, also typische Entscheiderprozesse auf oberster, strategischer Ebene, die nicht in IT-Systemen erfasst und dementsprechend nicht ausgewertet werden können. Operative Prozesse werden hingegen in der Regel nahezu lückenlos in IT-Systemen erfasst und operative Entscheidungen protokolliert.

Zu den operativen Prozessen, die mit Process Analytics sehr gut rekonstruiert und analysiert werden können und gleichermaßen aus Compliance-Sicht von höchstem Interesse sind, gehören beispielsweise Prozesse der:

  • Beschaffung
  • Logistik / Transport
  • Vertriebs-/Auftragsvorgänge
  • Gewährleistungsabwicklung
  • Schadensregulierung
  • Kreditgewährung

Process Analytics bzw. Process Mining ermöglicht unabhängig von der Branche und dem Fachbereich die größtmögliche Transparenz über alle operativen Geschäftsprozesse. Für die Audit-Analyse ist dabei zu beachten, dass jeder Prozess separat betrachtet werden sollte, denn die Rekonstruktion erfolgt anhand von Vorgangsnummern, die je nach Prozess unterschiedlich sein können. Typische Vorgangsnummern sind beispielsweise Bestell-, Auftrags-, Kunden- oder Materialnummern.

3 Auswahl der relevanten IT-Systeme

Grundsätzlich sollte jedes im Unternehmen eingesetzte IT-System hinsichtlich der Relevanz für den zu analysierenden Prozess untersucht werden. Für die Analyse der Einkaufsprozesse ist in der Regel nur das ERP-System (z. B. SAP ERP) von Bedeutung. Einige Unternehmen verfügen jedoch über ein separates System der Buchhaltung (z.B. DATEV) oder ein CRM/SRM (z. B. von Microsoft), die dann ebenfalls einzubeziehen sind.

Bei anderen Prozessen können außer dem ERP-/CRM-System auch Daten aus anderen IT-Systemen eine entscheidende Rolle spielen. Gelegentlich sollten auch externe Daten integriert werden, wenn diese aus extern gelagerten Datenquellen wichtige Prozessinformationen liefern – beispielsweise Daten aus der Logistik.

4 Datenaufbereitung

Vor der datengetriebenen Prozessanalyse müssen die Daten, die auf Prozessaktivitäten direkt oder indirekt hindeuten, in den Datenquellen identifiziert, extrahiert und aufbereitet werden. Die Daten liegen in Datenbanktabellen und Server-Logs vor und werden über ein Data Warehousing Verfahren zusammengeführt und in ein Prozessprotokoll (unter den Process Minern i.d.R. als Event Log bezeichnet) umformuliert.

Das Prozessprotokoll ist in der Regel eine sehr große und breite Tabelle, die neben den eigentlichen Prozessaktivitäten auch Parameter enthält, über die sich Prozesse filtern lassen, beispielsweise Informationen über Produktgruppen, Preise, Mengen, Volumen, Fachbereiche oder Mitarbeitergruppen.

5 Prüfungsdurchführung

Die eigentliche Prüfung erfolgt visuell und somit intuitiv vor einem Prozessflussdiagramm, das die tatsächlichen Prozesse so darstellt, wie sie aus den IT-Systemen extrahiert werden konnten.

Process Mining – Beispielhafter Process Flow mit Fluxicon Disco (www.fluxicon.com)

Das durch die Datenaufbereitung erstellte Prozessprotokoll wird in eine Datenvisualisierungssoftware geladen, die dieses Protokoll über die Vorgangsnummern und Zeitstempel in einem grafischen Prozessnetzwerk darstellt. Die Prozessflüsse werden also nicht modelliert, wie es bei den Soll-Prozessen der Fall ist, sondern es „sprechen“ die IT-Systeme.

Die Prozessflüsse werden visuell dargestellt und statistisch ausgewertet, so dass konkrete Aussagen über die im Hinblick auf Compliance relevante Prozess-Performance und -Risiken getroffen werden können.

6 Abweichung von Soll-Prozessen

Die Möglichkeit des intuitiven Filterns der Prozessdarstellung ermöglicht auch die gezielte Analyse von Ist-Prozessen, die von den Soll-Prozessverläufen abweichen.

Die Abweichung der Ist-Prozesse von den Soll-Prozessen wird in der Regel selbst von IT-affinen Führungskräften unterschätzt – mit Process Analytics lassen sich nun alle Abweichungen und die generelle Prozesskomplexität auf ihren Daten basierend untersuchen.

6 Erkennung von Prozesskontrollverletzungen

Die Implementierung von Prozesskontrollen sind Bestandteil eines professionellen Internen Kontrollsystems (IKS), die tatsächliche Einhaltung dieser Kontrollen in der Praxis ist jedoch häufig nicht untersucht oder belegt. Process Analytics ermöglicht hier die Umgehung des Vier-Augen-Prinzips bzw. die Aufdeckung von Funktionstrennungskonflikten. Zudem werden auch die bewusste Außerkraftsetzung von internen Kontrollmechanismen durch leitende Mitarbeiter oder die falsche Konfiguration der IT-Systeme deutlich sichtbar.

7 Erkennung von bisher unbekannten Verhaltensmustern

Nach der Prüfung der Einhaltung bestehender Kontrollen, also bekannter Muster, wird Process Analytics weiterhin zur Neuerkennung von bislang unbekannten Mustern in Prozessnetzwerken, die auf Risiken oder gar konkrete Betrugsfälle hindeuten und aufgrund ihrer bisherigen Unbekanntheit von keiner Kontrolle erfasst werden, genutzt. Insbesondere durch die – wie bereits erwähnt – häufig unterschätzte Komplexität der alltäglichen Prozessverflechtung fallen erst durch diese Analyse Fraud-Szenarien auf, die vorher nicht denkbar gewesen wären. An dieser Stelle erweitert sich die Vorgehensweise des Process Mining um die Methoden des maschinellen Lernens (Machine Learning), typischerweise unter Einsatz von Clustering, Klassifikation und Regression.

8 Berichterstattung – auch in Echtzeit möglich

Als hocheffektive Audit-Analyse ist Process Analytics bereits als iterative Prüfung in Abständen von drei bis zwölf Monaten ausreichend. Nach der erstmaligen Durchführung werden bereits Compliance-Verstöße, schwache oder gar unwirksame Kontrollen und gegebenenfalls sogar Betrugsfälle zuverlässig erkannt. Die Erkenntnisse können im Nachgang dazu genutzt werden, um die Schwachstellen abzustellen. Eine weitere Durchführung der Analyse nach einer Karenzzeit ermöglicht dann die Beurteilung der Wirksamkeit getroffener Maßnahmen.

In einigen Anwendungsszenarien ist auch die nahtlose Anbindung der Prozessanalyse mit visuellem Dashboard an die IT-Systemlandschaft zu empfehlen, so dass Prozesse in nahezu Echtzeit abgebildet werden können. Diese Anbindung kann zudem um Benachrichtigungssysteme ergänzt werden, so dass Entscheider und Revisoren via SMS oder E-Mail automatisiert über aktuellste Prozessverstöße informiert werden. Process Analytics wird somit zum Realtime Analytics.

Fazit

Process Analytics ist im Zuge der Digitalisieurng die hocheffektive Methodik aus dem Bereich der Big Data Analyse zur Aufdeckung Compliance-relevanter Tatbestände im gesamten Unternehmensbereich und auch eine visuelle Unterstützung bei der forensischen Datenanalyse.


Data Science Knowledge Stack – Was ein Data Scientist können muss

Was muss ein Data Scientist können? Diese Frage wurde bereits häufig gestellt und auch häufig beantwortet. In der Tat ist man sich mittlerweile recht einig darüber, welche Aufgaben ein Data Scientist für Aufgaben übernehmen kann und welche Fähigkeiten dafür notwendig sind. Ich möchte versuchen, diesen Konsens in eine Grafik zu bringen: Ein Schichten-Modell, ähnlich des OSI-Layer-Modells (welches übrigens auch jeder Data Scientist kennen sollte).
Ich gebe Einführungs-Seminare in Data Science für Kaufleute und Ingenieure und bei der Erläuterung, was wir in den Seminaren gemeinsam theoretisch und mit praxisnahen Übungen erarbeiten müssen, bin ich auf die Idee für dieses Schichten-Modell gekommen. Denn bei meinen Seminaren fängt es mit der Problemstellung bereits an, ich gebe nämlich Seminare für Data Science für Business Analytics mit Python. Also nicht beispielsweise für medizinische Analysen und auch nicht mit R oder Julia. Ich vermittle also nicht irgendein Data Science, sondern eine ganz bestimmte Richtung.

Ein Data Scientist muss bei jedem Data Science Vorhaben Probleme auf unterschiedlichsten Ebenen bewältigen, beispielsweise klappt der Datenzugriff nicht wie geplant oder die Daten haben eine andere Struktur als erwartet. Ein Data Scientist kann Stunden damit verbringen, seinen eigenen Quellcode zu debuggen oder sich in neue Data Science Pakete für seine ausgewählte Programmiersprache einzuarbeiten. Auch müssen die richtigen Algorithmen zur Datenauswertung ausgewählt, richtig parametrisiert und getestet werden, manchmal stellt sich dabei heraus, dass die ausgewählten Methoden nicht die optimalen waren. Letztendlich soll ein Mehrwert für den Fachbereich generiert werden und auch auf dieser Ebene wird ein Data Scientist vor besondere Herausforderungen gestellt.


english-flagRead this article in English:
“Data Science Knowledge Stack – Abstraction of the Data Scientist Skillset”


Data Science Knowledge Stack

Mit dem Data Science Knowledge Stack möchte ich einen strukturierten Einblick in die Aufgaben und Herausforderungen eines Data Scientists geben. Die Schichten des Stapels stellen zudem einen bidirektionalen Fluss dar, der von oben nach unten und von unten nach oben verläuft, denn Data Science als Disziplin ist ebenfalls bidirektional: Wir versuchen gestellte Fragen mit Daten zu beantworten oder wir schauen, welche Potenziale in den Daten liegen, um bisher nicht gestellte Fragen zu beantworten.

Der Data Science Knowledge Stack besteht aus sechs Schichten:

Database Technology Knowledge

Ein Data Scientist arbeitet im Schwerpunkt mit Daten und die liegen selten direkt in einer CSV-Datei strukturiert vor, sondern in der Regel in einer oder in mehreren Datenbanken, die ihren eigenen Regeln unterliegen. Insbesondere Geschäftsdaten, beispielsweise aus dem ERP- oder CRM-System, liegen in relationalen Datenbanken vor, oftmals von Microsoft, Oracle, SAP oder eine Open-Source-Alternative. Ein guter Data Scientist beherrscht nicht nur die Structured Query Language (SQL), sondern ist sich auch der Bedeutung relationaler Beziehungen bewusst, kennt also auch das Prinzip der Normalisierung.

Andere Arten von Datenbanken, sogenannte NoSQL-Datenbanken (Not only SQL)  beruhen auf Dateiformaten, einer Spalten- oder einer Graphenorientiertheit, wie beispielsweise MongoDB, Cassandra oder GraphDB. Einige dieser Datenbanken verwenden zum Datenzugriff eigene Programmiersprachen (z. B. JavaScript bei MongoDB oder die graphenorientierte Datenbank Neo4J hat eine eigene Sprache namens Cypher). Manche dieser Datenbanken bieten einen alternativen Zugriff über SQL (z. B. Hive für Hadoop).

Ein Data Scientist muss mit unterschiedlichen Datenbanksystemen zurechtkommen und mindestens SQL – den Quasi-Standard für Datenverarbeitung – sehr gut beherrschen.

Data Access & Transformation Knowledge

Liegen Daten in einer Datenbank vor, können Data Scientists einfache (und auch nicht so einfache) Analysen bereits direkt auf der Datenbank ausführen. Doch wie bekommen wir die Daten in unsere speziellen Analyse-Tools? Hierfür muss ein Data Scientist wissen, wie Daten aus der Datenbank exportiert werden können. Für einmalige Aktionen kann ein Export als CSV-Datei reichen, doch welche Trennzeichen und Textqualifier können verwendet werden? Eventuell ist der Export zu groß, so dass die Datei gesplittet werden muss.
Soll eine direkte und synchrone Datenanbindung zwischen dem Analyse-Tool und der Datenbank bestehen, kommen Schnittstellen wie REST, ODBC oder JDBC ins Spiel. Manchmal muss auch eine Socket-Verbindung hergestellt werden und das Prinzip einer Client-Server-Architektur sollte bekannt sein. Auch mit synchronen und asynchronen Verschlüsselungsverfahren sollte ein Data Scientist vertraut sein, denn nicht selten wird mit vertraulichen Daten gearbeitet und ein Mindeststandard an Sicherheit ist zumindest bei geschäftlichen Anwendungen stets einzuhalten.

Viele Daten liegen nicht strukturiert in einer Datenbank vor, sondern sind sogenannte unstrukturierte oder semi-strukturierte Daten aus Dokumenten oder aus Internetquellen. Auch hier haben wir es mit Schnittstellen zutun, ein häufiger Einstieg für Data Scientists stellt beispielsweise die Twitter-API dar. Manchmal wollen wir Daten in nahezu Echtzeit streamen, beispielsweise Maschinendaten. Dies kann recht anspruchsvoll sein, so das Data Streaming beinahe eine eigene Disziplin darstellt, mit der ein Data Scientist schnell in Berührung kommen kann.

Programming Language Knowledge

Programmiersprachen sind für Data Scientists Werkzeuge, um Daten zu verarbeiten und die Verarbeitung zu automatisieren. Data Scientists sind in der Regel keine richtigen Software-Entwickler, sie müssen sich nicht um Software-Sicherheit oder -Ergonomie kümmern. Ein gewisses Basiswissen über Software-Architekturen hilft jedoch oftmals, denn immerhin sollen manche Data Science Programme in eine IT-Landschaft integriert werden. Unverzichtbar ist hingegen das Verständnis für objektorientierte Programmierung und die gute Kenntnis der Syntax der ausgewählten Programmiersprachen, zumal nicht jede Programmiersprache für alle Vorhaben die sinnvollste ist.

Auf dem Level der Programmiersprache gibt es beim Arbeitsalltag eines Data Scientists bereits viele Fallstricke, die in der Programmiersprache selbst begründet sind, denn jede hat ihre eigenen Tücken und Details entscheiden darüber, ob eine Analyse richtig oder falsch abläuft: Beispielsweise ob Datenobjekte als Kopie oder als Referenz übergeben oder wie NULL-Werte behandelt werden.

Data Science Tool & Library Knowledge

Hat ein Data Scientist seine Daten erstmal in sein favorisiertes Tool geladen, beispielsweise in eines von IBM, SAS oder in eine Open-Source-Alternative wie Octave, fängt seine Kernarbeit gerade erst an. Diese Tools sind allerdings eher nicht selbsterklärend und auch deshalb gibt es ein vielfältiges Zertifizierungsangebot für diverse Data Science Tools. Viele (wenn nicht die meisten) Data Scientists arbeiten überwiegend direkt mit einer Programmiersprache, doch reicht diese alleine nicht aus, um effektiv statistische Datenanalysen oder Machine Learning zu betreiben: Wir verwenden Data Science Bibliotheken, also Pakete (Packages), die uns Datenstrukturen und Methoden als Vorgabe bereitstellen und die Programmiersprache somit erweitern, damit allerdings oftmals auch neue Tücken erzeugen. Eine solche Bibliothek, beispielsweise Scikit-Learn für Python, ist eine in der Programmiersprache umgesetzte Methodensammlung und somit ein Data Science Tool. Die Verwendung derartiger Bibliotheken will jedoch gelernt sein und erfordert für die zuverlässige Anwendung daher Einarbeitung und Praxiserfahrung.

Geht es um Big Data Analytics, also die Analyse von besonders großen Daten, betreten wir das Feld von Distributed Computing (Verteiltes Rechnen). Tools (bzw. Frameworks) wie Apache Hadoop, Apache Spark oder Apache Flink ermöglichen es, Daten zeitlich parallel auf mehren Servern zu verarbeiten und auszuwerten. Auch stellen diese Tools wiederum eigene Bibliotheken bereit, für Machine Learning z. B. Mahout, MLlib und FlinkML.

Data Science Method Knowledge

Ein Data Scientist ist nicht einfach nur ein Bediener von Tools, sondern er nutzt die Tools, um seine Analyse-Methoden auf Daten anzuwenden, die er für die festgelegten Ziele ausgewählt hat. Diese Analyse-Methoden sind beispielweise Auswertungen der beschreibenden Statistik, Schätzverfahren oder Hypothesen-Tests. Etwas mathematischer sind Verfahren des maschinellen Lernens zum Data Mining, beispielsweise Clusterung oder Dimensionsreduktion oder mehr in Richtung automatisierter Entscheidungsfindung durch Klassifikation oder Regression.

Maschinelle Lernverfahren funktionieren in der Regel nicht auf Anhieb, sie müssen unter Einsatz von Optimierungsverfahren, wie der Gradientenmethode, verbessert werden. Ein Data Scientist muss Unter- und Überanpassung erkennen können und er muss beweisen, dass die Vorhersageergebnisse für den geplanten Einsatz akkurat genug sind.

Spezielle Anwendungen bedingen spezielles Wissen, was beispielsweise für die Themengebiete der Bilderkennung (Visual Computing) oder der Verarbeitung von menschlicher Sprache (Natural Language Processiong) zutrifft. Spätestens an dieser Stelle öffnen wir die Tür zum Deep Learning.

Fachexpertise

Data Science ist kein Selbstzweck, sondern eine Disziplin, die Fragen aus anderen Fachgebieten mit Daten beantworten möchte. Aus diesem Grund ist Data Science so vielfältig. Betriebswirtschaftler brauchen Data Scientists, um Finanztransaktionen zu analysieren, beispielsweise um Betrugsszenarien zu erkennen oder um die Kundenbedürfnisse besser zu verstehen oder aber, um Lieferketten zu optimieren. Naturwissenschaftler wie Geologen, Biologen oder Experimental-Physiker nutzen ebenfalls Data Science, um ihre Beobachtungen mit dem Ziel der Erkenntnisgewinnung zu machen. Ingenieure möchten die Situation und Zusammenhänge von Maschinenanlagen oder Fahrzeugen besser verstehen und Mediziner interessieren sich für die bessere Diagnostik und Medikation bei ihren Patienten.

Damit ein Data Scientist einen bestimmten Fachbereich mit seinem Wissen über Daten, Tools und Analyse-Methoden ergebnisorientiert unterstützen kann, benötigt er selbst ein Mindestmaß an der entsprechenden Fachexpertise. Wer Analysen für Kaufleute, Ingenieure, Naturwissenschaftler, Mediziner, Juristen oder andere Interessenten machen möchte, muss eben jene Leute auch fachlich verstehen können.

Engere Data Science Definition

Während die Data Science Pioniere längst hochgradig spezialisierte Teams aufgebaut haben, suchen beispielsweise kleinere Unternehmen eher den Data Science Allrounder, der vom Zugriff auf die Datenbank bis hin zur Implementierung der analytischen Anwendung das volle Aufgabenspektrum unter Abstrichen beim Spezialwissen übernehmen kann. Unternehmen mit spezialisierten Daten-Experten unterscheiden jedoch längst in Data Scientists, Data Engineers und Business Analysts. Die Definition für Data Science und die Abgrenzung der Fähigkeiten, die ein Data Scientist haben sollte, schwankt daher zwischen der breiteren und einer engeren Abgrenzung.

Die engere Betrachtung sieht vor, dass ein Data Engineer die Datenbereitstellung übernimmt, der Data Scientist diese in seine Tools lädt und gemeinsam mit den Kollegen aus dem Fachbereich die Datenanalyse betreibt. Demnach bräuchte ein Data Scientist kein Wissen über Datenbanken oder APIs und auch die Fachexpertise wäre nicht notwendig…

In der beruflichen Praxis sieht Data Science meiner Erfahrung nach so nicht aus, das Aufgabenspektrum umfasst mehr als nur den Kernbereich. Dieser Irrtum entsteht in Data Science Kursen und auch in Seminaren – würde ich nicht oft genug auf das Gesamtbild hinweisen. In Kursen und Seminaren, die Data Science als Disziplin vermitteln wollen, wird sich selbstverständlich auf den Kernbereich fokussiert: Programmierung, Tools und Methoden aus der Mathematik & Statistik.

Is Data Science the new Statistics?

Table of Contents

1 Introduction

2 Emerging of Data Science

3 Big data technologies

4 Two data worlds: Predictive vs inferential statistics

5 How to study data science

6 Conclusions

7 References

Introduction

As a student of Statistics and the winner of Data Science Scholarship I am often surrounded by computer scientists, mathematicians, physicists and of course statisticians. During conversation, I was asked questions such as “So what actually do I do? What is Data Science?”. These are some very difficult questions and as like you will see during reading this document many before me tried to answer those questions. There is a dispute between statisticians and computer scientists what is the origin of data science and who should teach it. According to the Institute of Mathematical Statistics in the: “The IMS presidential address: let us own data science” we can find a simple recipe for data scientist. [1]

“Putting the traits of Turner and Carver together gives a good portrait of a data scientist:

  • Statistics (S)
  • Domain/Science knowledge (D)
  • Computing (C)
  • Collaboration/teamwork (C)
  • Communication to outsiders (C)

That is, data science = SDCCC = S DC3

However, despite all the challenges that I will need to overcome in answering those questions I will try to do it. I will refer to ideas from several reputable sources, in which I will also tell you: what is in the data science that I am really fascinated about? What is magical in this creation of statistics and computer science that I am drawn to?

Emerging of Data Science

On Tuesday, the 8th of September 2015, University of Michigan announced the 100 million dollars “Data Science Initiative” (DSI), hired 35 new faculty members. On the DSI website we can read about this initiative:

“This coupling of scientific discovery and practice involves the collection, management, processing, analysis, visualisation, and interpretation of vast amounts of heterogeneous data associated with a diverse array of scientific, translational and interdisciplinary applications”2

But that sounds like a bread and butter for statisticians. So, is it really a new creation or is it something that exists for many years but it didn’t sound so sexy as data science? In the article written by Karl Broman, (the University of Wisconsin) we can read:

“When physicists do mathematics, they’re don’t say they’re doing “number science”. They’re doing math. If you’re analyzing data, you’re doing statistics. You can call it data science or informatics or analytics or whatever, but it ‘s still statistics. If you say that one kind of data analysis is statistics and another kind is not, you’re not allowing innovation. We need to define the field broadly. You may not like what some statisticians do. You may feel they don’t share your values. They may embarrass you. But that shouldn’t lead us to abandon the term “statistics”.

Reading the definition of data science on the Data Science Association’s “Professional Code of Conduct”:

“Data scientist means a professional who uses scientific methods to liberate and create meaning from raw data”

These sound like K. Browman maybe right. Maybe I should go on MSc Statistics like many before me did. Maybe Data Science is simply a new sexy name for statistician only data is big, technology more advanced rather than it used to be so you need to have programming skills to handle the data. Maybe let say loudly data science is a modern version of statistics? But maybe not? Because we can also find statements like the following:

“Statistics is the least important part of data science”. [3]

Further, we can read:

“There ‘s so, much that goes on with data that is about computing, not statistics. I do think it would be fair to consider statistics (which includes sampling, experimental design, and data collection as well as data analysis (which itself includes model building, visualization, and model checking as well as inference)) as a subset of data science. . . .”.[3]

So maybe people from computer science are right. Maybe I should go and study programming and forget about expanding my knowledge in statistics? After all, we all know that computer science always had much bigger funding and having MSc computer science was always like a magic star for employers. What should I do? Let me research further.

Big data technologies

Is the data size important to distinguish between data science and statistics? Going back to the “Let us own data science” article we can read that a statistician, Hollerith, invented the punched card reader to allow e cient compilation of a US census, the first elements of machine learning. So, no, machine learning is not an invention of computer scientists. It was well known for statistician for decades already. What about different techniques used in DOE (Design of Experiments) or sampling methods to decrease the sample size. If the data used by statisticians would be only small they wouldn’t have to discover methods such PCA (Principle component analysis) or dimensionality reduction techniques. So, no, data can be big and/or small for statisticians, so what is the difference between data science and statistics and what department should I choose?

When I spoke to computer scientists they try to convince me to choose computer science department. Their reasons being that there are many different programmes that I need to know to deal with large datasets. For instance: Java, Hadoop, SQL, Python, and much more. Moreover, programming can only be taught to the best standard through computer science courses Is it true? Can’t we do the same calculations using statistical software such as R, SAS or even Matlab? But on the other hand, doesn’t the newest technology always work faster? And if so, wouldn’t be better to use the newest technology when we program and write loops?

But, I don’t want to underestimate the effort made by statisticians and data analyst over last 50 years in developing statistical programmes. Their efforts have resulted in the emergence of today’s technology. Early statistical packages such as SPSS or Minitab (from 1960’s) allowed to develop more advanced programmes having roots in mini computer era such as STATA or my favourite R which in turn allowed progress to advanced technology even further and create Python, Hadoop, SQL and so on. Becker and Chambers (with S) and later Ihaka, Gentleman, and members of the R Core team (with R) worked on developing the statistical software. These names should be convincing about how powerful statistical programming languages can be. Many operations that we can do in Hadoop or SQL we can also do easily in R.

Two data worlds: Predictive vs inferential statistics

So maybe Data Science is a creature merged by statisticians working on computer science department? Maybe there are two different approaches to statistics: mathematical statistics and computer science statistics and the computer science statisticians are data scientists because according to Yanir Seroussi in his blog:

“A successful data scientist needs to be able to “become one with the data” by exploring it and applying rigorous statistical analysis (right-hand side of the continuum). But good data scientists also understand what it takes to deploy production systems, and are ready to get their hands dirty by writing code that cleans up the data or performs core system functionality (lefthand side of the continuum). Gaining all these skills takes time.”[4]

Okay, so my reasoning that some statisticians work on computer science department is right, as well as there exists subject like computational statistics, so maybe I should go for computer science department but study statistics.

In fact, I am not the first one to arrive at the conclusion. Everything started from a confession made by John Tukey in “The Future of Data Analysis” article published in “The Annals of Mathematical Statistics” :

For a long time, I have thought I was a statistician, interested in inferences from the particular to the general. But as I have watched mathematical statistics evolve, I have had cause to wonder and to doubt. … All in all I have come to feel that my central interest is in data analysis, which I take to include, among other things: procedures for analyzing data, techniques for interpreting the results of such procedures, ways of planning the gathering of data to make its analysis easier, more precise or more accurate, and all the machinery and results of (mathematical) statistics which apply to analyzing data

If I am right then above confession was a critical moment. The time when mathematical statistics become more inferential and computational statistics concentrated more on predictive statistics. Applied statisticians working on predictive analytics that are more interested in applying the knowledge rather than developing long proofs decided to move on computer science department.

Additionally, the following is crucial discussion made by Leo Biermann in his paper published in Statistical Science titled “Statistical modelling: the two cultures”. It enables us to understand and differentiate views from both types of statistician, namely mathematical and statistical.

Statistics starts with data. Think of the data as being generated by a black box in which a vector of input variables x (independent variables) go in one side, and on the other side the response variables y come out. Inside the black box, nature functions to associate the predictor variables with the response variables … There are two goals in analyzing the data:

  • Prediction. To be able to predict what the responses are going to be to future input variables
  • InferenceTo [infer] how nature is associating the response variables to the input variables.”

Furthermore, in the same dispute we can read:

“The statistical community has been committed to the almost exclusive use of [generative] models. This commitment has led to irrelevant theory, questionable conclusions, and has kept statisticians from working on a large range of interesting current problems. [Predictive] modeling, both in theory and practice, has developed rapidly in fields outside statistics. It can be used both on large complex data sets and as a more accurate and informative alternative to data modeling on smaller data sets. If our goal as a field is to use data to solve problems, then we need to move away from exclusive dependence on [generative] models …”

So, we can say that Data Science evolved from Predictive Analytics which in turn evolved from Statistics but it becomes separate science. Tukey and Wilk 1969 compared this new science to established sciences and further circumscribed the role of Statistics within it:

“ … data analysis is a very di cult field. It must adapt itself to what people can and need to do with data. In the sense that biology is more complex than physics, and the behavioural sciences are more complex than either, it is likely that the general problems of data analysis are more complex than those of all three. It is too much to ask for close and effective guidance for data analysis from any highly formalized structure, either now or in the near future. Data analysis can gain much from formal statistics, but only if the connection is kept adequately loose”

How to study data science

So, what is exactly predictive analytics culture? I think that everyone who used Kaggle competition before can agree with me that description of common task framework (CTF) formulated by Marc Liberman in 2009 is a perfect description of Kaggle competitions, and hackathons events; where latter has worked as training sessions for newbies in the data world. An instance of the CTF has these ingredients:

  1. A publicly available training data set involving, for each observation, a list of (possibly many) feature measurements, and a class label for that observation.
  2. A set of enrolled competitors whose common task is to infer a class prediction rule from the training data.
  3. A scoring referee, to which competitors can submit their prediction rule. The referee runs the prediction rule against a testing dataset which is sequestered behind a Chinese wall. The referee objectively and automatically reports the score (prediction accuracy) achieved by the submitted rule

Kaggle competitions are not only training platforms for newbies like me but also very challenging statistical competitions where experienced statisticians can win “pocket money”. A famous example is the Netflix Challenge where the common task was to predict Netflix user movie selection. The winning team (which included ATT Statistician Bob Bell) won 1 mln dollars.

Comparing modules that are available on master in data science at University of Berkley[6]:

  1. Both
  • Applied machine learning
  • Experiments and causality
  1. Statistics
  • Research design and application for data and analysis
  • Statistics for Data Science
  • Behind the data: humans and values
  • Statistical methods for discrete response, Time Series and panel data
  • Data visualisation
  1. Computer Science
  • Python for Data Science
  • Storing and Retrieving Data
  • Scalling up! Really Big Data
  • Machine Learning at scale
  • Natural Language Processing with Deep Learning

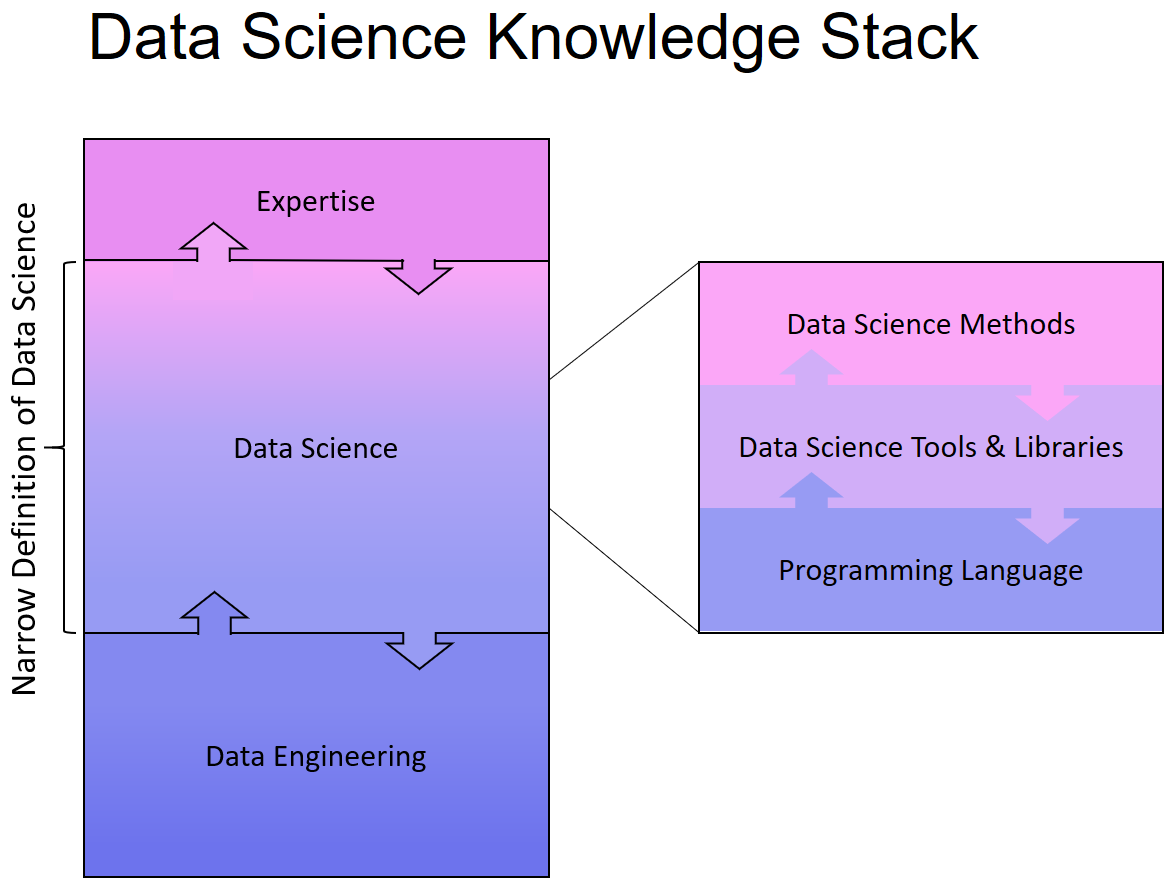
We can really see that data science is a subject that demands skills from both computer science and statistics. So, it is another confirmation for me that it is the best time to change department for my postgraduate study, that is, to study statistics on computer science department.

In the 50 Years of Data Science article we can read: “The activities of Greater Data Science are classified into 6 divisions:

  1. Data exploration and preparation
  2. Data representation and transformation
  3. Computing with data
  4. Data visualization and presentation
  5. Data Modelling
  6. Science about data science [5]

I will quickly go through all of them using my Ebola research example, this required using machine learning on time series data.

  1. The most demanding part. Many people told me before starting this project that: collecting, cleaning, wrangling and preparing data take 60% of all the time that you need to spend on data science project. I didn’t realise how much this 60% means in real time. I didn ‘t realise that the 60 percent will take so much time and that after this I will be exhausted. Exhausted but ready for the next step.
  2. This point is actually part of the first one, or maybe just like many other things in statistics: everything is one huge connected bunch.Data that you can find can be very nice, well behaving, written in CSV or JSON or any other format file that you can quickly download and use, but what if not? What if your data is ‘dirty’and not stored as a file (e.g. only appear on a website)? What if data is coded? Do you need to decode it?
  3. The even bigger challenge, but what a fun? You need to know a few different programming languages or least as I do know a little bit of R, a little bit of Python, quite well Tableau and Excel. So you can use different program in different scenarios or for different tasks. For example, using Panda to do EDA and ggplot 2 to do data vis.
  4. Graphs are pretty, right? If you are still reading my article, I bet you know what is heat map, spatial vis in big cities or different infographics. Surely, I would like to highlight, that we respect only the ones that are not only pretty but also valid. Nevertheless, time that is required to create these visualisations is another matter.
  5. The data modelling, finally? I don’t need to say a lot about this. All forms of inferential and predictive analytic are allowed and accepted.
  6. My favourite part, not the end yet. All the conferences and meetups that I can attend on. All the seminars where we all present our current projects.

Conclusions

After graduation, I will be graduated Statistician. Even more, I will be a mathematical statistician whom mostly during degree dealt with inferential statistics. On the other hand, winning data science scholarship gave me exposure to predictive analytic which I highly enjoyed. Therefore, for my next stage, I will just change my department and concentrate more on predictive analytic. There are many statisticians working on computer science department. They possess both statistical knowledge and advanced software engineering skills, they are called data scientists. It would be a pleasure for me to join them. I don’t mind if it will be MSc. Computer Science, MSc. Data Science, MSc. Big Data or whatever the name will be. I do mind to have sufficient exposure to deal with “dirty” data using statistical modelling and machine learning using modern technology. This is what data science is for me. Maybe for you, it will be something else. Maybe you will be more satisfied with expanding massively programming skills. But for me, programming is a tool, modern technology is my friend and my bread and butter will be predictive analytic.

References

  1. IMS Presidential Address: Let us own data science
  2. Data science is statistics
  3. A Gelman, Columbia University
  4. Yanir Seroussi: What is data Science?
  5. 50 Years Data Science
  6. Curriculum: data science@Berkley

Künstliche Intelligenz und Data Science in der Automobilindustrie

Data Science und maschinelles Lernen sind die wesentlichen Technologien für die automatisch lernenden und optimierenden Prozesse und Produkte in der Automobilindustrie der Zukunft. In diesem Beitrag werde die zugrundeliegenden Begriffe Data Science (bzw. Data Analytics) und maschinelles Lernen sowie deren Zusammenhang definiert. Darüber hinaus wird der Begriff Optimizing Analytics definiert und die Rolle der automatischen Optimierung als Schlüsseltechnologie in Kombination mit Data Analytics dargelegt. Der Stand der Nutzung dieser Technologien in der Automobilindustrie wird anhand der wesentlichen Teilprozesse in der automobilen Wertschöpfungskette (Entwicklung, Einkauf, Logistik, Produktion, Marketing, Sales und Aftersales, Connected Customer) an exemplarischen Beispielen erläutert. Dass die Industrie heute erst am Anfang der Nutzungsmöglichkeiten steht, wird anhand von visionären Anwendungsbeispielen verdeutlicht, die die revolutionären Möglichkeiten dieser Technologien darstellen. Der Beitrag zeigt auf, wie die Automobilindustrie umfassend, vom Produkt und dessen Entstehungsprozess bis zum Kunden und dessen Verbindung zum Produkt, durch diese Technologie effizienter und kundenorientierter wird.

english-flagRead this article in English:
“Artificial Intelligence and Data Science in the Automotive Industry”

Read more